Surface Water Hydrology Learning Objectives To be able

Surface Water Hydrology Learning Objectives • To be able to quantify watershed attributes (7. 1) • To be able to describe the role of atmospheric and ocean circulation in hydrology and the formation of precipitation (7. 1) • To be able to quantify the variability of precipitation, calculate area average precipitation and determine design storm amounts (7. 2) • To be able to calculate evaporation from an open water surface (7. 3)

Watershed delineated on a topographic map

Streamstats • http: //water. usgs. gov/osw/streamstats/utah. html

From Dingman, 1994

General Circulation of the Atmosphere, Bedient Fig 1 -3 a

Three-Cell Model From Simon Wang

Three-Cell Model: Scientific evolution Halley Thermally direct circulation forcing air towards equator Hadley Earth’s rotation and the conservation of linear momentum cause the Trade Winds Ferrel Coriolis force deflects winds toward the east and pulls air from south + Conservation of angular momentum 170 years! Slide from Simon Wang

Coriolis Effect http: //www. youtube. com/watch? v=_36 Mi. CUS 1 ro&feature=related
 3.")
Formation of Precipitation 1. Source of moisture 2. Lifting mechanism (frontal, orographic, convective) 3. Phase change from vapor to water - Energy 4. Small nuclei or dust for droplet formation 5. Droplets must grow as they fall to earth From Bedient

Lifting Mechanisms From Bedient

Ralph, F. M. , P. J. Neiman, G. A. Wick, S. I. Gutman, M. D. Dettinger, D. R. Cayan, and A. B. White (2006), Flooding on California's Russian River: Role of atmospheric rivers, Geophys. Res. Lett. , 33, L 13801, doi: 10. 1029/2006 GL 026689.

From Bedient Hurricane Katrina in the Gulf - 8/29/2005 Katrina 08 -28 -2005 at 17: 00 UTC

Measuring Rainfall - Tipping Bucket • Recording gage • Collector and Funnel • Bucket and Recorder • Accurate to. 01 ft • Telemetry- computer From Bedient

Shielded and Unshielded weighing Precip (Rain and Snow Gages Snow Pillow

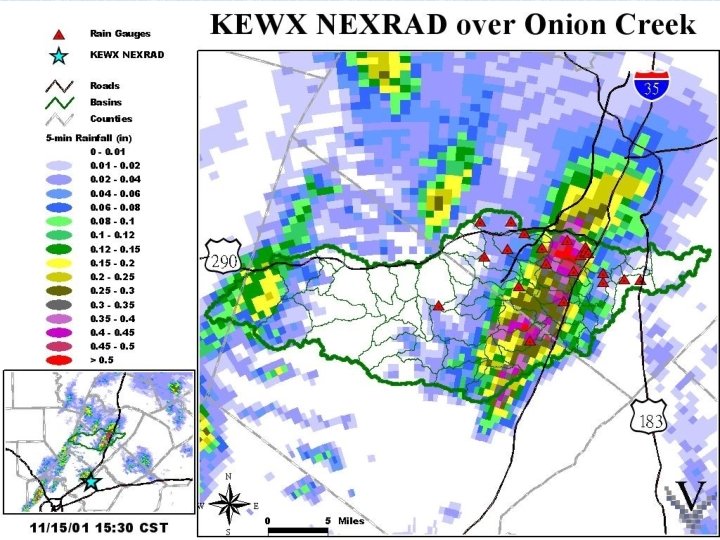
RADAR Rainfall Estimates • NEXRAD provides real-time data on a ~16 km 2 (6 mi 2) grid • Each estimate represents an average rainfall amount over the entire 4 x 4 km 2 area • NEXRAD rainfall estimates compare well with point rain gage measurements (r 2 ~ 0. 9) From Bedient

http: //www. prism. oregonstate. edu/

Normal monthly distribution of precipitation in the US in inches From Mays, 2011, Ground and Surface Water Hydrology

From Bedient Rainfall Averaging Methods
 http: //hdsc. nws. noaa.")
NOAA Hydrometeorological Design Studies Center Precipitation Frequency Data Server (PFDS) http: //hdsc. nws. noaa. gov/hdsc/pfds/ The standard source for design storm data CEE 3430 – Spring 2011 David Tarboton 20
- Slides: 20