Surface Station Model http craigsweb netmystuffWx Symbols gif

Surface Station Model
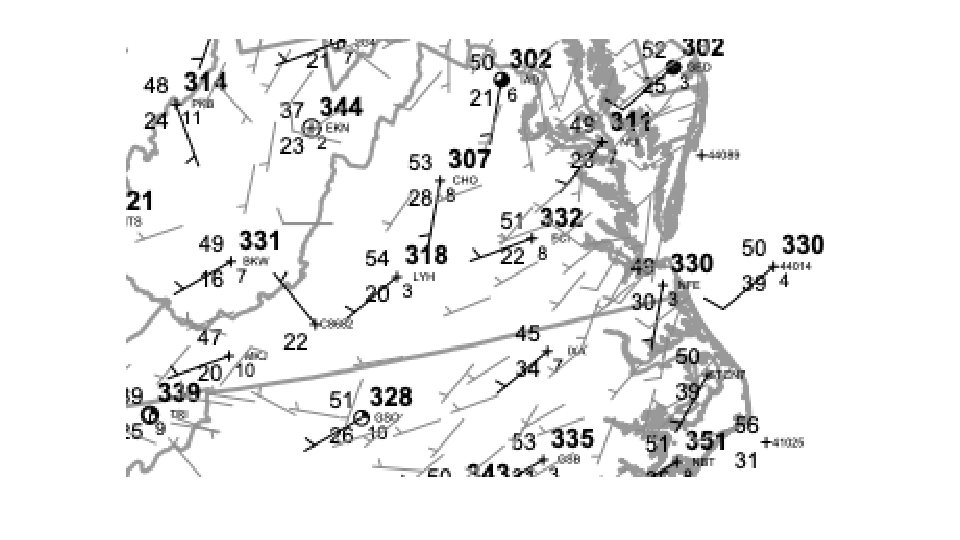

http: //craigsweb. net/mystuff/Wx. Symbols. gif
 31 Dew Point Temperature (°F) 29")
Temperature (°F) 31 Dew Point Temperature (°F) 29
 31 011 29")
314 1031. 4 mb 800 980. 0 mb Sea-level Pressure (mb) 31 011 29 Tenths decimal point is implied. Normal pressure range is 950– 1050 mb. 011 = 1001. 1 mb (NOT 901. 1 mb…too low) 985 = 998. 5 mb (NOT 1098. 5 mb…too high)
")
Pressure change over previous 3 hours. 31 011 – 12 29 Pressure tendency (mb)

Pressure change over previous 3 hours. Sea-level pressure rose then dropped over previous 3 hours and is 1. 2 mb lower than it was 3 hours ago. 31 011 – 12 29 What was the pressure 3 hours ago? Current = 1001. 1 mb + 1. 2 mb = 1002. 3 mb Pressure tendency (mb)
 1/8 2/8 31 4/8 5/8 6/8")
clear Cloud Cover (total portion of sky covered) 1/8 2/8 31 4/8 5/8 6/8 011 – 12 29 7/8 8/8 sky is obscured: fog, haze, blowing smoke, sandstorm, …
 31 011 – 12 5")
Wind direction 50 kts. 10 kts. Wind speed (knots) 31 011 – 12 5 kts. 29 calm 1 nautical mile (knot) = 1. 15 statute miles

Current weather 31 011 – 12 29
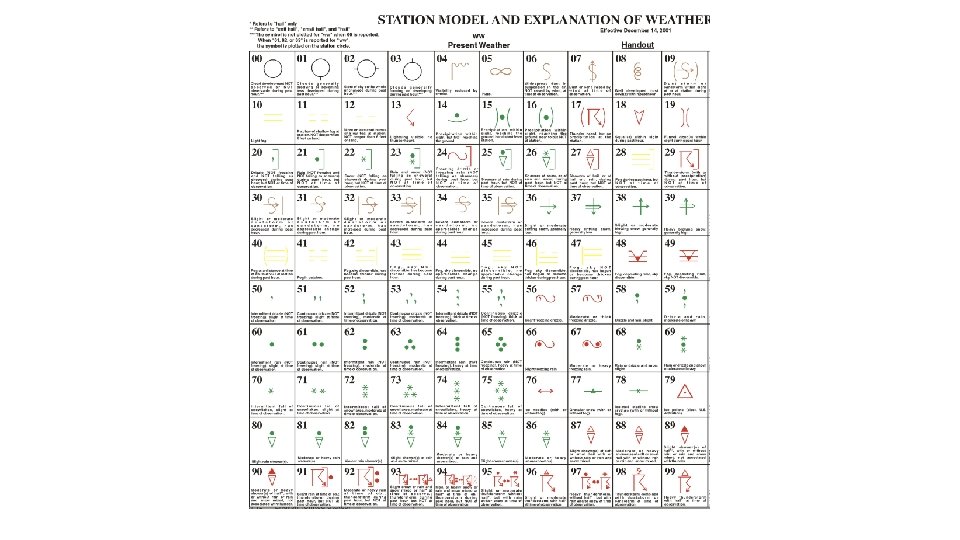

intensity Light intermittent rain Light continuous rain Moderate intermittent rain Moderate continuous rain Heavy intermittent rain Intensity: light, moderate, heavy Duration: intermittent, continuous duration Heavy continuous rain

Light intermittent drizzle Light continuous drizzle Moderate intermittent drizzle Moderate continuous drizzle Heavy intermittent drizzle Heavy continuous drizzle Light intermittent snow Light continuous snow Moderate intermittent snow Moderate continuous snow Heavy intermittent snow Heavy continuous snow

light shower Light to moderate thunderstorm “in the distance” moderate to heavy shower hail sleet severe thunderstorm “within past hour but not at time of observation”

Fog symbols Freezing rain and freezing drizzle Smoke and haze

31 011 – 12 29
 • Station model")
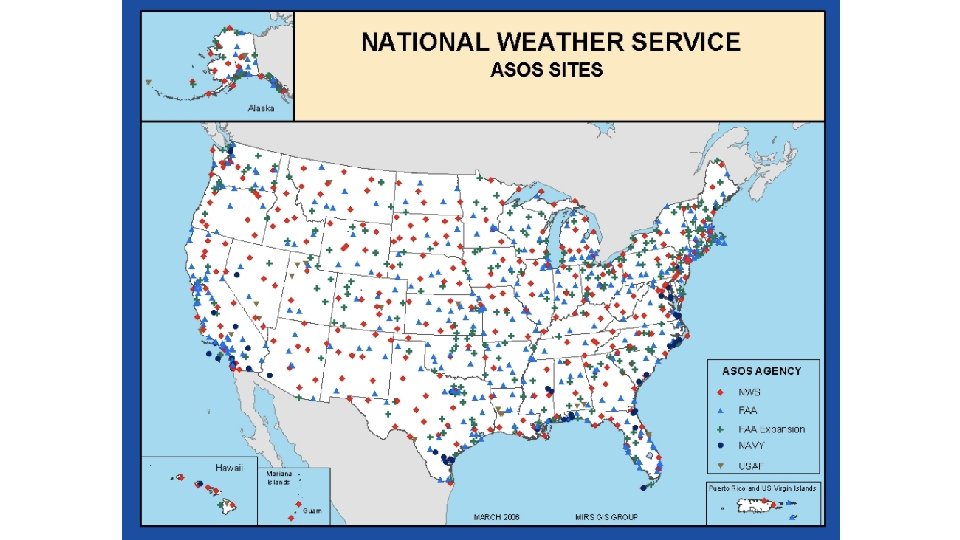
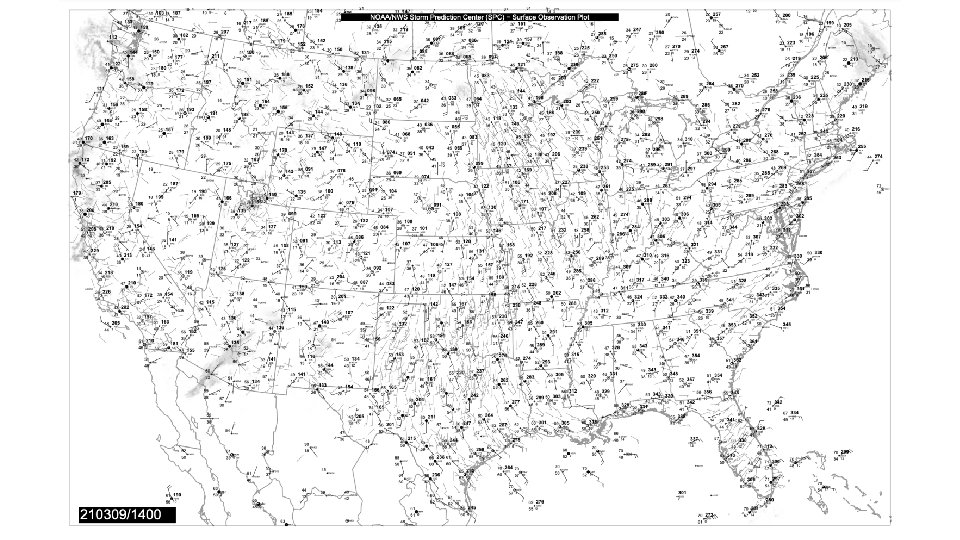
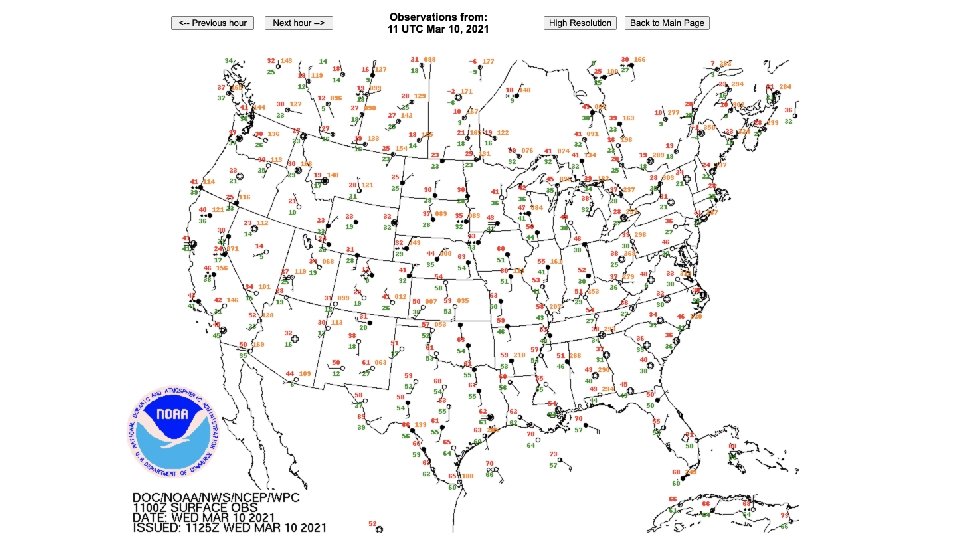
Station Model Resources (links are also active on class web page) • Station model sheet download (http: //craigsweb. net/mystuff/Wx. Symbols. gif) • Station model practice (http: //cimss. ssec. wisc. edu/wxwise/station/page 5. html) • Current surface maps with station models plotted (https: //www. wpc. ncep. noaa. gov/sfcobs/sfcobs. shtml#sfctable ) • More maps and station model explanation (https: //www. spc. noaa. gov/exper/surface. Maps/)
- Slides: 21