Surface Processes n n n Mass Wasting Streams
 (Shorelines) (Deserts)")


 B. Examples (Appling knowledge")


 both slides and flows n Sliding")


 B. Stream Velocity (controls and")


 V-Shaped Valley Flood Plain")
")
")

 n")


 n Hydraulic")


- Slides: 45
Surface Processes n n n Mass Wasting Streams Ground Water (Glaciers) (Shorelines) (Deserts)
Monument Valley, Arizona
Stream Carved Landscapes
Three Sisters, Cascades, Oregon
Denali National Park, by Berann
Yosemite, Bridal Vail Falls
Karst Topography from GW action
XI. Mass Wasting A. Classifications (Definitions, processes and controlling factors) B. Examples (Appling knowledge of processes) C. Prevention of Mass Wasting (limiting and eliminating)
Flow Classification of Mass Wasting Slide Fall
Classification of Mass Wasting Classification Material Flow Fall Slide Type of Movement Velocity Creep Debris Imperceptibly Slow Earth Flow Debris Mudflow Saturated Debris Slope and Material Dependent <5 km/hr Avalanche Debris or Rock Very Fast 100 km/hr Rotational Slide Debris Slow-mod. (short) Rock Slide Bedrock Fast Debris Fall Debris Fast Rockfall Bedrock Fast
Creep n n Imperceptibly slow flow Expansion - contraction n n Heating – Cooling Freeze – Thaw
Earth Flow and Rotational Slide n Debris (soil) both slides and flows n Sliding n n n Rotation (tilting) Scarp Flow n n Mixing Hummocks
Rock Slide and Fall n Bedrock may slide and/or fall n Weathering reduces bedrock strength Eventually gravity wins n
Talus Slopes n The result of n n Mechanical weathering Rock falls and slides Crushing and abrasion (more mechanical weathering) Rock Avalanches n Slopes of rock fragments may let go and careen downhill as a very fast flow
Mass Wasting, Who Cares? n n Geology in the news? How does it effect you? (Environmental Geology) n Know where to look n Understand risks n Reduce and prevent risks n Improve engineering n We need to understand how mass wasting works
Shear Force vs. Shear Strength n Driving Forces i. e. , Shear Force n Component of Gravity n Other forces n Resisting Forces i. e. , Shear Strength n Fiction and Adhesion n Soil or Rock
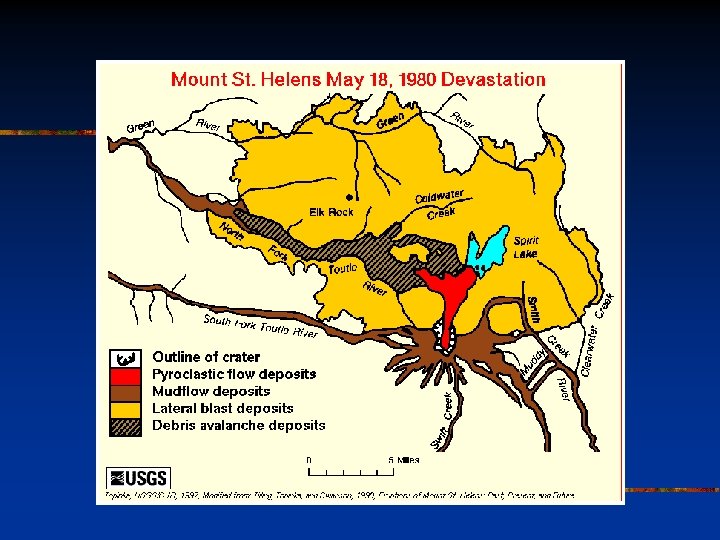
Mt. St. Helens n Landslide triggers eruption n Reduced shear strength from earthquakes and bulging Increased shear force as bulge grows and slopes steepen Eruption causes Mudflows
Gros Vantre Slide n n n Sandstone and debris on Impermeable shale Saturation of sandstone and lubrication of shale Both reduced shear strength (added to shear force) Shear force overcomes shear strength Sandstone and debris slide
Use Knowledge of Mass Wasting to Avoid Risks n Be able to recognize geologically unstable situations
Understanding Mass Wasting Development causes: n Increased shear force n n n Steepened slope Added weight Decreased shear strength n n n Devegetation Reworking of fill Saturation of soil
Reduce Risks Some solutions include: n Increase shear strength n n Re-compact soils Re-vegetate soil slopes Construct retaining wall with anchors Prevent Saturation n Prohibit over-irrigation Install surface drains Install subsurface drains
Reduce Risks n n Increase shear strength with iron rods and anchors Remove risk
Examples of Mass Wasting n The Old Man of the Mountain, Cannon Mtn. NH
X. Streams A. The Hydrologic Cycle (components and pathways) B. Stream Velocity (controls and results) C. Drainage Patterns and Landscape Features (results of erosion and deposition) D. Stream Valley Development (tectonic uplift and downcutting)
The Hydrologic Cycle See Fig. 12. 3
Drainage Basins n Systems of streams and their tributaries that collect runoff n n Divide Ground Water Great Lakes Drainage Basin
Steam Profiles (Streams Shaping the Land) V-Shaped Valley Flood Plain
What is this Drainage Pattern? (What does is tell of the geology? )
Valley and Ridge Province of PA (Trellis Stream Patters)
Stream Gradient n n Slope of the land Sinuosity of stream 10 m 1 km 10 m/km 10 m per 1¼ km = 8 m/km
Meander Velocity n Higher velocities on outside of meanders causes erosion (cut bank) n Lower velocities on inside of meanders causes deposition (point bar) n Fig. 10. 6
Channel Shape and Roughness A. Narrow and Deep n n Less resistance Faster flow B. Wide and Shallow n n More resistance Slower flow C. Rough Streambed n n More resistance Slower flow
Stream Velocity Controls: n n n Erosion Transport Deposition
Stream Erosion First, Weathering n n Then, Erosion n Solution (chemical weathering) n Hydraulic Action (lifting) n Abrasion (crushing and grinding) n Fig 10. 11 Fracturing (mechanical) Loosening (mechanical and chemical) Solution (chemical)
Stream Transport n n n Dissolved Load Suspended Load Bed Load n n Saltation Rolling, sliding Fig 10. 14 (ions)
Stream Deposition n Erosion Dominated n e. g. , Alluvial Fans n n n Braided Streams Deposition Dominated n Alluvial Fan Fig. 10. 31 Fig. 10. 19 High gradients Less resistance Fast velocities n n Lower gradients More resistance Lower velocities
Stream Deposition n Midchannel bars Fig. 10. 18 a n Point bars Fig 10. 22 b n Braided streams Fig. 10. 18 b
Deltas n Reduction of velocity due to extreme widening n Deposition of silt and clay Fig. 10. 28
Erosion and Deposition Transport E. g. , Meandering streams n As meanders are migrating n n n Cutbanks eroding Point bars building Sediment is moving downstream
Meander Cutoff How does the gradient change with meandering and meander cutoff?
Meandering Streams D Identify n Cutbanks n Point bars n Meander neck n Oxbow lakes n n Areas of Erosion Areas of Deposition Fig. 10. 20 A C B E
Natural Levees n n Flooding Overbank deposits Widening of stream into flood plain Deposition of sediment n n Coarse near stream Fine farther away Fig. 10. 27
Graded Streams Increased velocity and accelerated erosion. Base level: Lake or Sea Erosion acts to grade the Longitudinal stream profile to concave-upward curve Same Base level
Drainage Patterns Geology controls stream patterns A. Dendritic A. Uniformly Erodible (e. g. , flat-lying sedimentary rocks of the Midwest) B. Conical Mountains B. Radial (e. g. , Volcanoes) C. Fractured bedrock (shallow bedrock) C. Rectangular D. Resistant ridges of tilted sedimentary rocks (e. g. , Valley and Ridge Province of Pennsylvania) D. Trellis