Supply Demand Approach CAP SAM EMS Basin Study

Supply & Demand Approach— CAP: SAM EMS Basin Study Supply & Demand Team Meeting #1 January 15, 2019 Ken Seasholes Manager, Resource Planning & Analysis Central Arizona Project

Water Supply & Demand Some of the major factors that affect water supply, demand reliability: § Growth § Shortage § Climate Variability § Socio-Economic Changes § Agricultural Trends § Water Storage Preferences § Policy Changes § Behavioral Shifts § …. “Driving Forces”

Supply & Demand Challenges • Complex relationships among supply & demand factors – Within demand (e. g. , housing development on Ag land) – Within supply (e. g. , use of long-term CAP contracts affects Excess CAP) – Between supply & demand (e. g. , reductions in interior use affect effluent supplies) • Significant uncertainties across multiple dimensions – – – The rate of growth The location of growth Changes in current and future demand factors The use of different supply types The reliability of those supplies
 • Tool for projecting supply and demand in")
CAP Service Area Model (CAP: SAM) • Tool for projecting supply and demand in CAP’s three county service area – 135 entities (municipal providers, irrigation districts, Tribes, AWBA, CAGRD, etc. ) – 16 water supply types • Accounts for complex legal and physical characteristics of users and supplies • Designed to easily generate “what-if” scenarios

Growth Rates Large Established City Small Bedroom Community Exurban Community Medium Established City 5

Growth Patterns Outward Growth Infill Redevelopment 2040 Water Providers
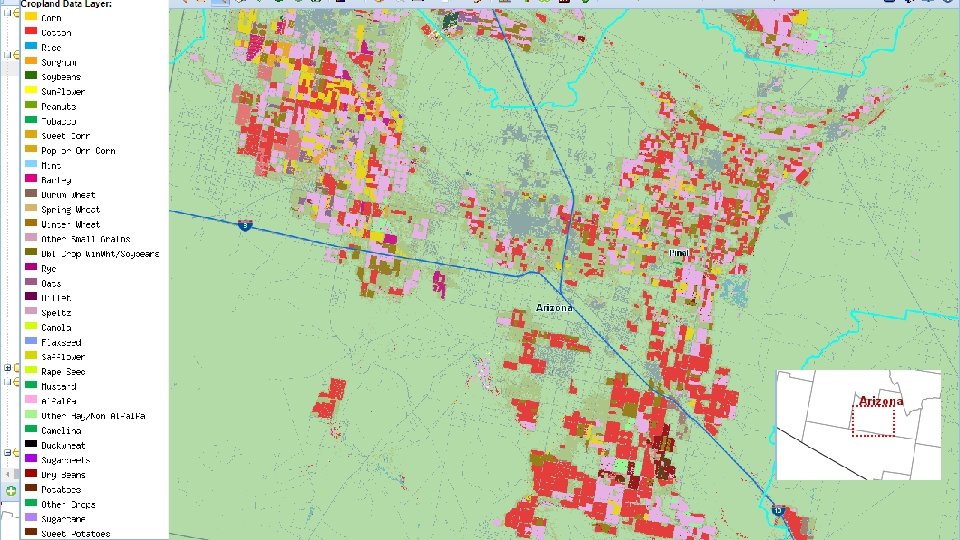

Urbanization of Agricultural Land • The spatial housing unit scenarios can be used to project urbanization of agricultural land • Agricultural Data: – Acreage by Crop Type (NASS, 2008 -2014) – Usage by Supply Type (ADWR, 1985 -2013) – Crop Consumptive Use (ADWR) National Agricultural Statistics Service Crop. Scape Data Layer, 2013 Town of Gilbert Queen Creek Chandler Heights
 partnerships •")
Other CAP: SAM Agricultural Factors • Recharge via Groundwater Savings Facility (GSF) partnerships • On-Reservation Tribal agricultural use • Changes in cropping patterns – Substitution of higher water use crops • Changes in evapotranspiration due to climate change • Changes in efficiency/irrigation technology
 Te Pr mp, ec ip, etc tal nmen")
Model Integration Global Circulation Models (GCMs) Te Pr mp, ec ip, etc tal nmen Enviro ts impac . Regional Downscaling & (Statistical or Dynamical; VIC; etc. ) Ev tra apo ns pir at io s” ic “Trace Hydrolog n ly pp Su AZ to Su to pply CA P Colorado River Simulation System (CRSS) Ev a Na potr tur ans al pi Re rat ch ion ar ge Supply & Demand by Entity CAP: SAM Pumping & Recharge by Entity Arizona On-River Uses wth ns Gro jectio Pro Applied Economics) Water Supply Portfolios, Use, etc. (ADWR, CAP) Distribution of Streambed & Mnt. Recharge by Cell W Su ater pp lie s Land Use, Housing & Pop (COGs, Census, Distribution of Pumping & Recharge GW Levels Groundwater Flow Model (MODFLOW)
- Slides: 10