SUPPLY CHAIN PERFORMANCE MEASUREMENT Performance Measurement Metrics Performance


. Designing")
. Metrics and")


 If our interest is in reducing lead")
. Metrics and")

 Overall Performance Measurement System Warehouse Metrics Metric Sets Holding Cost")


 Supply Chain Council. Supply Chain Operations Reference (SCOR®) Model")
. 2017. Introduction to SCOR - How to")
. 2017. Introduction to SCOR - How to")
. 2015. SCOR 101—APICS for Business")
. 2017. Introduction to SCOR - How to")
. 2017. Introduction to SCOR - How to")
. 2017. Introduction to SCOR - How to")
. 2017. Introduction to SCOR - How to")

 Model Overview version 10.")
 Model Overview version 10.")
. 2015. SCOR 101—APICS for Business")

 The cash conversion cycle (CCC) is a metric that expresses")
 • Days Inventory Outstanding (DIO), also known as Days Sales")


- Slides: 55
SUPPLY CHAIN PERFORMANCE MEASUREMENT
Performance Measurement & Metrics • Performance measurement is the process of collecting, analyzing and/or reporting information regarding the performance of an individual, group, organization, system or component [1]. • Metric is a verifiable measure, stated in either quantitative or qualitative terms and defined with respect to a reference point. Ideally, metrics are consistent with how the operation delivers value to its customers as stated in meaningful terms[2]. 1. 2. Upadhaya, B. , Munir, R. , & Blount, Y. (2014). Association between Performance Measurement Systems and Organisational Effectiveness. International Journal of Operations & Production Management, 34(7), 2 -2. Melnyk, Steven & M Stewart, Douglas & Swink, Morgan. (2004). Metrics and Performance Measurement in Operations Management: Dealing With the Metrics Maze. Journal of Operations Management. 22. 209 -218. 1016/j. jom. 2004. 01. 004.
Objectives of Performance Measurement • To monitor & control • To communicate company’s objectives to various functions within Supply Chain • To know where the company’s position relatives to its competitors and its own objectives • To determine improvement policies Pujawan, Nyoman. 2017. Supply Chain Management 3 rd Edition
Objectives of Performance Measurement • Control: Metrics enable managers and workers to evaluate and control the performance of the resources for which they are responsible. • Communication: Metrics communicate performance not only to internal workers and managers for purposes of control, but to external stakeholders for other purposes as well (e. g. , Wall Street, the EPA or to a bank). Many times stakeholders and users of metrics do not understand the workings and processes of a firm or operation, nor do they need to. Well-designed and communicated metrics provide the user a sense of knowing what needs to be done without necessarily requiring him/her to understand the intricacies of related processes. Poorly developed or implemented metrics can lead to frustration, conflict, and confusion. • Improvement: Metrics identify gaps (between performance and expectation) that ideally point the way for intervention and improvement. The size of then gap and the direction of the gap (positive or negative) provide information and feedback that can be used to identify productive process adjustments or other actions. Melnyk, Steven & M Stewart, Douglas & Swink, Morgan. (2004). Metrics and Performance Measurement in Operations Management: Dealing With the Metrics Maze. Journal of Operations Management. 22. 209 -218. 1016/j. jom. 2004. 01. 004.
Designing Effective Metrics 1. A metric should be verifiable Based on an agreed upon set of data and a well-understood and well-documented process for converting this data into the measure. Given the data and the process, independent sources should be able to arrive at the same metric value 2. Metrics should be value-based. A metric should be linked to how the operation delivers value to its targeted customers and other stakeholders in the process. For example, worker safety-oriented metrics are important, but indirectly related to customer value. Melnyk, Steven & M Stewart, Douglas & Swink, Morgan. (2004). Metrics and Performance Measurement in Operations Management: Dealing With the Metrics Maze. Journal of Operations Management. 22. 209 -218. 1016/j. jom. 2004. 01. 004.
Designing Effective Metrics 3. Metrics should capture characteristics or outcomes in a numerical or nominal form 4. Metrics provide a means of distilling the volume of the data while simultaneously increasing its information richness 5. Metric shouldn't create conflicts between different functions Melnyk, Steven & M Stewart, Douglas & Swink, Morgan. (2004). Metrics and Performance Measurement in Operations Management: Dealing With the Metrics Maze. Journal of Operations Management. 22. 209 -218. 1016/j. jom. 2004. 01. 004.
Metric Definition Template Lohman, C. , Fortuin, L. , & Wouters, M. (2004). Designing a performance measurement system: A case study. European journal of operational research, 2004(156), 267 -286. DOI: 10. 1016/S 0377 -2217(02)00918 -9
Metrics Attribute Melnyk, Steven & M Stewart, Douglas & Swink, Morgan. (2004). Metrics and Performance Measurement in Operations Management: Dealing With the Metrics Maze. Journal of Operations Management. 22. 209 -218. 1016/j. jom. 2004. 01. 004.
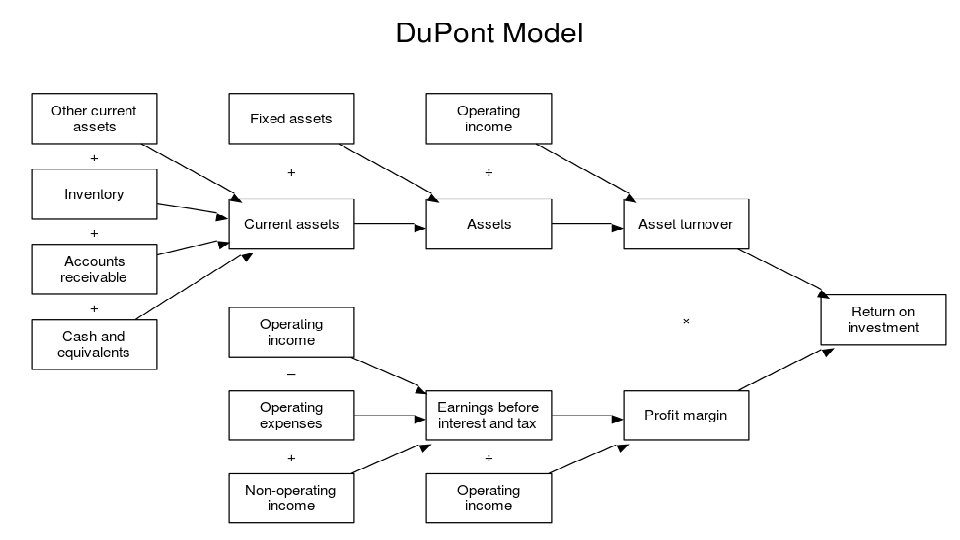
Metrics Focus – Financial vs Operations Financial metrics define the pertinent elements in terms of monetary resource equivalents Operational metrics tend to define elements in terms of other resources (e. g. , time, people) or outputs (e. g. , physical units, defects). Melnyk, Steven & M Stewart, Douglas & Swink, Morgan. (2004). Metrics and Performance Measurement in Operations Management: Dealing With the Metrics Maze. Journal of Operations Management. 22. 209 -218. 1016/j. jom. 2004. 01. 004.
Metrics Tense – Outcome vs Predictive Metrics tense, refers the how the metrics are intended to be used. Metrics can be used to both to judge outcome performance and to predict future performance. • An outcome-oriented use of a metric implicitly assumes that the problems and lessons uncovered from a study of past outcomes can be applied to current situations • A predictive use of a metric is aimed at increasing the chances of achieving a certain objective or goal. Melnyk, Steven & M Stewart, Douglas & Swink, Morgan. (2004). Metrics and Performance Measurement in Operations Management: Dealing With the Metrics Maze. Journal of Operations Management. 22. 209 -218. 1016/j. jom. 2004. 01. 004.
Metrics Tense – Outcome vs Predictive (2) If our interest is in reducing lead time, then we might assess metrics such as distance covered by the process, setup times, and number of steps in the process. Reductions in one or more of these areas should be reflected in reductions in lead time. Predictive metrics are appropriate when the interest is in preventing the occurrence of problems, rather than correcting them. Melnyk, Steven & M Stewart, Douglas & Swink, Morgan. (2004). Metrics and Performance Measurement in Operations Management: Dealing With the Metrics Maze. Journal of Operations Management. 22. 209 -218. 1016/j. jom. 2004. 01. 004.
Metrics Attribute Melnyk, Steven & M Stewart, Douglas & Swink, Morgan. (2004). Metrics and Performance Measurement in Operations Management: Dealing With the Metrics Maze. Journal of Operations Management. 22. 209 -218. 1016/j. jom. 2004. 01. 004.
Level of Metrics • Individual Metrics: Lowest level; scope-wise, this is the most specific one. • Metrics Sets: (self explanatory) • Overall performance measurement system: Coordinating metrics across the various functions and for aligning the metrics from the strategic (top management) to the operational (shopfloor/purchasing/execution) levels Melnyk, Steven & M Stewart, Douglas & Swink, Morgan. (2004). Metrics and Performance Measurement in Operations Management: Dealing With the Metrics Maze. Journal of Operations Management. 22. 209 -218. 1016/j. jom. 2004. 01. 004.
Level of Metrics (2) Overall Performance Measurement System Warehouse Metrics Metric Sets Holding Cost Logbook Accuracy Inventory Turnover (Flow time) Other Functions’ Metric i. e: Distributions, Purchasing, Sales, etc Credit & Collection Metrics Logbook Accuracy Individual Metrics Receivable collection cycle time % Allowance of bad Debt
POA Performance of Activity Chan, Felix TS, and H. J. Qi. "Feasibility of performance measurement system for supply chain: a process-based approach and measures. " Integrated manufacturing systems 14. 3 (2003): 179 -190.
Chan, Felix TS, and H. J. Qi. "Feasibility of performance measurement system for supply chain: a process-based approach and measures. " Integrated manufacturing systems 14. 3 (2003): 179 -190.
Metrics Board of POA 1. 2. 3. 4. 5. 6. 7. Cost Time Capacity Capability Effectiveness, Reliability, Availability, Flexibility Productivity Utilization Outcome
Metrics Board of POA 1. Cost The financial expense to carry out one event or activity. Cost is always one of the indispensable aspects in assessing the performance of the business activities and processes. Since the resources are consumed, there exists cost. This dimension records the inputs consumed, and also reflects the effectiveness of cost control. Besides the entire cost of a specific activity or process, the percentages of individual cost, such as labor cost, materials cost, or rework and scraps, in the whole need to be measured and evaluated, the effect of cost control.
Metrics Board of POA 2. Time - the time between the beginning and completion of one specific event or activity. Time is an important resource in modern business environments, especially where JIT and quick response prevails. The shorter the response time, the more customer satisfaction. Similar to cost, time is another indispensable dimension. All the operation times of each activity together compose the response time of the entire supply chain. Hence, in order to understand the supply chain operation, it is necessary to measure the activity time. Similar to cost, the percentages of individuals in the whole chain need to be assessed.
Metrics Board of POA 3. Capacity - the ability of one specific activity to fulfill a task or perform a required function. This dimension mainly concerns the maximum amount of tasks that a process or an activity can complete under the normal conditions. Production capacity and transport capacity are two typical examples.
Metrics Board of POA 4. Capability - a talent or ability of one activity to be used, treated, or developed for the specific purposes and required functions. It is the aggregate ability by which the activity or process functions.
Metrics Board of POA • Effectiveness - the ability of one specific event or activity to achieve an intended or desired effect in performing the functions or taking the responsibilities. Each process or activity is supposed to perform the specific functions in the operation context. Some of them perform materials transferring and handling, and others perform manufacturing. • Effectiveness of the activity or process is concerned with ability to perform the due functions. In warehouse management, inventory accuracy in cycle counting and documents is one of the performances in effectiveness of inventory management. Inventory accuracy is critical for controlling stock loss and warehousing costs.
Metrics Board of POA • Reliability The ability of one specific event or activity to perform a required function under stated conditions for a stated period of time. Reliability emphasizes the conditions under which the activity or process is performed. It reflects the dependability, especially from customers' viewpoint. For example, customers expect the delivery reliability in timeliness and being free from errors as an important performance measure. Similarly, transportation reliability, material supplying reliability, and order processing reliability are often used to assess the performance of the corresponding process and activity.
Metrics Board of POA • Availability The ability to bring about effective or beneficial results or the degree to which one specific functional activity is ready when needed. Availability refers to the readiness, i. e. the degree, percent, or probability that a system will be ready or available when required for use. It reflects one of the aspects of management effect of specific activities and processes. For example, inventory availability in each storage node is a critical performance for inventory management. Order fill rate and stockout rate are two aspects of inventory availability. Order fill rate refers to the percentage of demand order which can be immediately filled from stock. Stockout rate is related to the frequency of stockout per order cycle. Another example is order and inventory information availability, which reflects the cooperation effect of supply chain members in sharing real- time information about the order and inventory level. The information sharing is important for improving planning and controlling inventory investment.
Metrics Board of POA • Flexibility The ability of one specific activity to adapt to the varying functional requirements or respond to the changes. Flexibility is based on the range of a variable capacity of tasks, processes or activities that can be completed in the specific period of time and at a reasonable cost. It reflects the ability of the activity and process to deal with the changing requirements or emergent situations. Flexibility is critical, especially in the cases of quick response and JIT environment. Most often, production flexibility in volume and product mix can be used to assess the production process. Other examples are transportation flexibility in goods mix and goods lot size, and order delivery flexibility in lot size.
Metrics Board of POA 5. Productivity The rate at which one specific event or activity adds value at the cost of resources. It is based on the ratio of the effective or useful output to the total input, e. g. capital, labor, raw materials, and energy. It measures the extent to which the resources are being used effectively in transforming inputs to outputs. Total productivity, multi-factor productivity, and partial factor productivity are often used. Total productivity is based on the ratio of total output to total input reflects. Multi-factor productivity, based on total output to subset of input, shows the interaction between each input. The multi- factor productivity most often used considers labor and materials, or labor and capital. Partial factor productivity, based on the ratio of total output to single input, reflects the impact of single input separately on the output. Labor, capital, materials, energy productivity are suggested.
Metrics Board of POA 6. Utilization – The utilizing rate of the resources to carry out one specific activity. In such cases as warehousing process and production process, the utilization of space and labor are the important measures. Utilization reflects the ability of resources management and the effect of strategies and planning.
Metrics Board of POA 7. Outcome – The results or value added of one specific activity and event. Outcomes of an activity or a process may be the value added to products and services, and may be just the finished products. For example, in transportation and storage, outcome is fairly intangible and is not easy to measure. In most practical cases, outcome is not certain to be measured, except in a production process that produces goods.
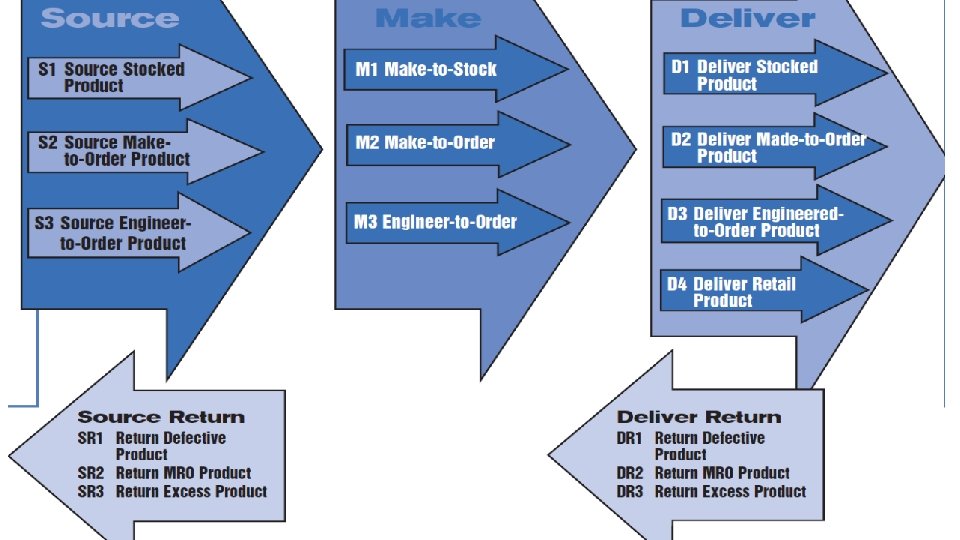
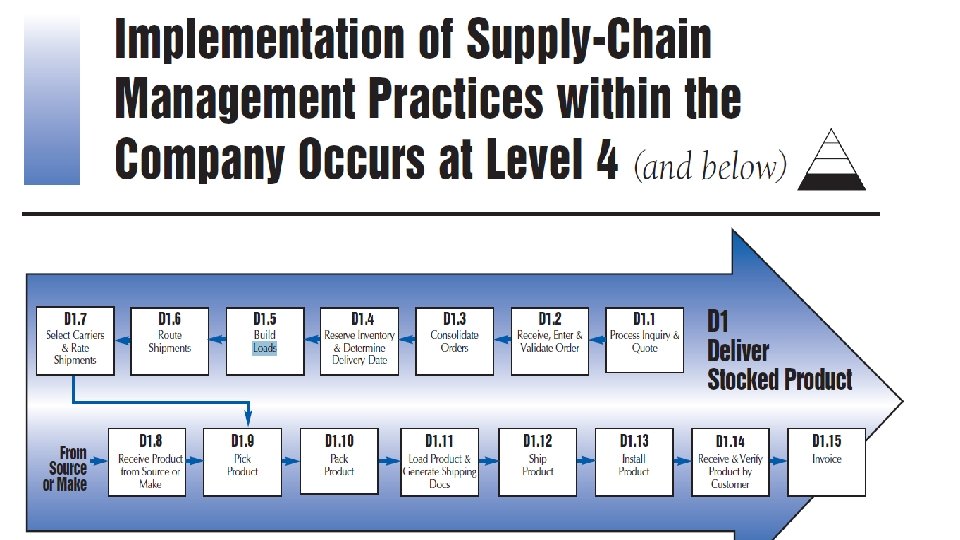
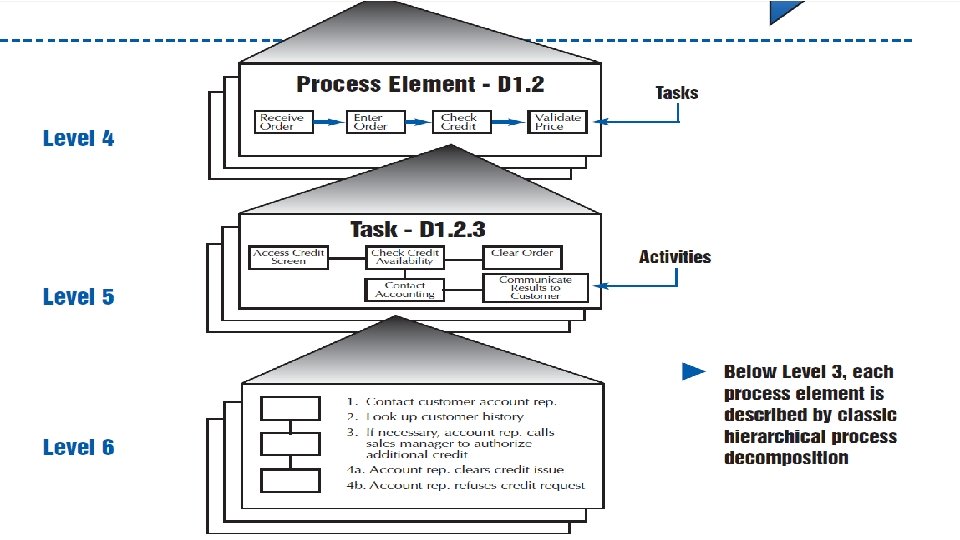
SCOR Supply Chain Operations Reference
Supply Chain Operations Reference (SCOR) Supply Chain Council. Supply Chain Operations Reference (SCOR®) Model Overview version 10. 0.
American Production and Inventory Control Society (APICS). 2017. Introduction to SCOR - How to make an impact.
American Production and Inventory Control Society (APICS). 2017. Introduction to SCOR - How to make an impact.
American Production and Inventory Control Society (APICS). 2015. SCOR 101—APICS for Business
American Production and Inventory Control Society (APICS). 2017. Introduction to SCOR - How to make an impact.
American Production and Inventory Control Society (APICS). 2017. Introduction to SCOR - How to make an impact.
American Production and Inventory Control Society (APICS). 2017. Introduction to SCOR - How to make an impact.
American Production and Inventory Control Society (APICS). 2017. Introduction to SCOR - How to make an impact.
Example of SCOR Metrics & Its Derivation Supply Chain Council. Supply Chain Operations Reference (SCOR®) Model Overview version 10. 0.
SCOR Metrics Supply Chain Council. Supply Chain Operations Reference (SCOR®) Model Overview version 10. 0.
SCOR Metrics Supply Chain Council. Supply Chain Operations Reference (SCOR®) Model Overview version 10. 0.
American Production and Inventory Control Society (APICS). 2015. SCOR 101—APICS for Business
Cash Conversion Cycle Account Payable Purchasing Inventory Manufacturing Sales & Distribution COGS atau Cost of Sales Account Receivable Vollman. 2005. Manufacturing Planning & Control Systems for Supply Chain, New York: Mc. Graw Hill Cash Conversion Cycle (Cash to Cash Cycle time)
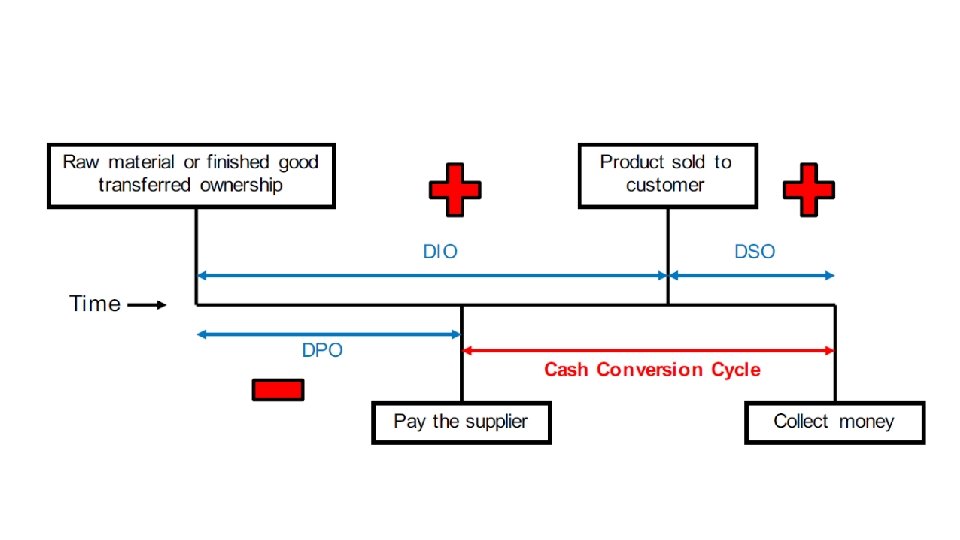
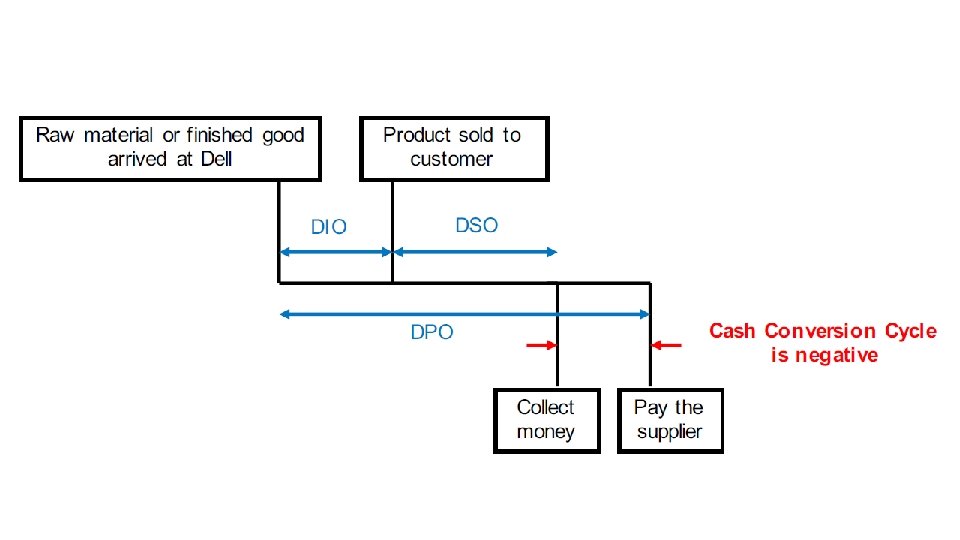
Cash Conversion Cycle (2) The cash conversion cycle (CCC) is a metric that expresses the length of time (in days) that it takes for a company to convert its investments in inventory and other resources into cash flows from sales. Also called the Net Operating Cycle or simply Cash Cycle, CCC attempts to measure the duration of time for which each net input dollar (cash) is tied up in the production and sales process before it gets converted into cash received through sales made to customers. This metric takes into account the duration of time it requires to sell its inventory, the duration of time required to collect receivables, and the duration of time the company is allowed to pay its bills without incurring any penalties. CCC = DIO + DSO - DPO • Days Inventory Outstanding = Average Inventory/COGS per day • Days Sales Outstanding = Average AR/Revenue per day • Days Payable Outstanding =Average AP/COGS per day AR= Account Receivable (Piutang Usaha - Jangka Pendek) AP = Account Payable (Hutang Usaha - Jangka Pendek)
Cash Conversion Cycle (3) • Days Inventory Outstanding (DIO), also known as Days Sales of Inventory (DSI), is an efficiency metric used to measure the average number of days a company holds inventory before selling it. • Days sales outstanding (DSO) is a measure of the average number of days that it takes a company to collect payment after a sale has been made. • Days payable outstanding (DPO) indicates the average time (in days) that a company takes to pay its bills and invoices to its trade creditors, which include suppliers, vendors or other companies.
TESLA 2013 2, 013 1, 451 TESLA 2014 3, 198 2, 085 340 49 304 954 227 778 Average Inventory Average AR Average AP - (340+954)÷ 2 = 647 (49+227)÷ 2 = 138 (304+778)÷ 2 = 541 DIO DSO DPO CCC - 647 ÷ 2, 085 *365 days = 113. 3 days 138 ÷ 3, 198 * 365 days = 15. 8 days 541 ÷ 2, 085 * 365 fays = 94. 7 days 113. 3 + 15. 8 - 94. 7 = 34. 3 days Revenue COGS Inventories Receivable Payables Data Source: S&P Capital IQ
2, 013 1, 451 3, 198 2, 085 155, 427 130, 909 155, 929 131, 657 TOYOTA MOTOR 2013 249, 484 189, 845 340 49 304 954 227 778 14, 039 22, 813 23, 621 13, 642 25, 606 22, 529 18, 399 77, 844 21, 492 TESLA 2013 TESLA 2014 GM 2013 Revenue COGS Inventories Receivable Payables Average Inventory Average AR Average AP DIO DSO DPO CCC GM 2014 TOYOTA MOTOR 2014 227, 030 170, 329 HONDA MOTOR 2013 114, 998 77, 508 HONDA MOTOR 2014 111, 105 77, 007 17, 819 73, 352 20, 095 12, 652 25, 470 10, 679 12, 490 24, 338 8, 333 647 ? ? ? 138 541 ? ? 113. 3 15. 8 94. 7 34. 3 ? ? ? ?
2, 013 1, 451 3, 198 2, 085 155, 427 130, 909 155, 929 131, 657 TOYOTA MOTOR 2013 249, 484 189, 845 340 49 304 954 227 778 14, 039 22, 813 23, 621 13, 642 25, 606 22, 529 18, 399 77, 844 21, 492 TESLA 2013 TESLA 2014 GM 2013 Revenue COGS Inventories Receivable Payables Average Inventory Average AR Average AP DIO DSO DPO CCC GM 2014 TOYOTA MOTOR 2014 227, 030 170, 329 HONDA MOTOR 2013 114, 998 77, 508 HONDA MOTOR 2014 111, 105 77, 007 17, 819 73, 352 20, 095 12, 652 25, 470 10, 679 12, 490 24, 338 8, 333 647 13840. 5 18109 12571 138 541 24209. 5 23075 75598 20793. 5 24904 9506 113. 3 15. 8 94. 7 34. 3 38. 4 56. 7 64. 0 31. 1 38. 8 121. 5 44. 6 115. 8 59. 6 81. 8 45. 1 96. 3
Additional Info Purchasing = 90% of COGS Average Inventory = $33. 6 Average A/R = $162. 5 Average A/P = $135 DIO = $33. 6 ÷ $910. 4 *365 =13. 471 day DSO = $162. 5 ÷ 1680 *365 = 35. 305 day DPO = $135 ÷ ($910. 4*90%) *365 = 60. 13 day CCC = -11. 36 days