
Supply Chain Management Lecture 9 Outline Today Chapter

- Slides: 36
Supply Chain Management Lecture 9
Outline • Today – Chapter 6 – Skipping • 3 e: Section 6. 5 p. 164 -175, 4 e: Section 6. 6 p. 160 -171 • AM Tires: Evaluation of Supply Chain Design Decisions Under Uncertainty • Thursday – Finish Chapter 6 start with Chapter 7 • Homework 2 – Due Friday February 12 before 5: 00 pm • If you email “save as”. doc and. xls format
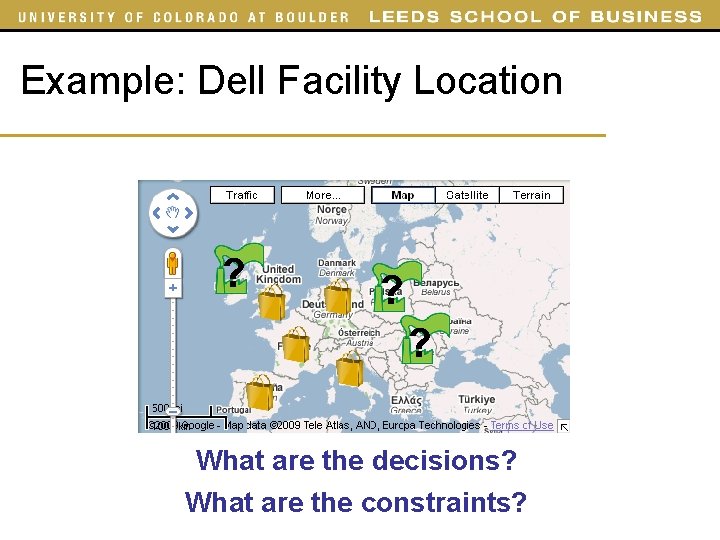
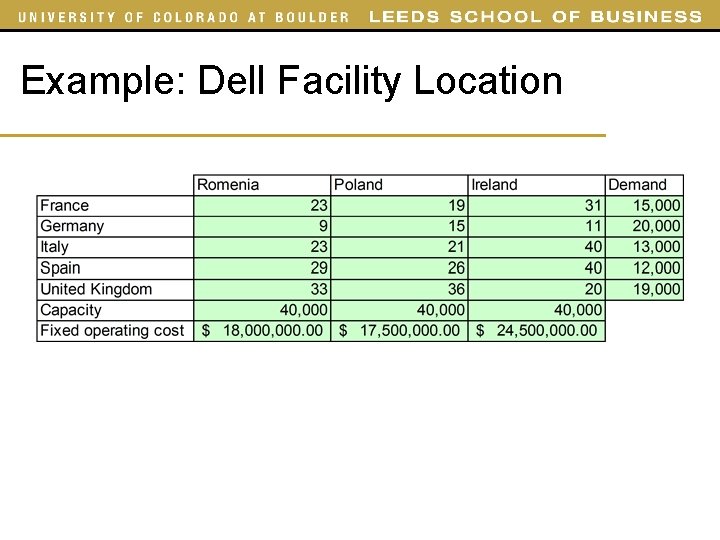
Example: Dell Facility Location ? ? ? What are the decisions? What are the constraints?
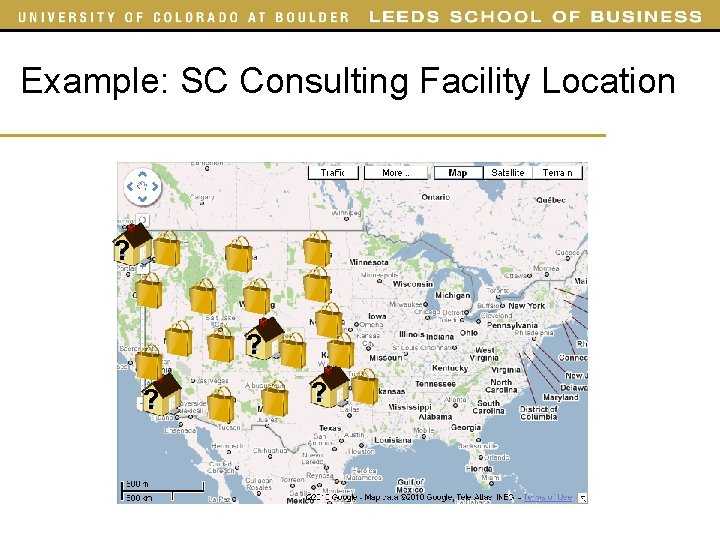
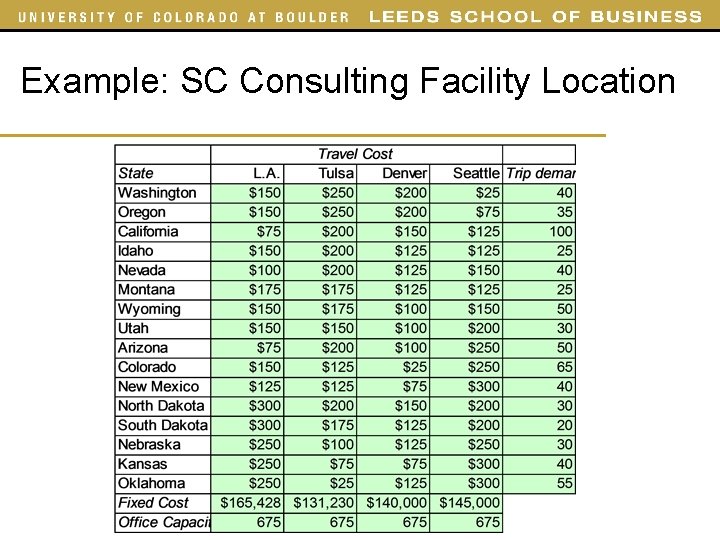
Example: SC Consulting Facility Location ? ? ? ?
Making Network Design Decisions in Practice • Computer models versus sound judgment – Most facility location decisions are based on tariffs and tax incentives
Example: Dell Facility Location
Example: SC Consulting Facility Location
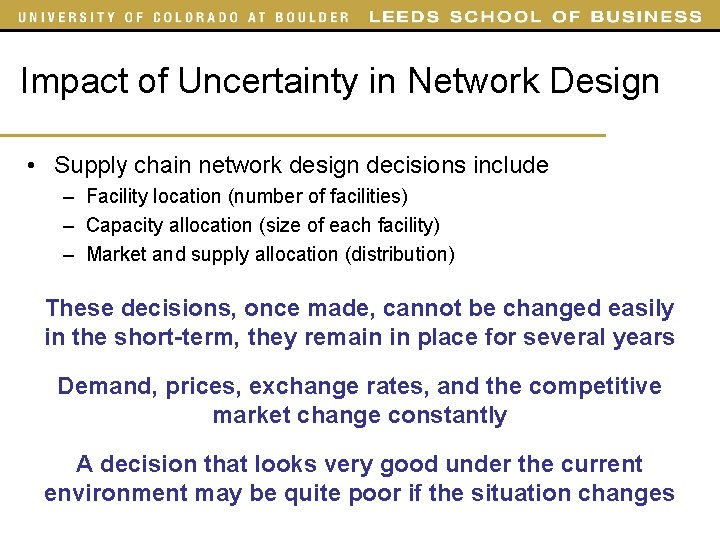
Impact of Uncertainty in Network Design • Supply chain network design decisions include – Facility location (number of facilities) – Capacity allocation (size of each facility) – Market and supply allocation (distribution) These decisions, once made, cannot be changed easily in the short-term, they remain in place for several years Demand, prices, exchange rates, and the competitive market change constantly A decision that looks very good under the current environment may be quite poor if the situation changes
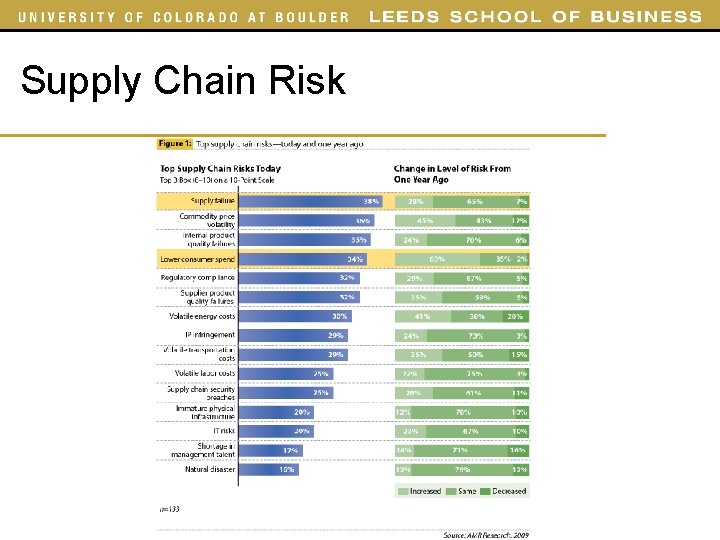
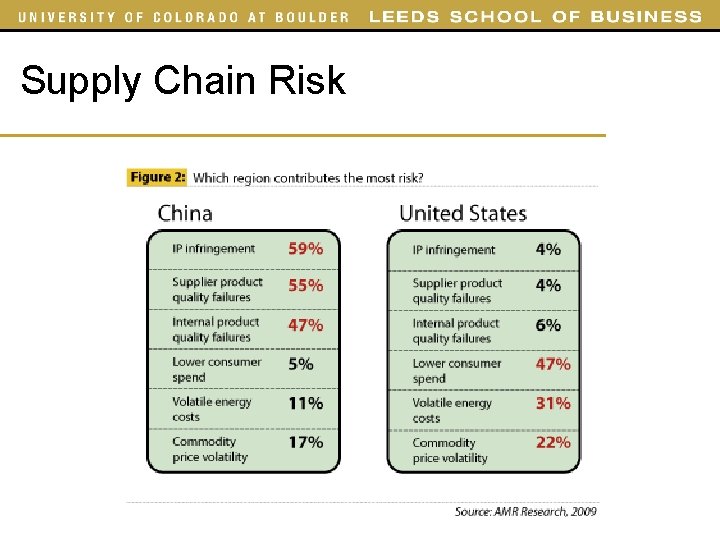
Supply Chain Risk Supply failure Commodity price volatility Internal product failures Lower consumer spending Natural disaster
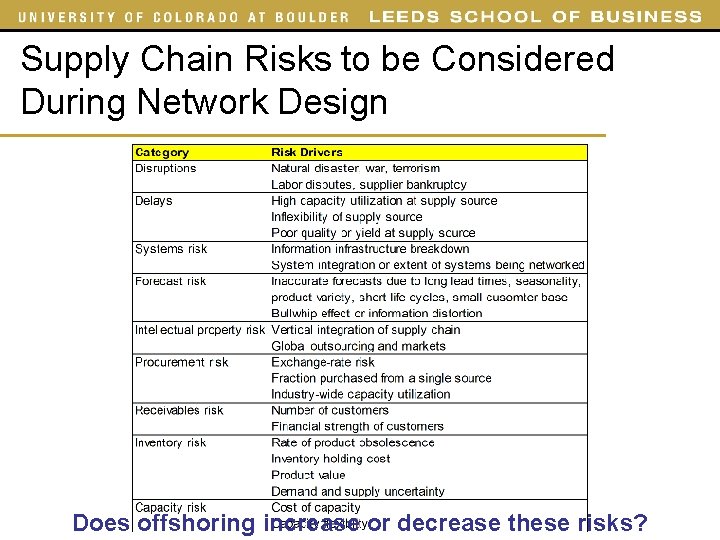
Supply Chain Risks to be Considered During Network Design Does offshoring increase or decrease these risks?
Supply Chain Risk
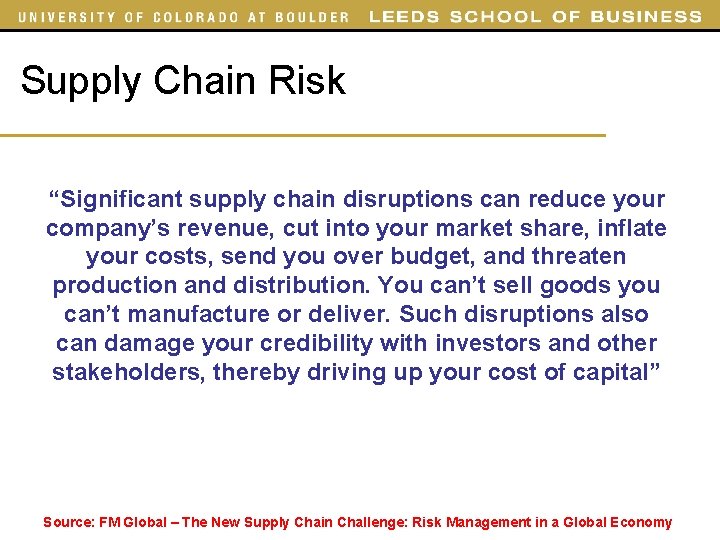
Supply Chain Risk “Significant supply chain disruptions can reduce your company’s revenue, cut into your market share, inflate your costs, send you over budget, and threaten production and distribution. You can’t sell goods you can’t manufacture or deliver. Such disruptions also can damage your credibility with investors and other stakeholders, thereby driving up your cost of capital” Source: FM Global – The New Supply Chain Challenge: Risk Management in a Global Economy
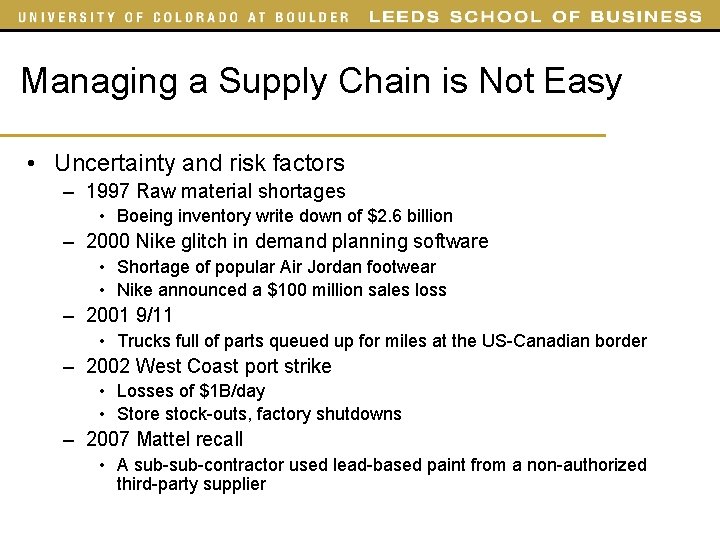
Managing a Supply Chain is Not Easy • Uncertainty and risk factors – 1997 Raw material shortages • Boeing inventory write down of $2. 6 billion – 2000 Nike glitch in demand planning software • Shortage of popular Air Jordan footwear • Nike announced a $100 million sales loss – 2001 9/11 • Trucks full of parts queued up for miles at the US-Canadian border – 2002 West Coast port strike • Losses of $1 B/day • Store stock-outs, factory shutdowns – 2007 Mattel recall • A sub-contractor used lead-based paint from a non-authorized third-party supplier
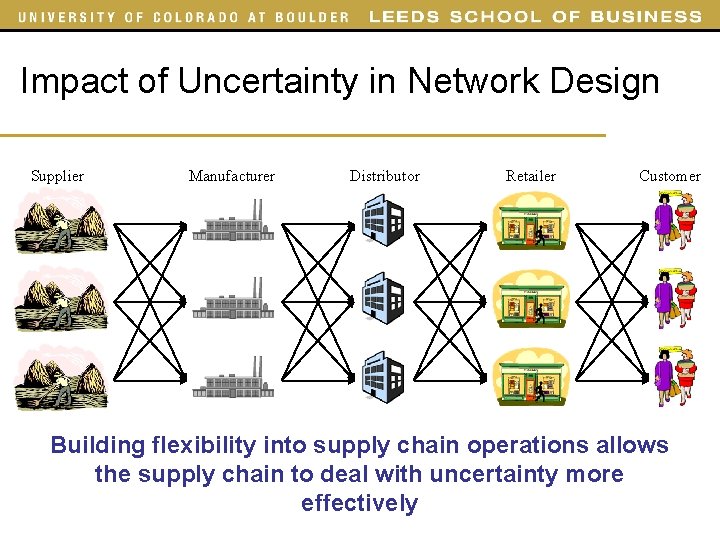
Impact of Uncertainty in Network Design Supplier Manufacturer Distributor Retailer Customer Building flexibility into supply chain operations allows the supply chain to deal with uncertainty more effectively
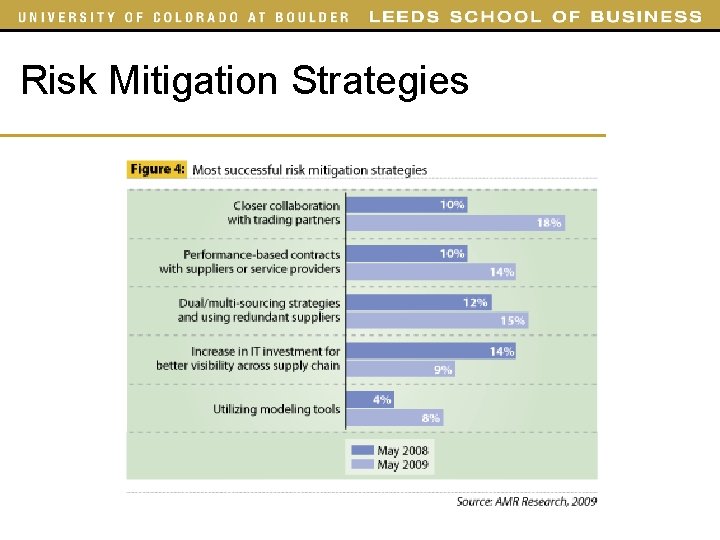
Risk Mitigation Strategies
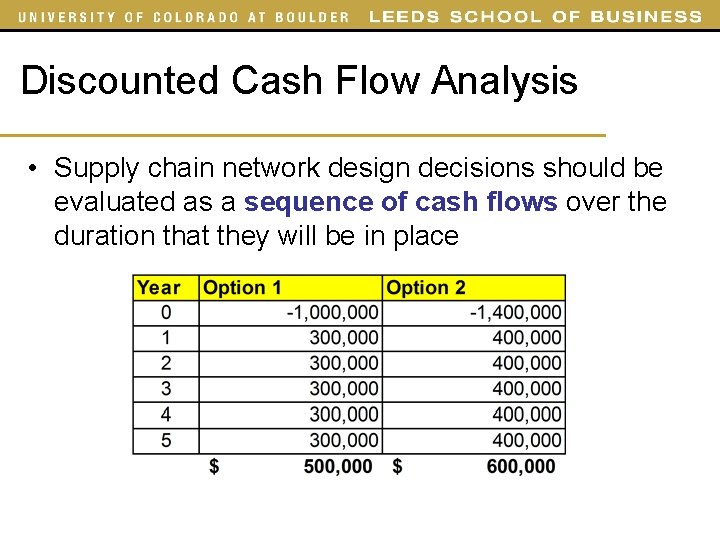
Discounted Cash Flow Analysis • Supply chain network design decisions should be evaluated as a sequence of cash flows over the duration that they will be in place
Discounted Cash Flow Analysis • Supply chain network design decisions should be evaluated as a sequence of cash flows over the duration that they will be in place – Discounted cash flow (DCF) analysis • Evaluates the net present value (NPV) of any stream of future cash flows • Allows for comparing two or more cash flow streams in terms of their present financial value
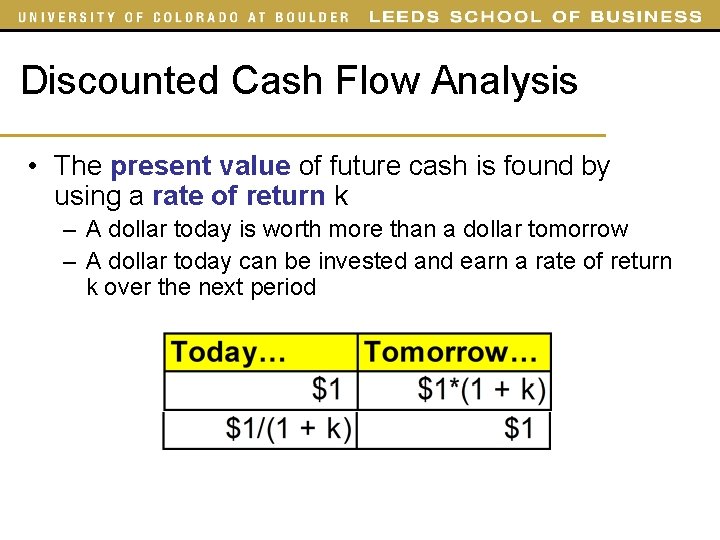
Discounted Cash Flow Analysis • The present value of future cash is found by using a rate of return k – A dollar today is worth more than a dollar tomorrow – A dollar today can be invested and earn a rate of return k over the next period
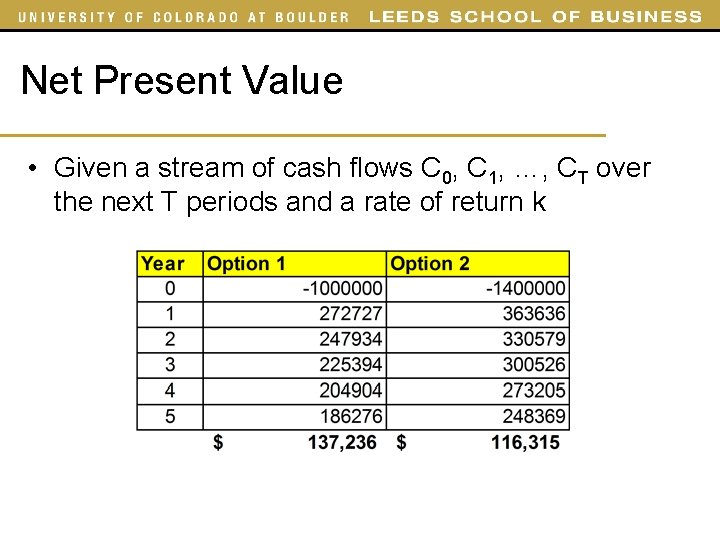
Net Present Value • Given a stream of cash flows C 0, C 1, …, CT over the next T periods and a rate of return k
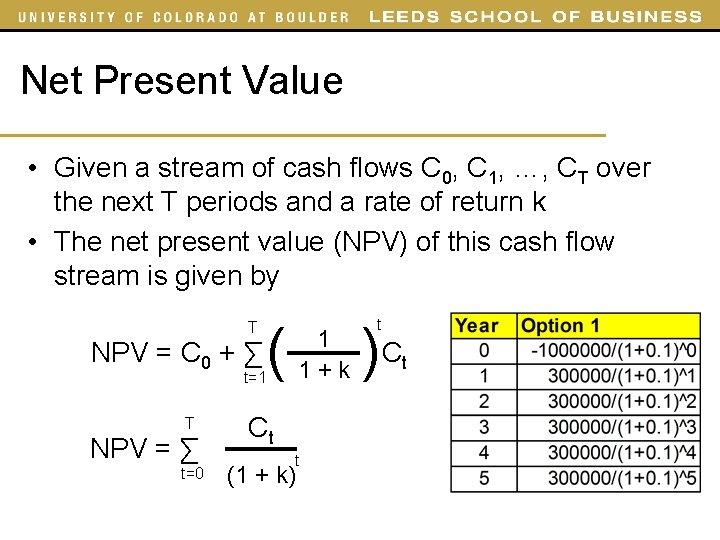
Net Present Value • Given a stream of cash flows C 0, C 1, …, CT over the next T periods and a rate of return k • The net present value (NPV) of this cash flow stream is given by T NPV = C 0 + ∑ ( 1 1+k t=1 T NPV = ∑ t=0 Ct t (1 + k) t )C t
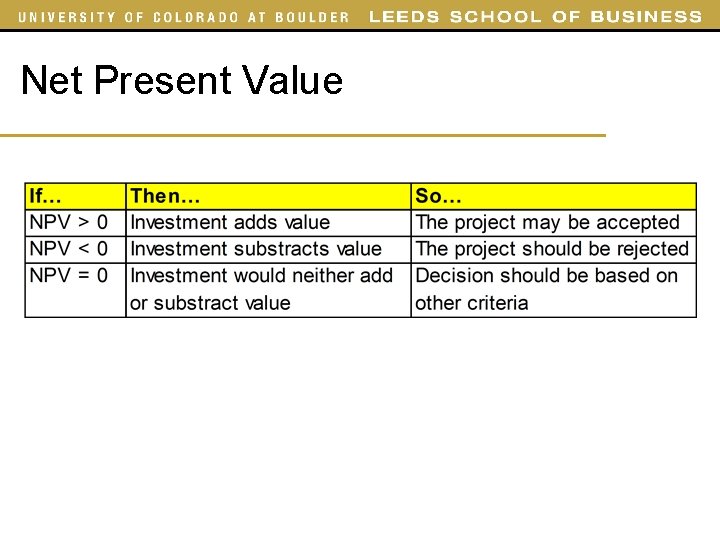
Net Present Value
Example: Net Present Value • Fulfillment by Amazon – Warehousing and other logistics services – Amazon will pick, pack, and ship your product to your customer • Target. com – Estimated demand 100, 000 units for online orders – Required space 1, 000 sq. ft. for every 1, 000 units – Revenue $1. 22 for each unit of demand
Example: Net Present Value • Target. com can choose between two options – Spot market rate expected at $1. 20 per sq. ft. per year for each of the next 3 years – 3 year lease contract at $1 per sq. ft.
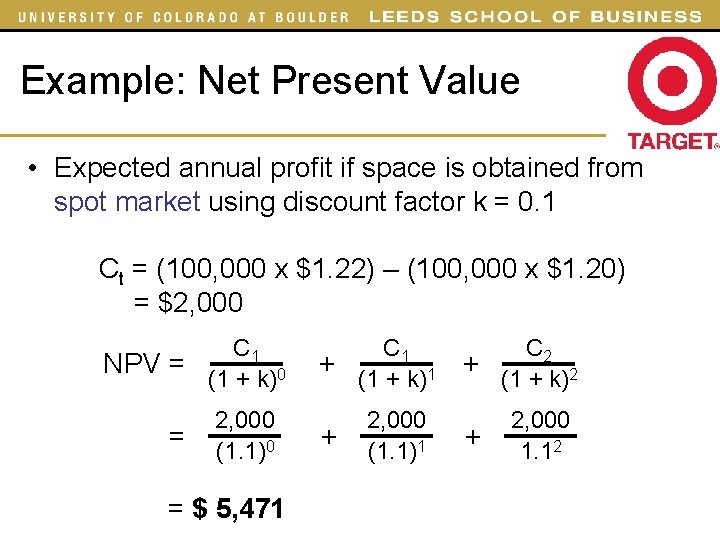
Example: Net Present Value • Expected annual profit if space is obtained from spot market using discount factor k = 0. 1 Ct = (100, 000 x $1. 22) – (100, 000 x $1. 20) = $2, 000 C 1 NPV = (1 + k)0 = 2, 000 (1. 1)0 = $ 5, 471 C 1 + (1 + k)1 + 2, 000 (1. 1)1 C 2 + (1 + k)2 + 2, 000 1. 12
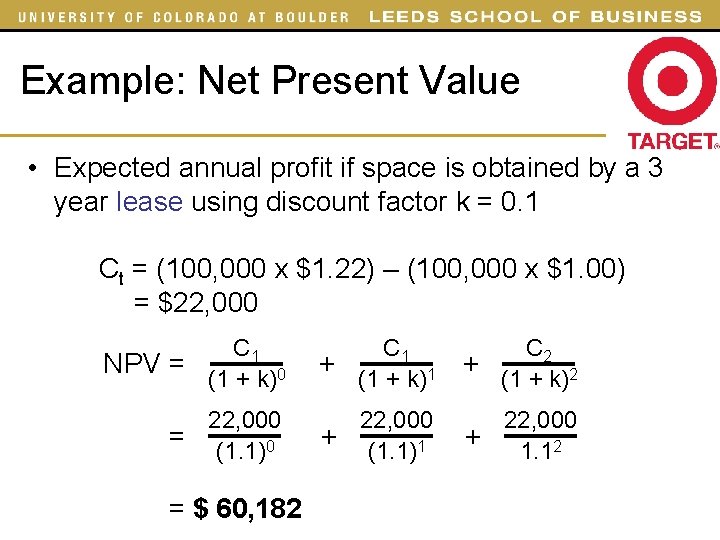
Example: Net Present Value • Expected annual profit if space is obtained by a 3 year lease using discount factor k = 0. 1 Ct = (100, 000 x $1. 22) – (100, 000 x $1. 00) = $22, 000 C 1 NPV = (1 + k)0 C 1 + (1 + k)1 C 2 + (1 + k)2 22, 000 = (1. 1)0 22, 000 + (1. 1)1 22, 000 + 1. 12 = $ 60, 182
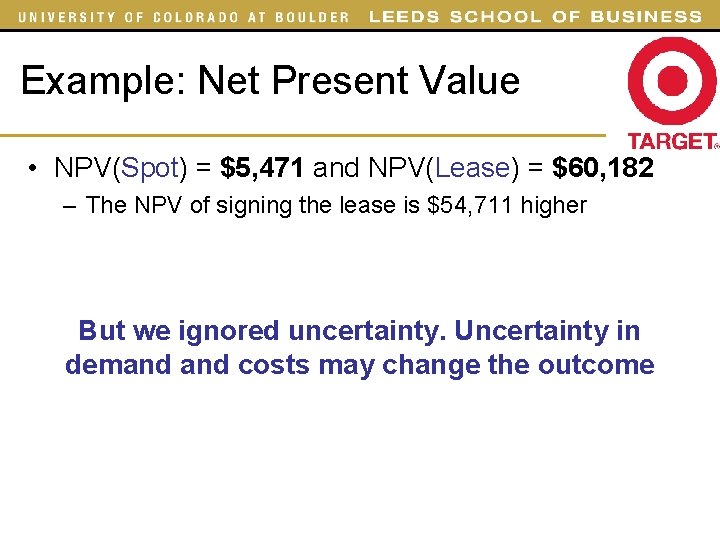
Example: Net Present Value • NPV(Spot) = $5, 471 and NPV(Lease) = $60, 182 – The NPV of signing the lease is $54, 711 higher But we ignored uncertainty. Uncertainty in demand costs may change the outcome
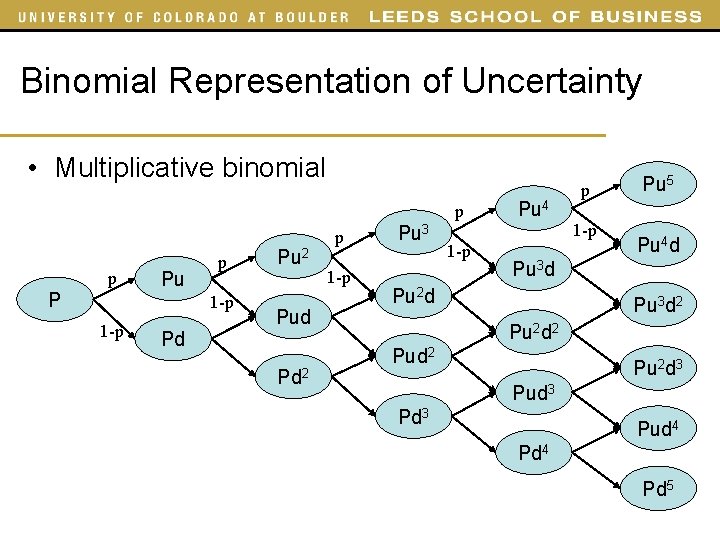
Binomial Representation of Uncertainty • Multiplicative binomial p p P Pu p 1 -p Pd Pu 2 Pud Pd 2 p 1 -p Pu 3 1 -p Pu 4 p 1 -p Pu 5 Pu 4 d Pu 3 d Pu 2 d Pu 3 d 2 Pu 2 d 3 Pud 4 Pd 5
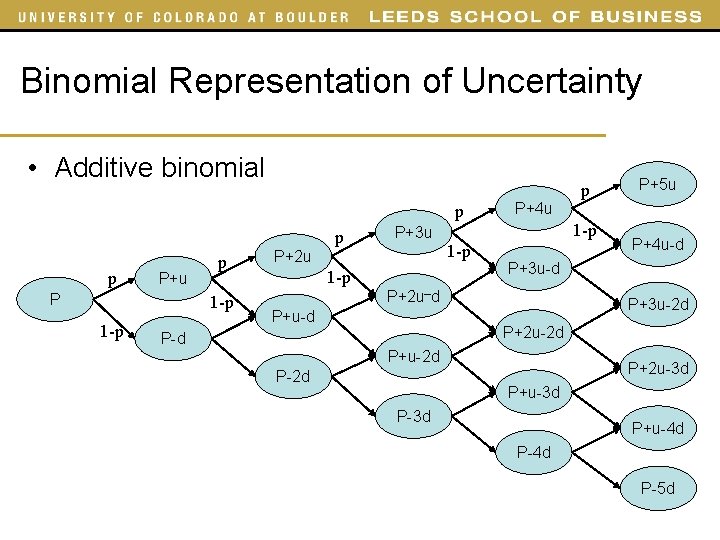
Binomial Representation of Uncertainty • Additive binomial p p p P+u P p 1 -p P+3 u P+2 u 1 -p P+4 u 1 -p P-d P+5 u P+4 u-d P+3 u-d P+2 u–d P+u-d p P+3 u-2 d P+2 u-2 d P+u-2 d P+2 u-3 d P+u-3 d P+u-4 d P-5 d
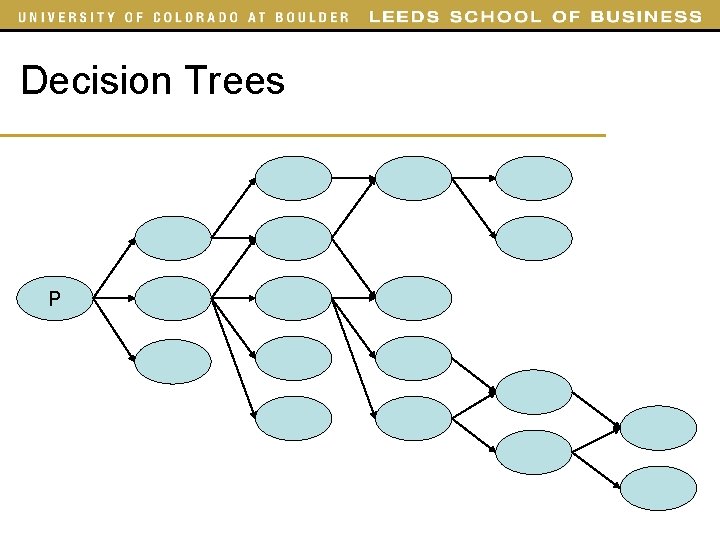
Decision Trees P
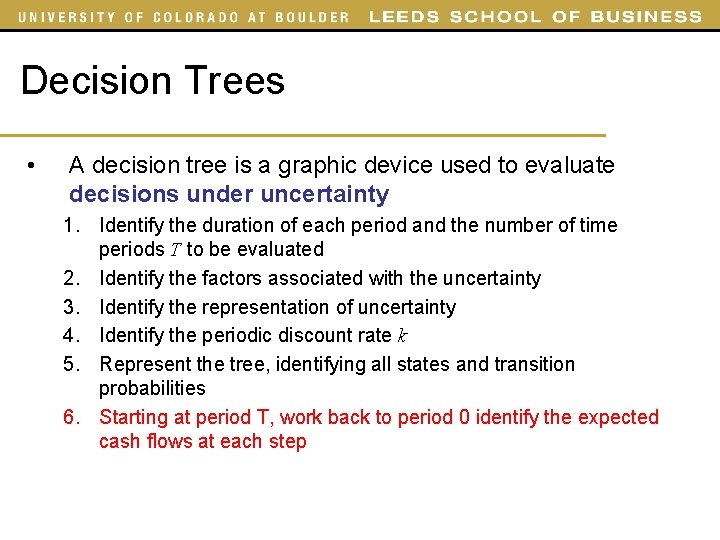
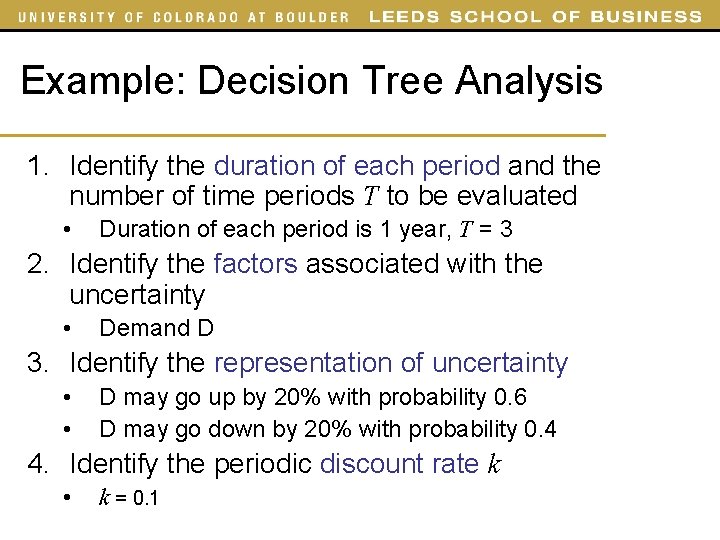
Decision Trees • A decision tree is a graphic device used to evaluate decisions under uncertainty 1. Identify the duration of each period and the number of time periods T to be evaluated 2. Identify the factors associated with the uncertainty 3. Identify the representation of uncertainty 4. Identify the periodic discount rate k 5. Represent the tree, identifying all states and transition probabilities 6. Starting at period T, work back to period 0 identify the expected cash flows at each step
Example: Decision Tree Analysis • What product to make for the next three years using a discount factor k = 0. 1? – Old product with certain demand ($90 profit/unit) – New product with uncertain demand ($85 profit/unit)
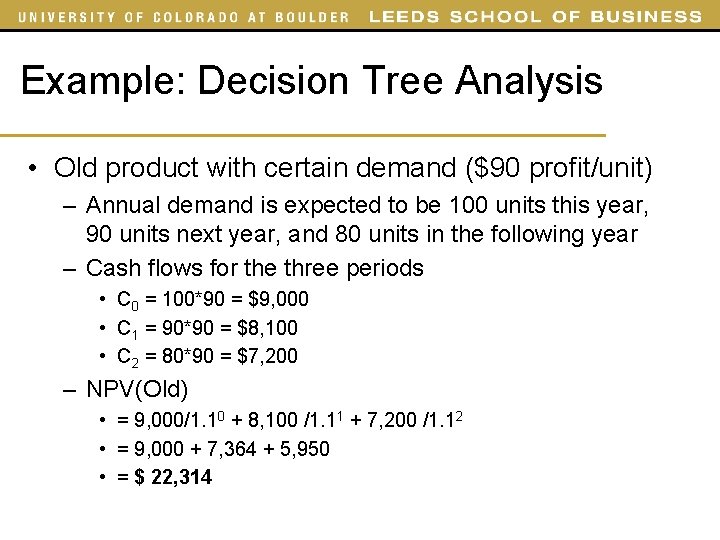
Example: Decision Tree Analysis • Old product with certain demand ($90 profit/unit) – Annual demand is expected to be 100 units this year, 90 units next year, and 80 units in the following year – Cash flows for the three periods • C 0 = 100*90 = $9, 000 • C 1 = 90*90 = $8, 100 • C 2 = 80*90 = $7, 200 – NPV(Old) • = 9, 000/1. 10 + 8, 100 /1. 11 + 7, 200 /1. 12 • = 9, 000 + 7, 364 + 5, 950 • = $ 22, 314
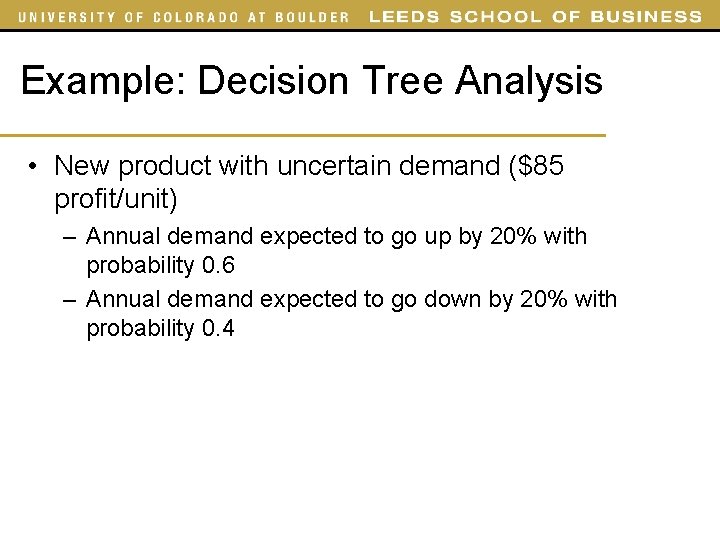
Example: Decision Tree Analysis • New product with uncertain demand ($85 profit/unit) – Annual demand expected to go up by 20% with probability 0. 6 – Annual demand expected to go down by 20% with probability 0. 4
Example: Decision Tree Analysis 1. Identify the duration of each period and the number of time periods T to be evaluated • Duration of each period is 1 year, T = 3 2. Identify the factors associated with the uncertainty • Demand D 3. Identify the representation of uncertainty • • D may go up by 20% with probability 0. 6 D may go down by 20% with probability 0. 4 4. Identify the periodic discount rate k • k = 0. 1
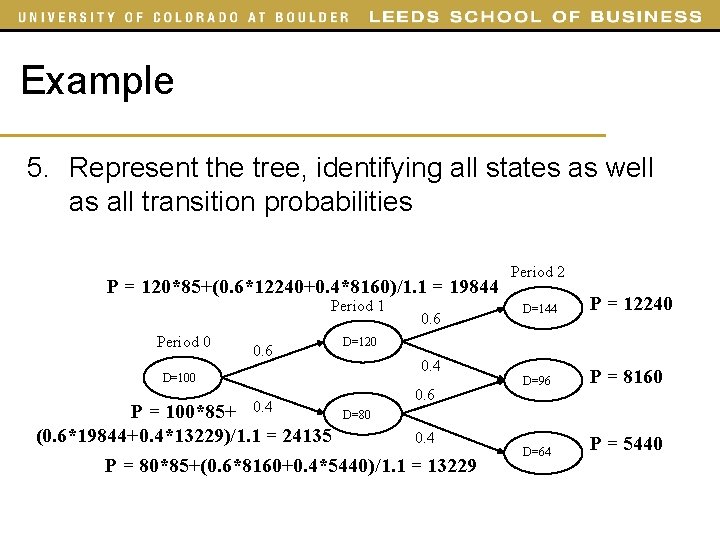
Example 5. Represent the tree, identifying all states as well as all transition probabilities P = 120*85+(0. 6*12240+0. 4*8160)/1. 1 = 19844 Period 1 Period 0 0. 6 D=100 0. 4 0. 6 Period 2 D=144 P = 12240 D=96 P = 8160 D=64 P = 5440 D=120 0. 4 0. 6 P = 100*85+ D=80 (0. 6*19844+0. 4*13229)/1. 1 = 24135 0. 4 P = 80*85+(0. 6*8160+0. 4*5440)/1. 1 = 13229
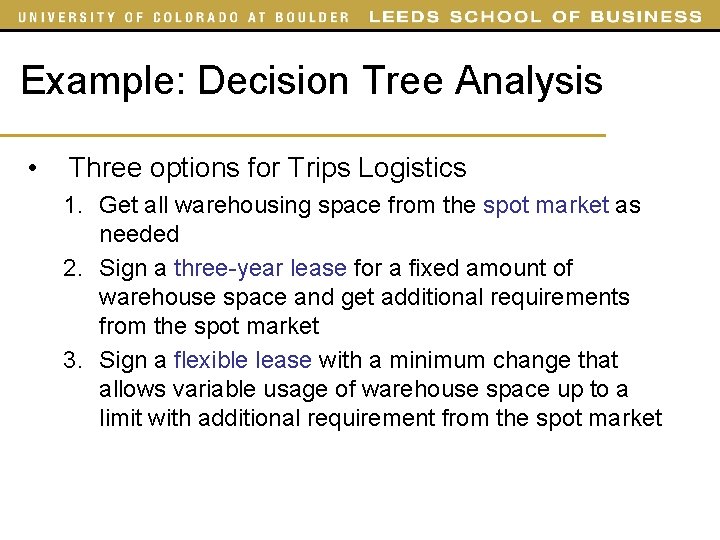
Example: Decision Tree Analysis • Three options for Trips Logistics 1. Get all warehousing space from the spot market as needed 2. Sign a three-year lease for a fixed amount of warehouse space and get additional requirements from the spot market 3. Sign a flexible lease with a minimum change that allows variable usage of warehouse space up to a limit with additional requirement from the spot market