
Supply Chain Logistics Systems GLBL 3250 Week 10
Supply Chain & Logistics Systems GLBL 3250 Week 10 SCOR, Lean, and Six Sigma Top 25 Supply Chains: Trends & Strategies
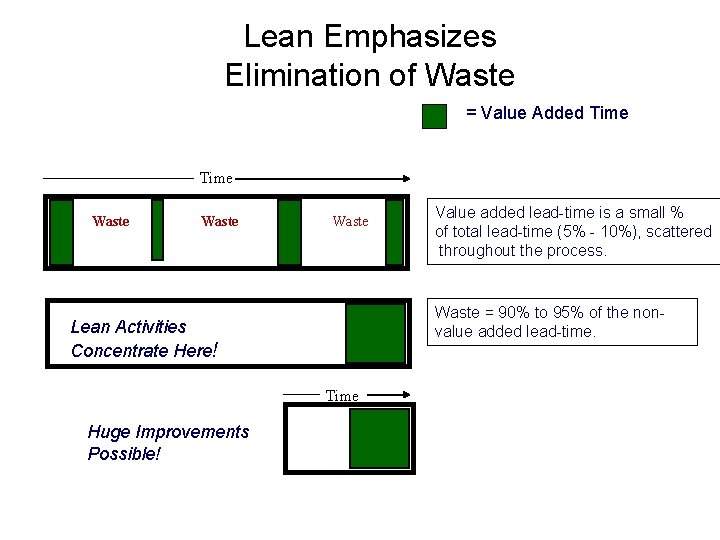
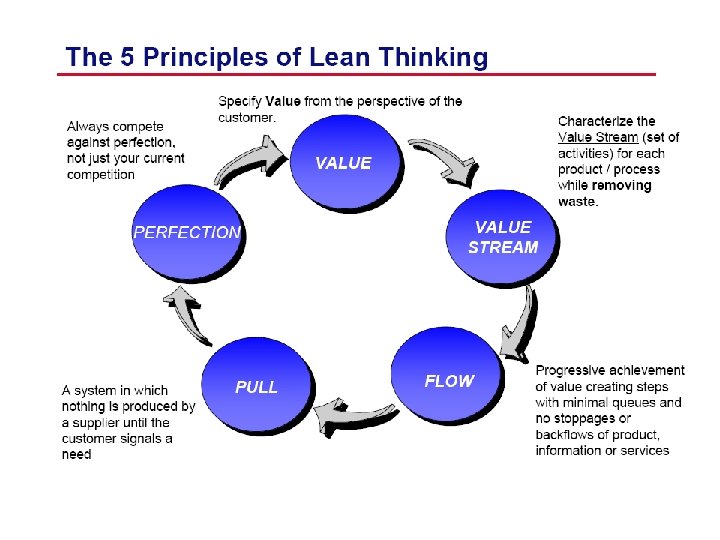
Lean Emphasizes Elimination of Waste = Value Added Time Waste = 90% to 95% of the nonvalue added lead-time. Lean Activities Concentrate Here! Time Huge Improvements Possible! Value added lead-time is a small % of total lead-time (5% - 10%), scattered throughout the process.
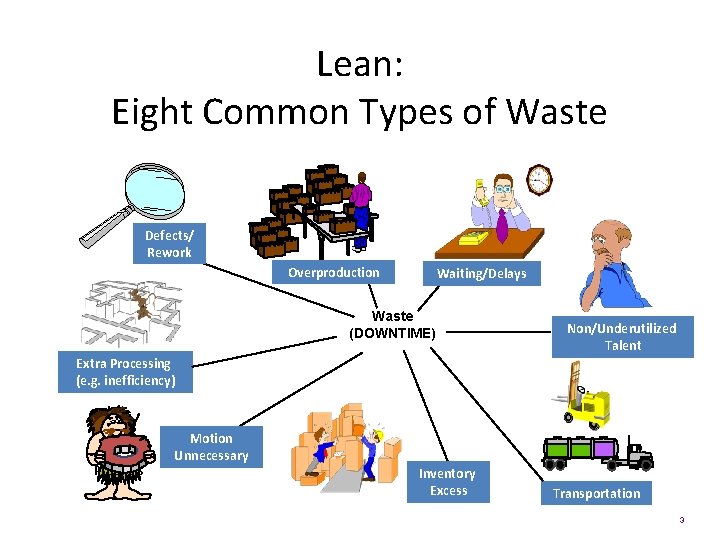
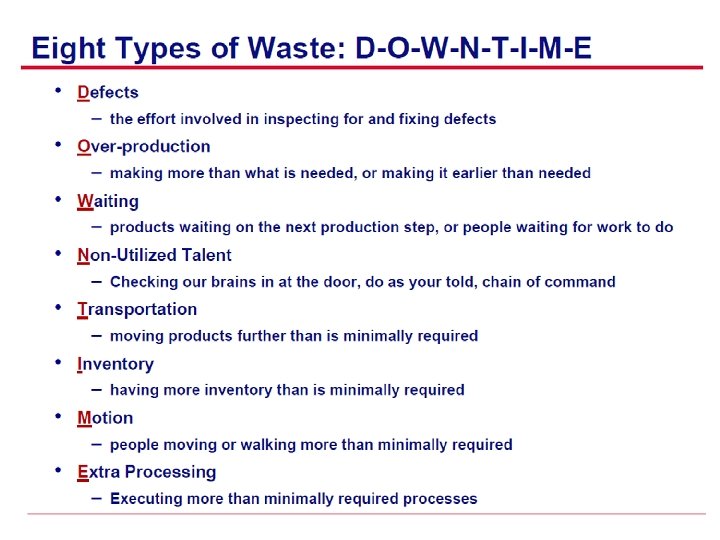
Lean: Eight Common Types of Waste Defects/ Rework Overproduction Waiting/Delays Waste (DOWNTIME) Non/Underutilized Talent Extra Processing (e. g. inefficiency) Defective Products Motion Unnecessary Inventory Excess Transportation 3

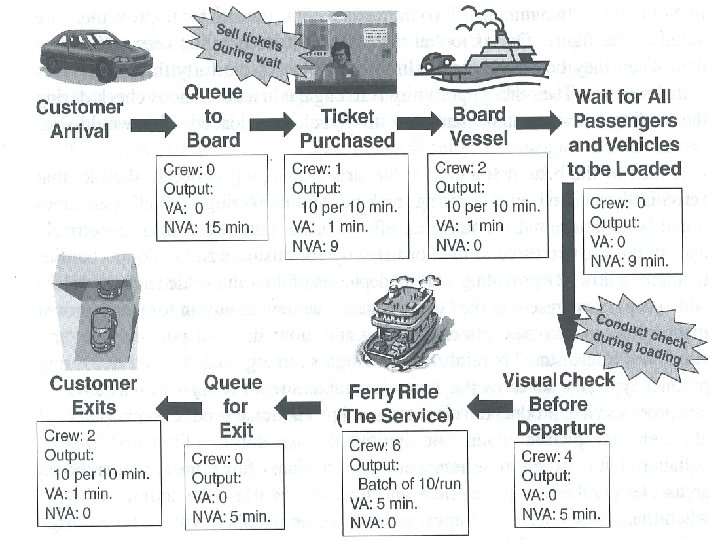
Lean Thinking Sees 3 Types of Activities Value-Added Activities · Change the form, fit or function of the product/service · The customer is willing to pay more if we did more of it Non Value-Added Required - Needed Activities · Necessary but the customer will not pay you to do · Cannot be eliminated (due to non-robustness of process) based on current state of technology · Required (regulatory, customer mandate, legal) Non Value – Added Activities · Consume resources but create no value in the eyes of the customer · The customer is not willing to pay · Pure waste
Assignment 10. 1 Saturn 8
Saturn Vehicle Delivery Process Return to the Saturn Corporation Case; specifically the Delivery Process pages 4 -8 Starting with Event 38, develop flowcharts of the delivery process for truck and rail. Develop a second set of flowcharts that streamlines the delivery processes, removes redundant, unimportant, non-value added activities, and addresses concerns related to the current process. Use rectangles and arrows in Power. Point to show each step and the flow of the process. Indicate which steps are green (value added) activities; or red (non-value added); or yellow (non-value added but required. ) Keep in mind the definitions of value-add and the 8 types of wastes
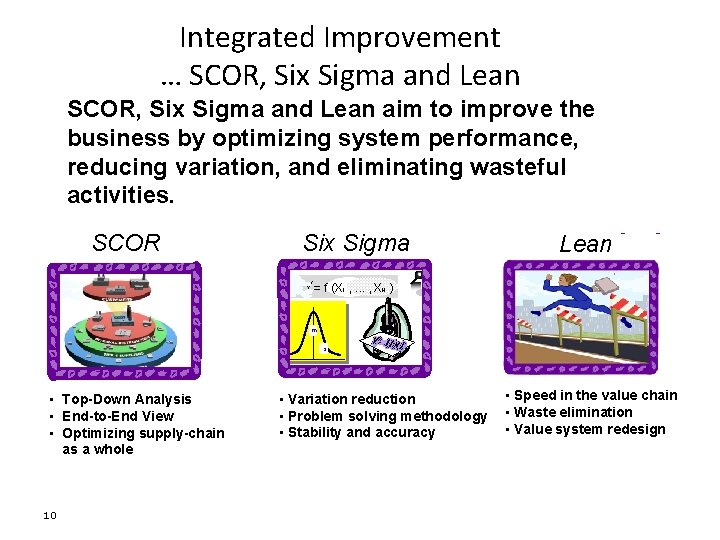
Integrated Improvement … SCOR, Six Sigma and Lean aim to improve the business by optimizing system performance, reducing variation, and eliminating wasteful activities. SCOR Six Sigma Y= f (X 1 Lean , . . . , XN ) m s • Top-Down Analysis • End-to-End View • Optimizing supply-chain as a whole 10 • Variation reduction • Problem solving methodology • Stability and accuracy • Speed in the value chain • Waste elimination • Value system redesign
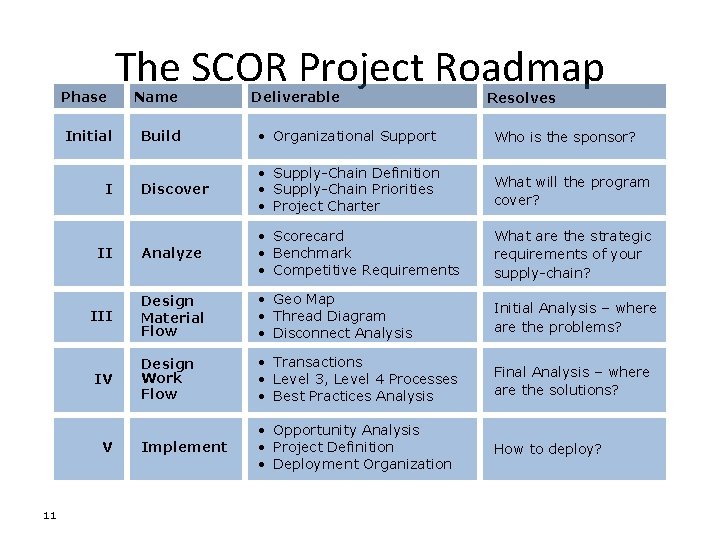
Phase Name Deliverable Resolves Build • Organizational Support Who is the sponsor? Discover • Supply-Chain Definition • Supply-Chain Priorities • Project Charter What will the program cover? II Analyze • Scorecard • Benchmark • Competitive Requirements What are the strategic requirements of your supply-chain? III Design Material Flow • Geo Map • Thread Diagram • Disconnect Analysis Initial Analysis – where are the problems? Design Work Flow • Transactions • Level 3, Level 4 Processes • Best Practices Analysis Final Analysis – where are the solutions? Implement • Opportunity Analysis • Project Definition • Deployment Organization How to deploy? Initial I IV V 11 The SCOR Project Roadmap
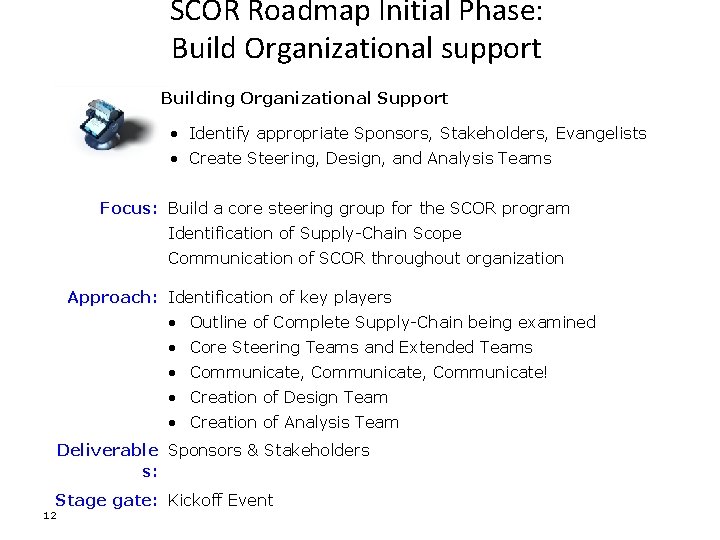
SCOR Roadmap Initial Phase: Build Organizational support Building Organizational Support • Identify appropriate Sponsors, Stakeholders, Evangelists • Create Steering, Design, and Analysis Teams Focus: Build a core steering group for the SCOR program Identification of Supply-Chain Scope Communication of SCOR throughout organization Approach: Identification of key players • Outline of Complete Supply-Chain being examined • Core Steering Teams and Extended Teams • Communicate, Communicate! • Creation of Design Team • Creation of Analysis Team Deliverable Sponsors & Stakeholders s: Stage gate: Kickoff Event 12
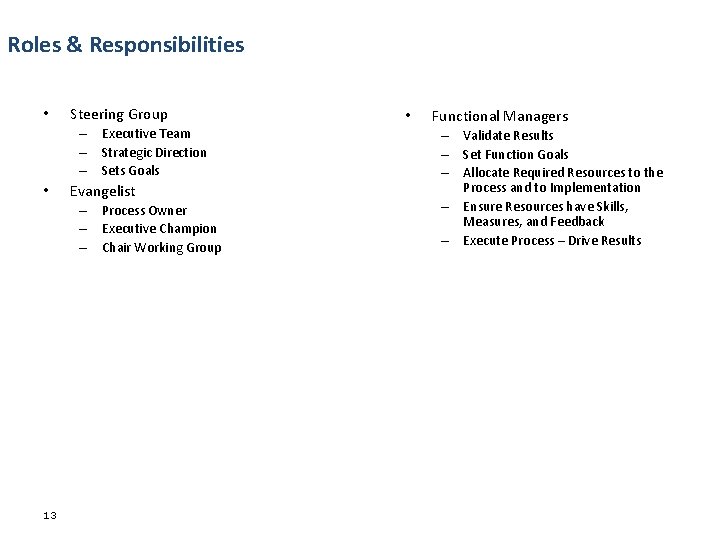
Roles & Responsibilities • Steering Group – Executive Team – Strategic Direction – Sets Goals • Evangelist – Process Owner – Executive Champion – Chair Working Group 13 • Functional Managers – Validate Results – Set Function Goals – Allocate Required Resources to the Process and to Implementation – Ensure Resources have Skills, Measures, and Feedback – Execute Process – Drive Results
SCOR Roadmap Phase I: Discover the Opportunity • Supply-Chain Definition • Supply-Chain Priorities • Project Charter Focus: Supply-Chain: generate a clear definition Priorities: Align to Business Strategy Resources: Identify and secure process owners/actors Approach Sponsor and stakeholders interviews: : • Work towards a problem statement based on metrics – current v. desired performance • Capture customer-identified solutions i. e. a technology or practice Deliverab Project Charter les: 14 Stage Project Charter acceptance gate: VOC – Voice of the Customer
SCOR Roadmap Phase II: Analyze Basis for Competition • Scorecard • Benchmark • Competitive Requirements Focus: Scorecard: Appropriate Level Metrics Benchmark: Select and Use Industry Source Requirements: Prioritization and Ratification Approach: Initial Data and Transaction Capture Financial Validation Early “Defect” analysis of performance gaps Deliverabl Defined Metrics for program focus es: VOC – Voice of the Customer Root Cause Analysis Pareto Charts Time Value Maps 15 Stage Supply-Chain Selected and Metrics Described gate: Waste Analysis
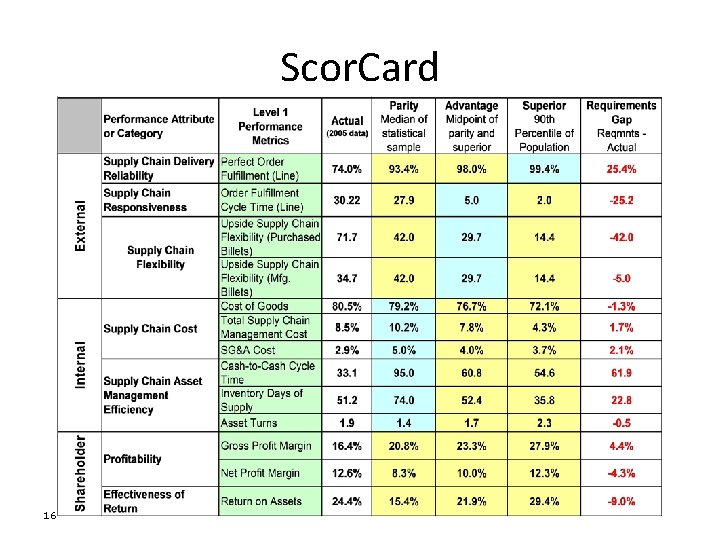
Scor. Card 16
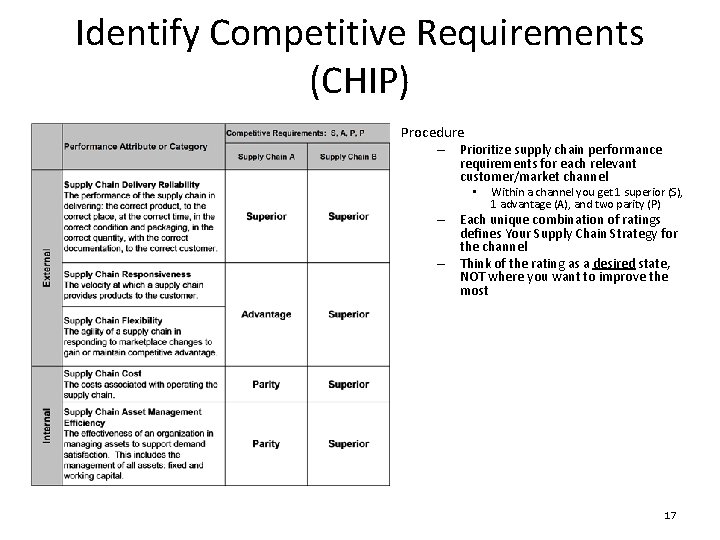
Identify Competitive Requirements (CHIP) Procedure – Prioritize supply chain performance requirements for each relevant customer/market channel • Within a channel you get 1 superior (S), 1 advantage (A), and two parity (P) – Each unique combination of ratings defines Your Supply Chain Strategy for the channel – Think of the rating as a desired state, NOT where you want to improve the most 17
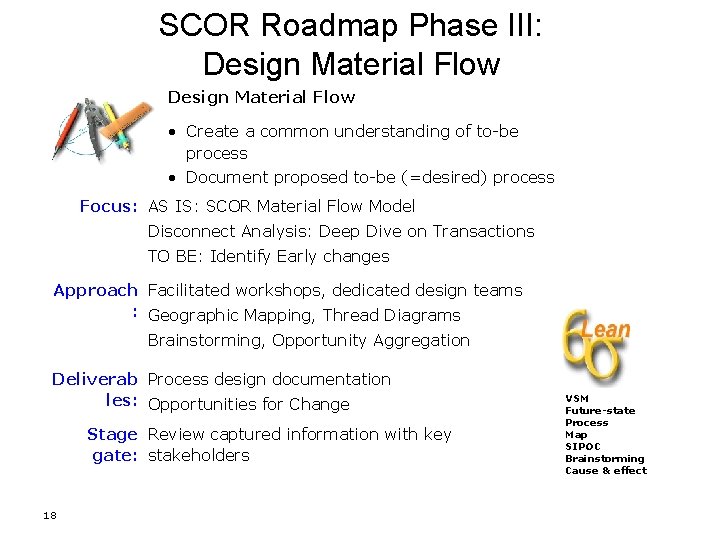
SCOR Roadmap Phase III: Design Material Flow • Create a common understanding of to-be process • Document proposed to-be (=desired) process Focus: AS IS: SCOR Material Flow Model Disconnect Analysis: Deep Dive on Transactions TO BE: Identify Early changes Approach Facilitated workshops, dedicated design teams : Geographic Mapping, Thread Diagrams Brainstorming, Opportunity Aggregation Deliverab Process design documentation les: Opportunities for Change Stage Review captured information with key gate: stakeholders 18 VSM Future-state Process Map SIPOC Brainstorming Cause & effect
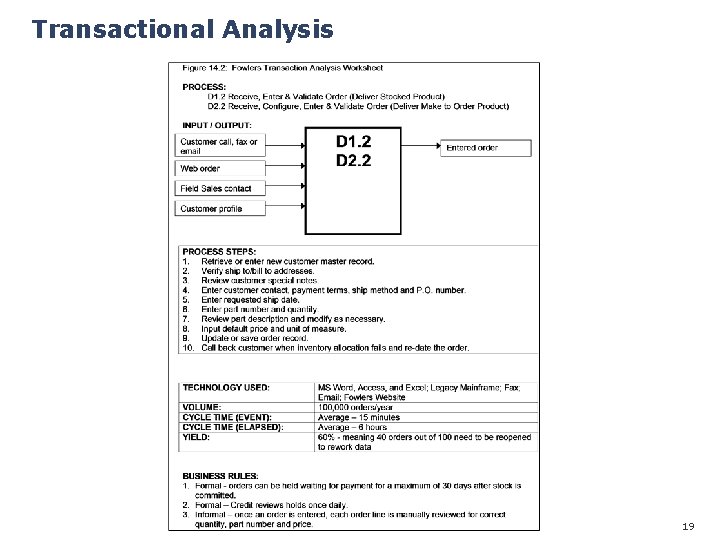
Transactional Analysis | 19
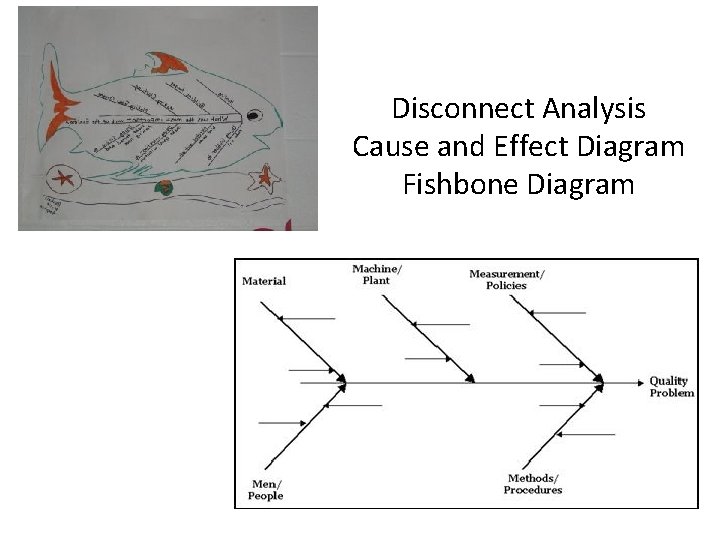
Disconnect Analysis Cause and Effect Diagram Fishbone Diagram
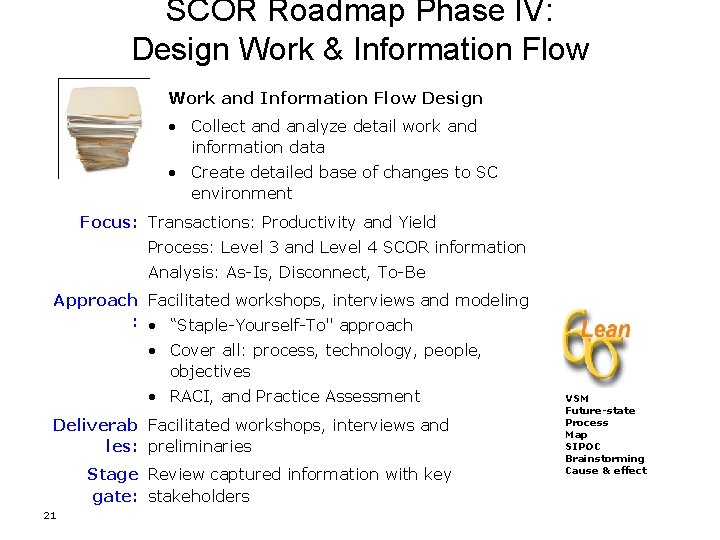
SCOR Roadmap Phase IV: Design Work & Information Flow Work and Information Flow Design • Collect and analyze detail work and information data • Create detailed base of changes to SC environment Focus: Transactions: Productivity and Yield Process: Level 3 and Level 4 SCOR information Analysis: As-Is, Disconnect, To-Be Approach Facilitated workshops, interviews and modeling : • “Staple-Yourself-To" approach • Cover all: process, technology, people, objectives • RACI, and Practice Assessment Deliverab Facilitated workshops, interviews and les: preliminaries Stage Review captured information with key gate: stakeholders 21 VSM Future-state Process Map SIPOC Brainstorming Cause & effect
SCOR Roadmap Phase V: Implementation Planning • Ensure the implementation or deployment teams have thorough understanding of the designs • Designs and plans are validated Focus: Projects: Aggregate Problem Statements into Projects Impact: Decision Matrices Approach: Implementation, Charter, and Sequence Approach: Segregate and Prioritize projects, select deployment strategy, establish detailed requirements documentation and, integrate team members in deployment teams Deliverable High level deployment plans for Lean, Six-Sigma, or s: Convergence focus projects, to-be process documentation/training materials and/or requirements documentation Stage gate: Release documentation to and education to (staffed, funded and named) process deployment teams 22
Income Benefit Summary* 23
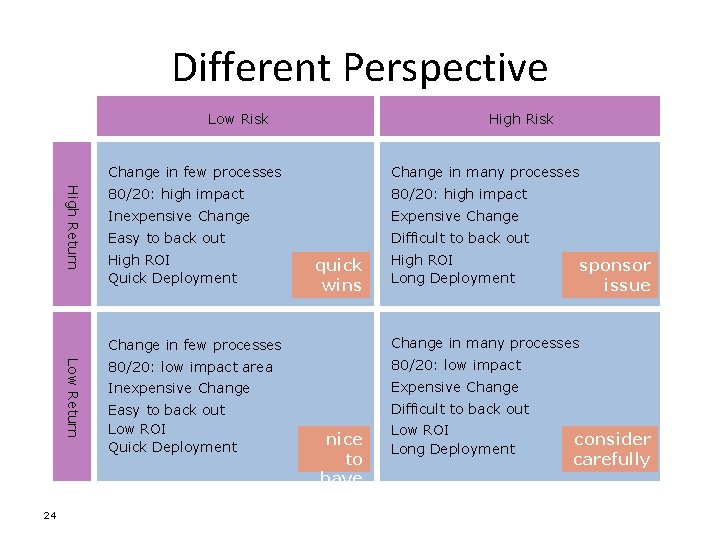
Different Perspective Low Risk High Return Low Return 24 High Risk Change in few processes Change in many processes 80/20: high impact Inexpensive Change Easy to back out Difficult to back out High ROI Quick Deployment quick wins High ROI Long Deployment sponsor issue Change in few processes Change in many processes 80/20: low impact area 80/20: low impact Inexpensive Change Easy to back out Low ROI Quick Deployment Difficult to back out nice to have Low ROI Long Deployment consider carefully
Assignment 10. 2 SCOR – Lean – Six Sigma 25
Assignment 10. 2 SCOR – Lean – Six Sigma • After reading Principles of Supply Chain Management Chapter 8 on Lean and Six Sigma in the Supply Chain as well as pages 499 -503 on SCOR as well as having reviewed the previous slide deck; write a 2 -4 page paper answering the following: 1. Briefly describe: The SCOR model and SCOR Roadmap; Lean; and Six Sigma. Answer should include: SCOR architecture and 2. How are SCOR, Lean, and Six Sigma different from each other? 3. What do SCOR, Lean, and Six Sigma have in common? 4. You have recently been hired as VP of Supply Chain and can see your new employers supply chain needs improvement. Which or which combination of supply chain performance methodologies (SCOR, Lean, or Six Sigma) would you use? Why?
Assignment 10. 3 Top 25 Supply Chains: Trends & Strategies 27
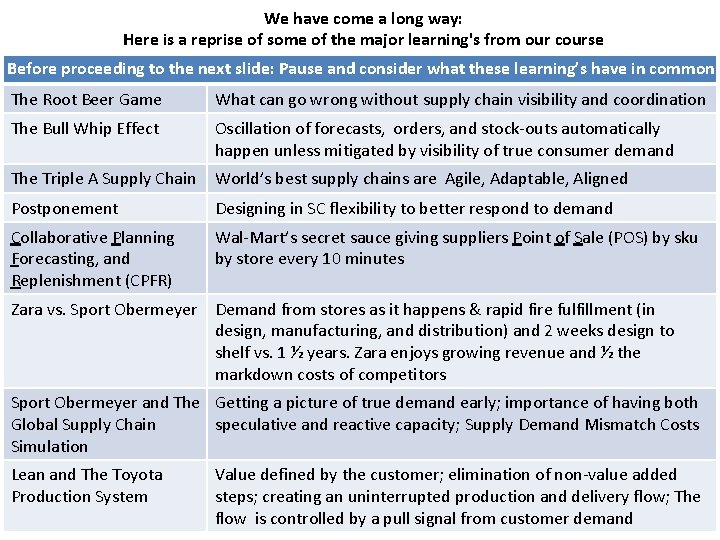
We have come a long way: Here is a reprise of some of the major learning's from our course Before proceeding to the next slide: Pause and consider what these learning’s have in common The Root Beer Game What can go wrong without supply chain visibility and coordination The Bull Whip Effect Oscillation of forecasts, orders, and stock-outs automatically happen unless mitigated by visibility of true consumer demand The Triple A Supply Chain World’s best supply chains are Agile, Adaptable, Aligned Postponement Designing in SC flexibility to better respond to demand Collaborative Planning Forecasting, and Replenishment (CPFR) Wal-Mart’s secret sauce giving suppliers Point of Sale (POS) by sku by store every 10 minutes Zara vs. Sport Obermeyer Demand from stores as it happens & rapid fire fulfillment (in design, manufacturing, and distribution) and 2 weeks design to shelf vs. 1 ½ years. Zara enjoys growing revenue and ½ the markdown costs of competitors Sport Obermeyer and The Getting a picture of true demand early; importance of having both Global Supply Chain speculative and reactive capacity; Supply Demand Mismatch Costs Simulation Lean and The Toyota Production System Value defined by the customer; elimination of non-value added steps; creating an uninterrupted production and delivery flow; The flow is controlled by a pull signal from customer demand
Successful Supply Chains focus on visibility , Collaboration, and Coordination. They seek a clear and early picture of true consumer They build supply chains that can quickly respond to demand In essence they are demand driven The benefits are greater revenues from meeting consumer demand building customer loyalty; lower supply demand mismatch costs; and therefore higher profits In this assignment we are going to learn from the world’s top supply chains how they focus on being demand driven; their strategies; as well as current supply chain trends Our learning vehicle is Gartner’s Top 25 Supply Chain Report for 2012
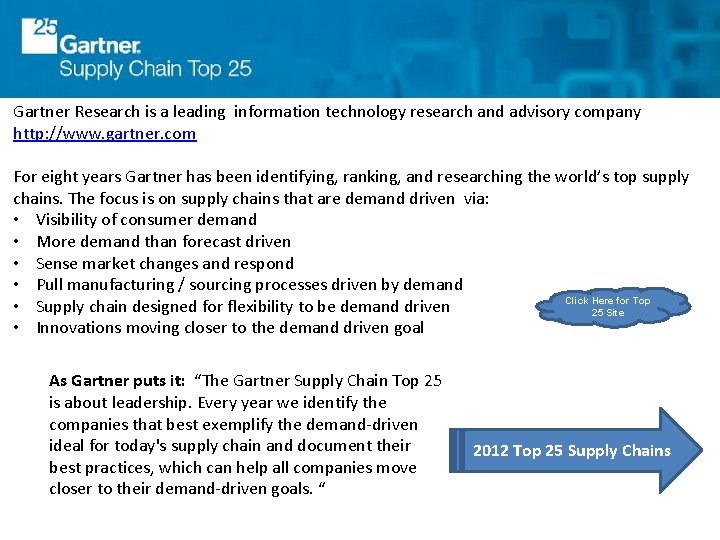
Gartner Research is a leading information technology research and advisory company http: //www. gartner. com For eight years Gartner has been identifying, ranking, and researching the world’s top supply chains. The focus is on supply chains that are demand driven via: • Visibility of consumer demand • More demand than forecast driven • Sense market changes and respond • Pull manufacturing / sourcing processes driven by demand Click Here for Top • Supply chain designed for flexibility to be demand driven 25 Site • Innovations moving closer to the demand driven goal As Gartner puts it: “The Gartner Supply Chain Top 25 is about leadership. Every year we identify the companies that best exemplify the demand-driven ideal for today's supply chain and document their best practices, which can help all companies move closer to their demand-driven goals. “ 2012 Top 25 Supply Chains
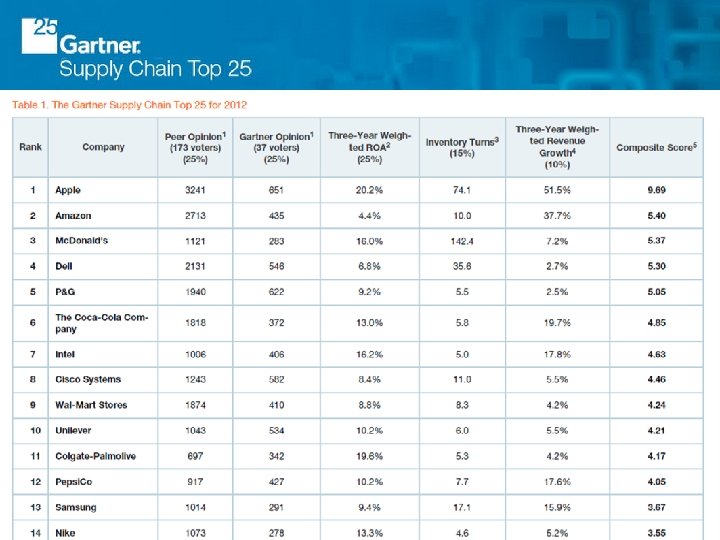
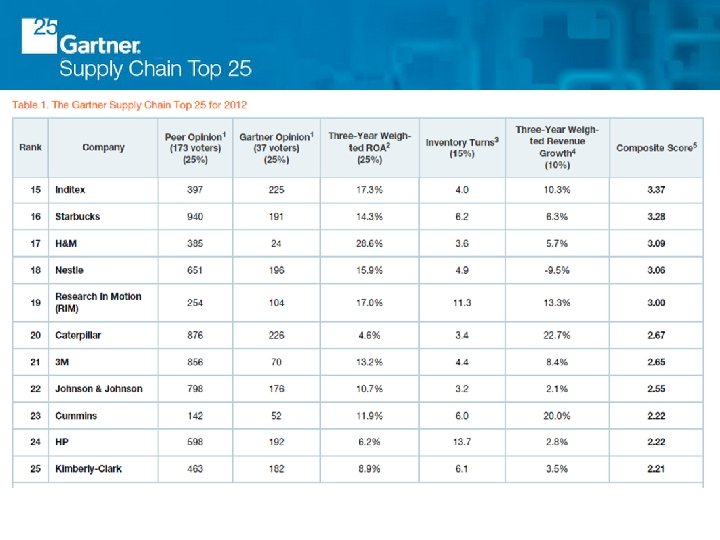
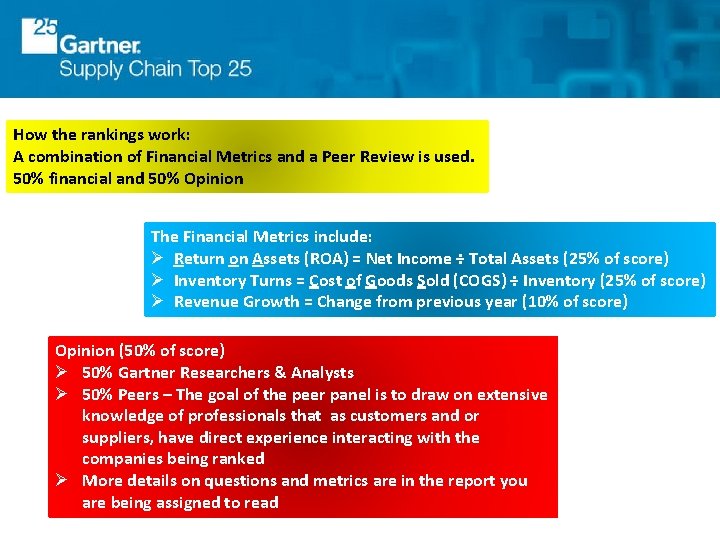
How the rankings work: A combination of Financial Metrics and a Peer Review is used. 50% financial and 50% Opinion The Financial Metrics include: Ø Return on Assets (ROA) = Net Income ÷ Total Assets (25% of score) Ø Inventory Turns = Cost of Goods Sold (COGS) ÷ Inventory (25% of score) Ø Revenue Growth = Change from previous year (10% of score) Opinion (50% of score) Ø 50% Gartner Researchers & Analysts Ø 50% Peers – The goal of the peer panel is to draw on extensive knowledge of professionals that as customers and or suppliers, have direct experience interacting with the companies being ranked Ø More details on questions and metrics are in the report you are being assigned to read
Assignment 10. 3 (20 points) First – Read The Top 25 supply Chains 2012 by Gartner Research linked here In a 1 -2 page paper answer the following question: 1. What are the trends emerging from among the leaders? 2. What evidence do you see of superior supply chain performance driving superior financial performance? 3. Select any 3 of the top 25 and comment on their strategies and or innovations that is driving performance? 4. Which is your favorite demand driven supply chain? Why?
- Slides: 34