SUPPLY AND DEMAND HOW MARKETS WORK MARKETS AND


")


")


 or natural")
 § When a tax, fee, or regulation is")


 become")

 enter a market,")


")


 • A MAXIMUM price set by the government that")

… Price of Ice-Cream Cone The")
 • A MINIMUM price set by the government that")

… Price of Ice-Cream Cone The")

- Slides: 97
SUPPLY AND DEMAND: HOW MARKETS WORK
MARKETS AND COMPETITION • A market is a group of buyers and sellers of a particular good or service.
MARKETS AND COMPETITION • Buyers determine demand. • Sellers determine supply.
DEMAND • Quantity demanded : the amount of a good that buyers are willing and able to purchase. • Law of Demand • The quantity demanded of a good falls when the price of the good rises. # $ Demanded
Ben’s Demand Schedule
Ben’s Demand Curve Price of Ice-Cream Cone $3. 00 2. 50 1. A decrease in price. . . 2. 00 1. 50 1. 00 0. 50 0 1 2 3 4 5 6 7 8 9 10 11 12 Quantity of Ice-Cream Cones 2. . increases quantity of cones demanded.
Change in Quantity Demanded • Movement along the demand curve. • Caused by a change in the price of the product.
Change in Quantity Demanded Price of Ice. Cream Cones B $2. 00 A tax that raises the price of ice-cream cones results in a movement along the demand curve. A 1. 00 D 0 4 8 Quantity of Ice-Cream Cones
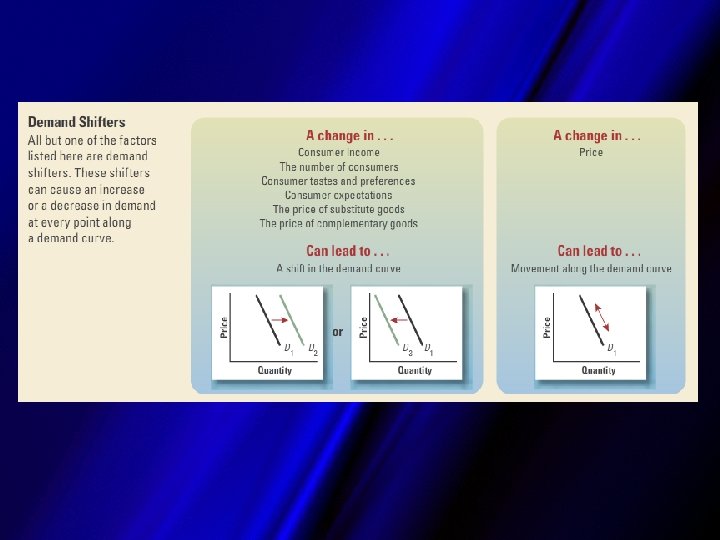
(Demand Shifters)
What is a change in demand? • Any change that alters the quantity demanded at every price. • A shift in the demand curve, either to the left or right.
Shifts in the Demand Curve Price of Ice-Cream Cone Increase in demand Decrease in demand D 1 D D 2 0 Quantity of Ice-Cream Cones
Demand Shifters: Tastes & Preferences of Consumers Income of Consumers Related Goods: Substitutes & Complements Expectations of Future Price Changes Size of population/Market
Tastes & Preferences of Consumers • As people’s tastes change in favor P of a good, or an effective advertising campaign has been waged, demand increases (shifts to the right). • As people’s tastes change against P a good, or a good loses popularity, demand decreases (shifts to the left). D D 1 Q D 1 D Q
Example: When Michael Jordan began endorsing the products, demand for Nike & Gatorade increased.
Income of Consumers • As income increases, consumer demand for goods and services increases (shifts to the right). • As income decreases, consumer demand for goods and services decreases (shifts to the left).
Example: When Billy got laid off from his job, his demand for gourmet steak dinners decreased.
Related Goods: Substitutes Substitute goods can be easily used in place of one another. • If two goods are SUBSTITUTES, when the price of Good A increases, demand for Good B increases (shifts to the right). • If two goods are SUBSTITUTES, when the price of Good A decreases, demand for Good B decreases (shifts to the left).
Example: Demand for Starbucks changes when Caribou alters its prices
Related Goods: Complements Complementary goods are used WITH each other. • If two goods are COMPLEMENTS, when the price of Good A increases, demand for Good B decreases (shifts to the left). • If two goods are COMPLEMENTS, when the price of Good A decreases, demand for Good B increases (shifts to the right).
Example: Demand for ketchup changes when hamburger prices fluctuate
Substitute OR Complementary? • Cars and Tires • Corn and Beans • DVD Players and DVD’s • Natural Gas and Electricity • Cereal and Milk • Toast and Jam • Sweatshirts and Sweaters
Expectations of Future Price Changes • If consumers expect the price of a good to rise in the future, immediate demand increases (shifts to the right). • If consumers expect the price of a good to decrease in the future, immediate demand decreases (shifts to the left).
Example: Demand for gas changes throughout the week
Size of Population/Market • As the number of consumers in a given market increases, demand increases (shifts to the right). • As the number of consumers in a given market decreases, demand decreases (shifts to the left).
Example: Demand for girl scout patches increases when more girls join girl scouts
Variables That Influence Buyers
Shifts in Demand A well known athlete who endorses a line of button down shirts is discovered to have been unfaithful to his wife. Demand Shift: Left
Shifts in Demand The number of Netflix rentals if movie tickets prices increase to $12. 00 person. Demand Shift: Righ t
“Analyzing Demand Headlines” Activity Instructions • May work with your partner. • In this activity, you will work with your partner to analyze a series of newspaper headlines. Based on information in each headline, you will investigate what happens to the demand curve for a related product.
Work with your group to analyze headlines that will likely affect demand by following these steps: 1. Carefully read one of the demand headlines. Determine whether the information will – Shift the entire curve to the left or to the right, or – Not shift the demand curve, but change the quantity demanded along the original curve.
On your worksheet… 1. Summarize the headline in the corresponding row. 2. Draw what will likely happen to the demand curve. 3. Explain what happened to the demand curve & why. – Cite & underline the shifter (TIRES), or explain why the curve did not shift, and whether quantity demanded increased or decreased. Wages Decline for U. S. Workers D 2 -Demand decreased (shifted left) -Income of consumers decreased
Have your work checked by the teacher. Then repeat the process with a new headline until AH are completed. 1. Summarize the headline in the corresponding row. 2. Draw what will likely happen to the demand curve. 3. Explain what happened to the demand curve & why.
OF DEMAND
WHAT WILL CONSUMERS DO WHEN PRICES CHANGE? ? ? How much more will consumers buy if the price falls? How much less will consumers buy if the price rises?
ELASTICITY OF DEMAND: Measurement of consumers’ sensitivity to price. ELASTIC: INELASTIC: Buyers are responsive to price changes. Buyers are not responsive to price changes.
Determinants of Demand Elasticity: • • Availability of substitutes Price relative to income Necessities vs. Luxuries Time needed to adjust to a price change
Elastic or Inelastic? • • • Sugar New furniture New car Gasoline Food Encyclopedia • 2% Milk • Sailboat • Socks • Aspirin • Diet Coke • Gold Jewelry • Insulin
SUPPLY • Quantity supplied is the amount of a good that sellers are willing and able to sell. • Law of Supply • The quantity supplied of a good rises when the price of the good rises. # supplied $
Jerry’s Supply Schedule Price of Ice cream cone Qty. of Cones supplied
Jerry’s Supply Curve Price of Ice-Cream Cone $3. 00 1. An increase in price. . . 2. 50 2. 00 1. 50 1. 00 0. 50 0 1 2 3 4 5 6 7 8 9 10 11 12 Quantity of Ice-Cream Cones 2. . increases quantity of cones.
Change in Quantity Supplied • Movement along the supply curve. • Caused by a change in the price of the product.
Change in Quantity Supplied Price S C $3. 00 A rise in the price of ice cream cones results in a movement along the supply curve. A 1. 00 0 1 5 Quantity of Ice-Cream Cones
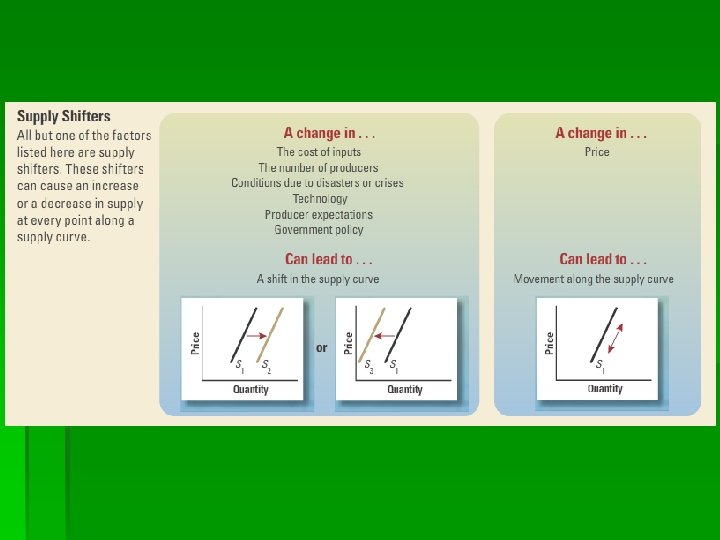
(Supply Shifters)
What is a change in supply? § Any change that alters the quantity supplied at every price. § A shift in the supply curve, either to the left or right.
Shifts in the Supply Curve Price of Ice-Cream Cone S 2 S Decrease in supply S 1 Increase in supply 0 Quantity of Ice-Cream Cones
Supply Shifters: Technology International Events/Disasters Government Intervention Expectations for Future Price Changes Resource Costs Number of Sellers in the Market
Technological Advancements § As technology advances, production P becomes more efficient and supply increases (shifts to the right). S S 1 Q
International Events/Disasters § When international events (such as P wars & revolutions) or natural disasters occur, supply decreases (shifts to the left). S 1 S Q
Government Intervention (Taxes, Fees, Regulations, Subsidies) § When a tax, fee, or regulation is P imposed on the production of a good or service, supply decreases (shifts to the left). P § When a subsidy is granted for producers of a good or service, supply increases (shifts to the right). S 1 S Q S S 1 Q
Example: If the import tax on Toyota Corollas increases, the profit per unit decreases, and American manufacturers will not be able to afford to offer as many for sale. P S 1 S Q
Example: When the government decided to subsidize dairy farming, dairy farmers’ profits increased, therefore increasing supply of dairy cattle. P S S 1 Q
Expectations of Future Price Changes § If producers expect the price of a good to rise in the future, immediate supply decreases (shifts to the left). § If producers expect the price of a good to decrease in the future, immediate supply increases (shifts to the right). P S 1 S Q P S S 1 Q
Example: If Farmer Joe hears that the price of corn is going to increase next month, he’s going to wait to sell his corn (therefore decreasing the immediate supply of corn).
Resource Costs § As the factors of production (land, P labor, and capital) become more expensive for the producer to purchase, supply decreases (shifts to the left). § As the factors of production (land, P labor, and capital) become less expensive for the producer to purchase, supply increases (shifts to the right). S 1 S Q S S 1 Q
Example: Don’s landlord increases his rent, which increases Don’s costs of production. Since it’s more expensive to make a donut, the profit per unit earned decreases and supply of Don’s Donuts falls.
Number of Sellers in the Market § When additional firms (businesses) enter a market, supply of the product increases (shifts to the right). § When firms (businesses) exit a market (go out of business or for some other reason cease production), supply of the product decreases (shifts to the left). P S S 1 Q P S 1 S Q
Example: If the Bartow City Council passed a law banning pizza from being sold within city limits, pizza producers would have to close/move, decreasing the supply of pizza in Bartow.
Variables That Influence Sellers
Shifts in Supply Due to recent high fuel prices, United Airlines has reduced the number of flights to the Caribbean for the upcoming spring break. Supply Shift: Left
Shifts in Supply A water bottle company hears a forecast for a hurricane in the Polk county area early next week. Supply Shift: Right
Shifts in Supply The state of Florida announces higher taxes on gasoline to cover road repairs. Supply Shift: Left
“Analyzing Supply Headlines” Activity Instructions • May work with your partner. • In this activity, you will work with your partner to analyze a series of newspaper headlines. Based on information in each headline, you will investigate what happens to the demand curve for a related product.
Work with your group to analyze headlines that will likely affect supply by following these steps: 1. Carefully read one of the demand headlines. Determine whether the information will – Shift the entire curve to the left or to the right, or – Not shift the supply curve, but change the quantity supply along the original curve.
On your worksheet… 1. Summarize the headline in the corresponding row. 2. Draw what will likely happen to the supply curve. 3. Explain what happened to the supply curve & why. – Cite & underline the shifter (TIGERS), or explain why the curve did not shift, and whether quantity supplied increased or decreased. Wages Decline for U. S. Workers D 2 -Demand decreased (shifted left) -Income of consumers decreased
Have your work checked by the teacher. Then repeat the process with a new headline until I-P are completed. 1. Summarize the headline in the corresponding row. 2. Draw what will likely happen to the demand curve. 3. Explain what happened to the supply curve & why.
OF SUPPLY
WHAT WILL PRODUCERS DO WHEN PRICES CHANGE? ? ? How much less will producers make if the price falls? How much more will producers make if the price rises?
ELASTICITY OF SUPPLY: Measurement of producers’ sensitivity to price. ELASTIC: INELASTIC: Producers are responsive to price changes. Producers are not responsive to price changes.
Determinants of Supply Elasticity: Availability of inputs Mobility of inputs Storage capacity Time needed to adjust to a price change
Elastic or Inelastic? Bananas Yogurt Antiques Medical Care
How Demand & Supply Interact to Determine Prices of Goods & Services
SUPPLY AND DEMAND TOGETHER Equilibrium Qs= Qd Law of Supply and Demand: The price of any good adjusts to bring the quantity supplied and the quantity demanded for that good into balance.
SUPPLY AND DEMAND TOGETHER Demand Schedule Supply Schedule At $2. 00, the quantity demanded is equal to the quantity supplied!
The Equilibrium of Supply and Demand Price of Ice-Cream Cone Supply Equilibrium price $2. 00 Equilibrium quantity 0 1 2 3 4 5 6 7 8 Demand 9 10 11 12 13 Quantity of Ice-Cream Cones
P 2 D 2 Q 2
P 2 D 2 Q 2
S 2 P 2 Q 2
S 2 P 2 Q 2
FOUR STEPS TO ANALYZING CHANGES IN EQUILIBRIUM Does the event shift the supply (TIGERS) or demand curve (TIRES)? Will the curve shift right ( Draw & label the new curve on your graph Locate the new equilibrium (price and quanity) ) or left ( )?
$ QD QS 200 24 1 300 16 10 400 10 16 500 4 22 600 0 25 Airline Tickets 600 S Price $ 500 400 350 300 200 D 100 0 0 2 4 6 8 10 121314 Quantity # 16 18 22 24 26 28
Spaghetti Sauce P 2 D 2 Q 2
Orange Juice S 2 P 2 Q 2
Red Delicious Apples S 2 P 2 Q 2
Hotel Rooms @ Colorado Ski Resorts P 2 D 2 Q 2
Why would the government step in to control the prices of goods and services? Would economists think that controlling prices is good idea?
PRICE CEILING: (Creates a Shortage) • A MAXIMUM price set by the government that consumers are required to pay for a good or service. • Prevents prices from getting too high, enabling consumers to buy essential goods or services they wouldn’t be able to afford at the equilibrium price • Example: Rent control
PRICE CEILING Price Ceiling Qs Qd
If the price is too low (Qd > Qs)… Price of Ice-Cream Cone The Price Will Rise! Supply $2. 00 $1. 00 Demand Quantity Demanded Quantity Supplied 0 1 2 3 4 5 6 7 8 9 10 11 12 13 Quantity of Ice-Cream Cones
PRICE FLOOR: (Creates a Surplus) • A MINIMUM price set by the government that consumers are required to pay for a good or service. • Pushes price up, ensuring that producers receive a benefit for providing a good or service • Example: Minimum wage
PRICE FLOOR Price Floor Qd Qs
If the price is too high (Qs > Qd)… Price of Ice-Cream Cone The Price Will Drop! Supply $3. 00 $2. 00 Quantity Supplied Quantity Demanded 0 1 2 3 4 5 6 7 8 9 Demand 10 11 12 13 Quantity of Ice-Cream Cones
Shortage and Surplus of Apples Indicate whethere is a shortage (quantity demanded > quantity supplied) or a surplus (quantity supplied > quantity demanded). Indicate the amount of the shortage or surplus. Price per bushel Quantity demanded (D) Quantity Supplied (S) Surplus or Shortage Amount $40 20 60 $32 30 50 Surplus 40 $24 40 40 Surplus 20 $16 50 30 $8 60 20 Equilibrium Shortage 20 Shortage 40