Supply and Demand Crash Course Economics 4 Demand


- Slides: 13
Supply and Demand: Crash Course Economics #4 Demand Supply Explained- Econ 2. 1 Demand Supply Explained (2 of 2) - Econ 2. 2
Understanding Supply Principles Supply: the amount of a good or service that producers are willing and able to sell at all prices in a given period In order to be part of the supply for a product, two things must be true: 1. The producer must be willing to sell the product 2. The producer must be able to sell the product
Understanding Supply Principles Quantity Supplied : the amount of a good or service that producers are willing and able to sell at a specific price Law of Supply: as prices increase , the quantity supplied increases and vice versa
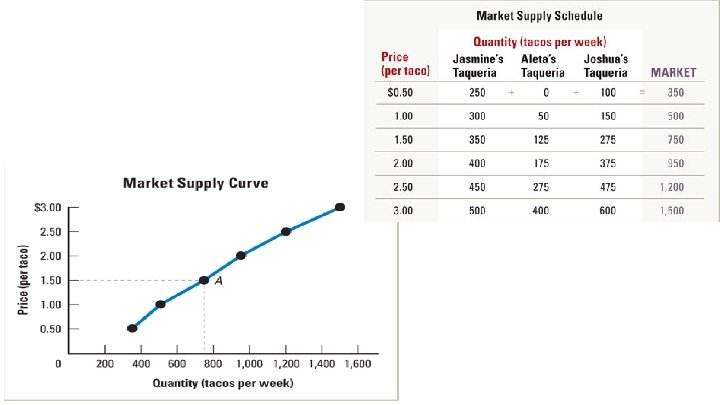
Supply and Price Interactions Suppy can be influenced by price. ● Affects the willingness to sell a product at different prices Supply Schedule: Shows how prices influence supply by listing the quantities of a good that one producer will sell at different prices.
• Supply Curve: Also shows how prices influence supply by graphing the data listed in a supply schedule. As price changes, the quantity supplied moves along the supply curve.
Supply Schedule Market Schedule Personal supply: the supply of just one producer Market supply: the sum of all the individual quantities supplied in a market
What Causes Supply to Change? Supply Shifters: factors that can causes a change in the supply of a good or service (very similar to demand shifters) (S) Changes in government policy (P) Changes in profit opportunities (I) Changes in the cost of inputs (T) Changes in technology (E) Changes in the number of suppliers (N) Changes in producer expectations
Graphing the Changes in Supply Changes in supply happen when quantities change at ALL prices. ● Supply can increase or decrease ● Always affected by outside factors Supply shift: when the curve moves ● NOT affected by price ● Supply decrease, supply curve shifts LEFT ● Supply increase, supply curve shifts RIGHT
DECREASE in supply shifts the supply curve LEFT INCREASES in supply shifts the supply curve RIGHT
When Demand Supply Mix Equilibrium: the point where quantity supplied meets quantity demanded ● quantity demanded = quantity supplied Equilibrium Price: the price at which equilibrium is achieved ● aka “market-clearingprice ” S Price D Quantity
Remember!! • The DEMAND line always runs DOWNWARD. • The SUPPLY line always runs UPWARD.
Works Cited • http: //www. businessstudynotes. com/others/economics/law-of-supplymovment-in-supply-curve/ • https: //www. emaze. com/@AFQRQQLF/Supply-in-Economics