
Supplement 1 Game Theory To accompany Quantitative Analysis

- Slides: 16
Supplement 1 Game Theory To accompany Quantitative Analysis for Management, 8 e by Render/Stair/Hanna S-1 1
Learning Objectives After completing this supplement, students will be able to: • Understand the principles of zerosum, two person games. • Analyze pure strategy games and use dominance to reduce the size of the game. • Solved mixed strategy games when there is no saddle point. To accompany Quantitative Analysis for Management, 8 e by Render/Stair/Hanna S-2 2
Supplement Outline S 1. 1 Introduction S 1. 2 Language of games S 1. 3 Minimax Criterion S 1. 4 Pure strategy games S 1. 5 Mixed strategy games S 1. 6 Dominance To accompany Quantitative Analysis for Management, 8 e by Render/Stair/Hanna S-3 3
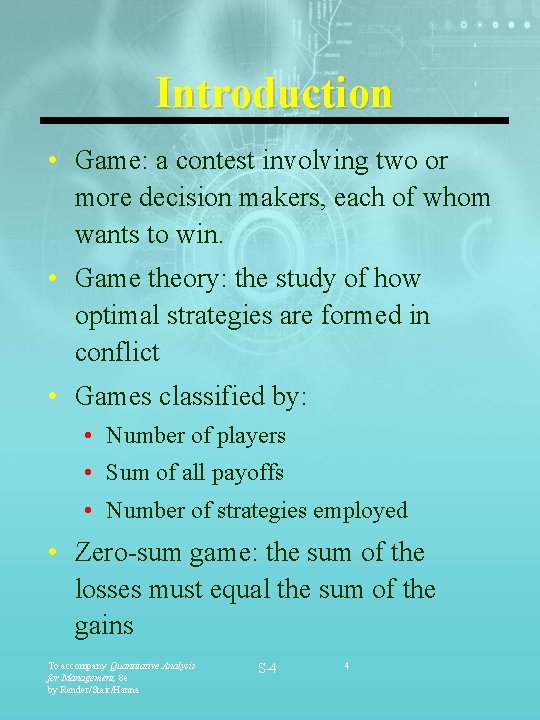
Introduction • Game: a contest involving two or more decision makers, each of whom wants to win. • Game theory: the study of how optimal strategies are formed in conflict • Games classified by: • Number of players • Sum of all payoffs • Number of strategies employed • Zero-sum game: the sum of the losses must equal the sum of the gains To accompany Quantitative Analysis for Management, 8 e by Render/Stair/Hanna S-4 4
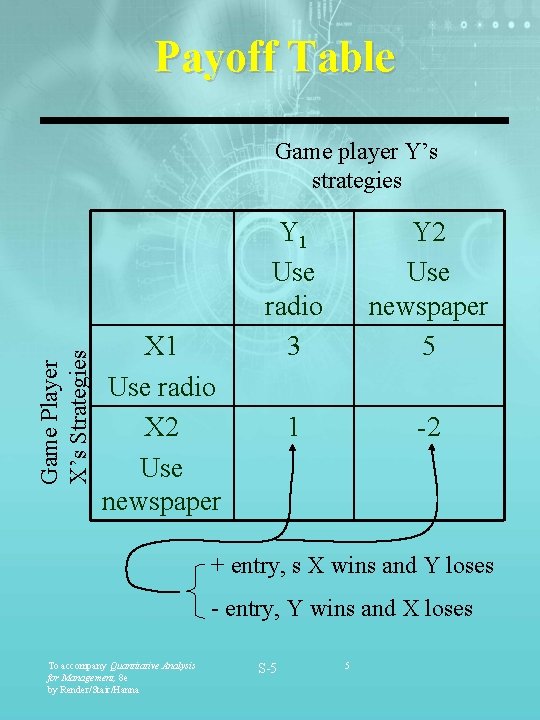
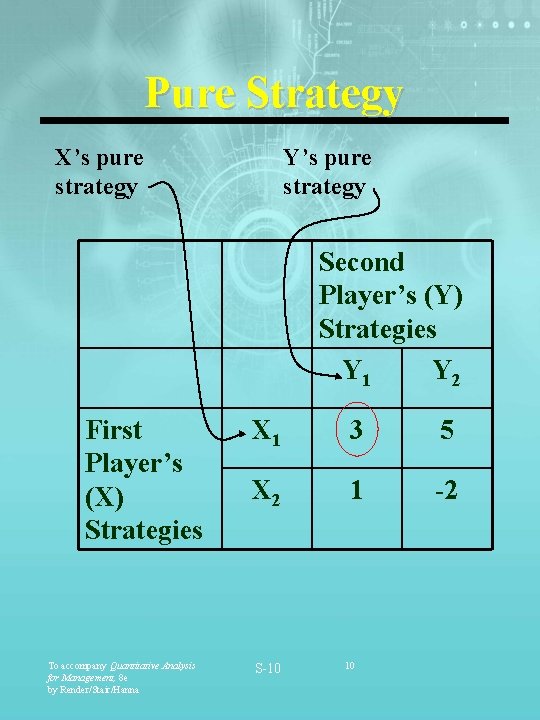
Payoff Table Game Player X’s Strategies Game player Y’s strategies X 1 Use radio X 2 Use newspaper Y 1 Use radio 3 Y 2 Use newspaper 5 1 -2 + entry, s X wins and Y loses - entry, Y wins and X loses To accompany Quantitative Analysis for Management, 8 e by Render/Stair/Hanna S-5 5
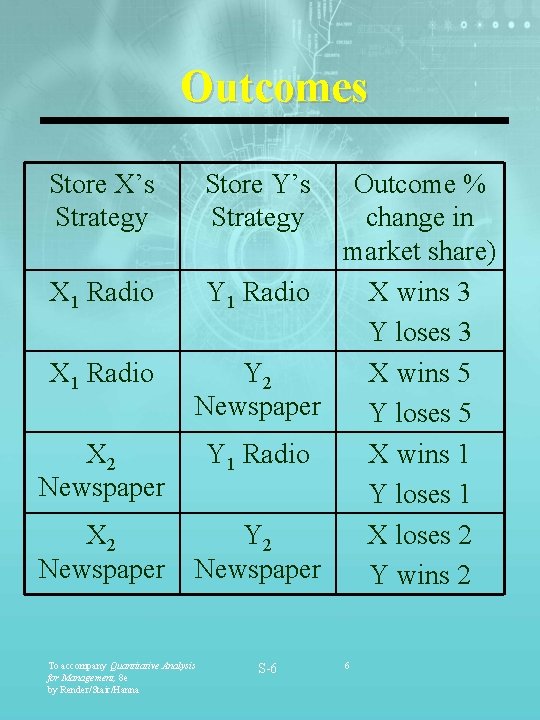
Outcomes Store X’s Strategy X 1 Radio X 2 Newspaper Outcome % change in market share) Y 1 Radio X wins 3 Y loses 3 Y 2 X wins 5 Newspaper Y loses 5 Y 1 Radio X wins 1 Y loses 1 Y 2 X loses 2 Newspaper Y wins 2 To accompany Quantitative Analysis for Management, 8 e by Render/Stair/Hanna Store Y’s Strategy S-6 6
Minimax Criterion • In a zero-sum game, each person can choose the strategy that minimizes the maximum loss To accompany Quantitative Analysis for Management, 8 e by Render/Stair/Hanna S-7 7
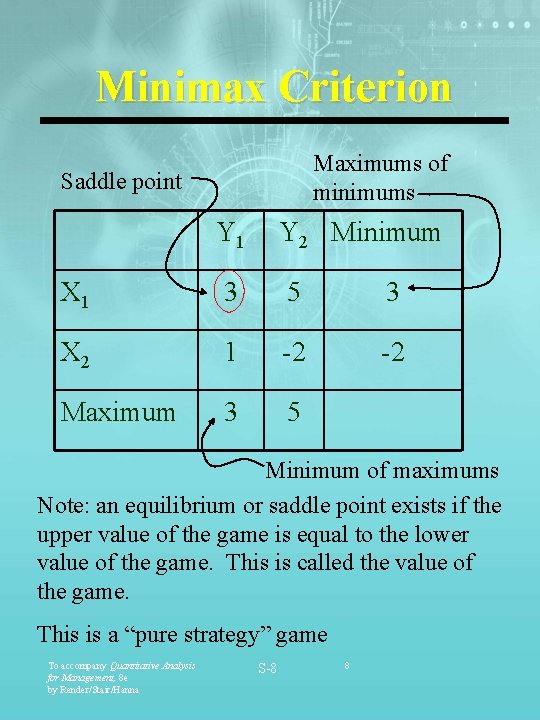
Minimax Criterion Maximums of minimums Saddle point Y 1 Y 2 Minimum X 1 3 5 3 X 2 1 -2 -2 Maximum 3 5 Minimum of maximums Note: an equilibrium or saddle point exists if the upper value of the game is equal to the lower value of the game. This is called the value of the game. This is a “pure strategy” game To accompany Quantitative Analysis for Management, 8 e by Render/Stair/Hanna S-8 8
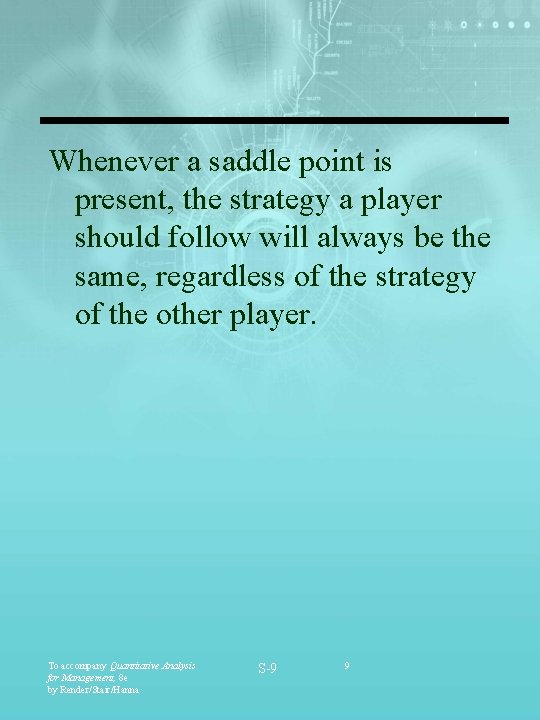
Whenever a saddle point is present, the strategy a player should follow will always be the same, regardless of the strategy of the other player. To accompany Quantitative Analysis for Management, 8 e by Render/Stair/Hanna S-9 9
Pure Strategy X’s pure strategy Y’s pure strategy Second Player’s (Y) Strategies Y 1 Y 2 First Player’s (X) Strategies To accompany Quantitative Analysis for Management, 8 e by Render/Stair/Hanna X 1 3 5 X 2 1 -2 S-10 10
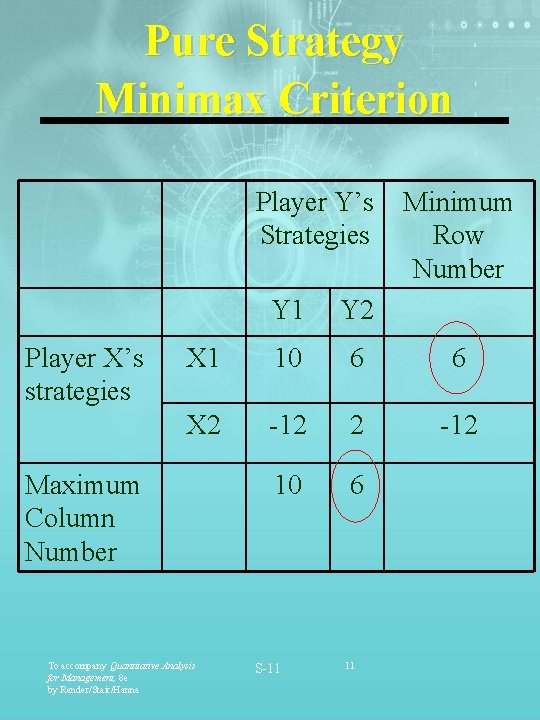
Pure Strategy Minimax Criterion Player Y’s Strategies Player X’s strategies Minimum Row Number Y 1 Y 2 X 1 10 6 6 X 2 -12 10 6 Maximum Column Number To accompany Quantitative Analysis for Management, 8 e by Render/Stair/Hanna S-11 11
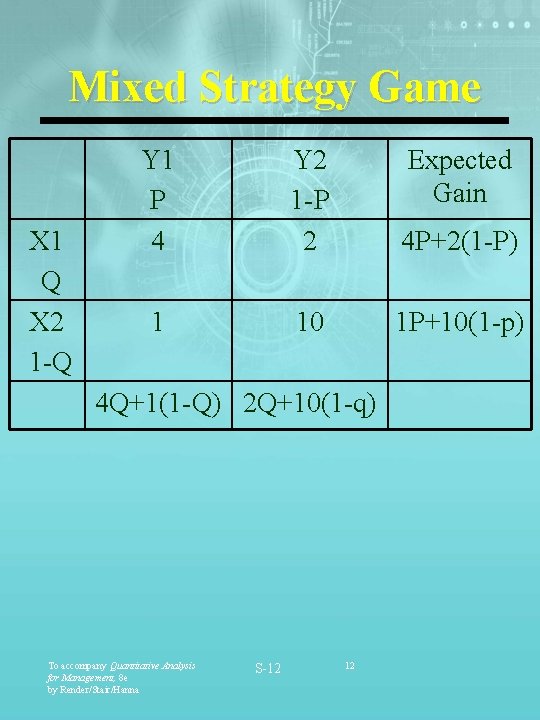
Mixed Strategy Game X 1 Q X 2 1 -Q Y 1 P 4 Y 2 1 -P 2 Expected Gain 4 P+2(1 -P) 1 10 1 P+10(1 -p) 4 Q+1(1 -Q) 2 Q+10(1 -q) To accompany Quantitative Analysis for Management, 8 e by Render/Stair/Hanna S-12 12
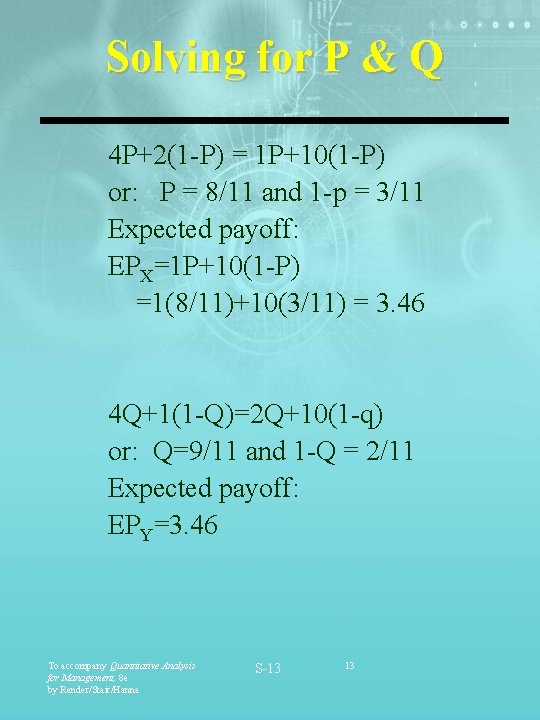
Solving for P & Q 4 P+2(1 -P) = 1 P+10(1 -P) or: P = 8/11 and 1 -p = 3/11 Expected payoff: EPX=1 P+10(1 -P) =1(8/11)+10(3/11) = 3. 46 4 Q+1(1 -Q)=2 Q+10(1 -q) or: Q=9/11 and 1 -Q = 2/11 Expected payoff: EPY=3. 46 To accompany Quantitative Analysis for Management, 8 e by Render/Stair/Hanna S-13 13
Dominance A strategy can be eliminated if all its game’s outcomes are the same or worse than the corresponding outcomes of another strategy To accompany Quantitative Analysis for Management, 8 e by Render/Stair/Hanna S-14 14
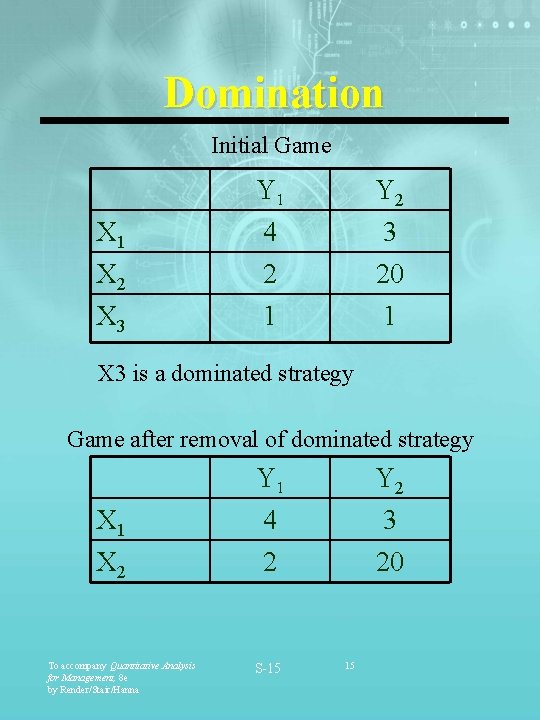
Domination Initial Game X 1 X 2 Y 1 4 2 Y 2 3 20 X 3 1 1 X 3 is a dominated strategy Game after removal of dominated strategy X 1 Y 1 4 Y 2 3 X 2 2 20 To accompany Quantitative Analysis for Management, 8 e by Render/Stair/Hanna S-15 15
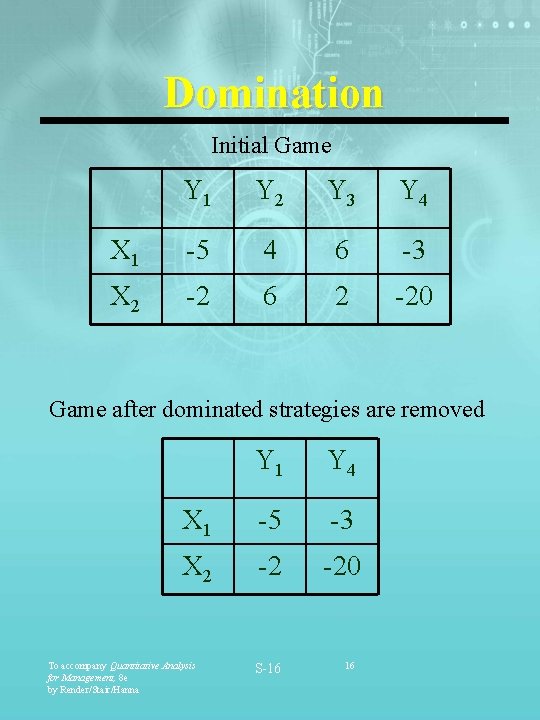
Domination Initial Game Y 1 Y 2 Y 3 Y 4 X 1 -5 4 6 -3 X 2 -2 6 2 -20 Game after dominated strategies are removed Y 1 Y 4 X 1 -5 -3 X 2 -2 -20 To accompany Quantitative Analysis for Management, 8 e by Render/Stair/Hanna S-16 16