Supervised vs Reinforcement vs Unsupervised Learning Supervised Learning


![Lee-Mumford-Pedersen [LMP] study only high contrast patches. Collection: 4. 5 x 10⁶ high contrast](https://slidetodoc.com/presentation_image_h2/8c7df1a9c2368e15aa738a2444bec920/image-14.jpg "Lee-Mumford-Pedersen [LMP] study only high contrast patches. Collection: 4. 5 x 106 high contrast")


 whose distance is less than a given threshold")
")


 Figures courtesy of Wako Bungula")


 http: //en. wikipedia. org/wiki/File: Gaussian. Scatter. PCA. png")

, (10,")
 = ? ? 4 3 Euclidean Minkowski distance Chebyshev")

")
- Slides: 36
Supervised vs Reinforcement vs Unsupervised Learning Supervised Learning Unsupervised Learning Data: x Just data, no labels! Goal: Learn some underlying hidden structure of the data Examples: Clustering, dimensionality reduction, feature learning, density estimation, etc. Data: (x, y) x is data, y is label Goal: Learn a function to map x y Examples: Classification, regression, object detection, semantic segmentation, image captioning, etc. https: //www. cc. gatech. edu/classes/AY 2020/cs 7643_fall/slides/L 23_generative 2. pptx Slide Credit: Fei-Fei Li, Justin Johnson, Serena Yeung, CS 231 n
For your final exam written project, you will turn in your weekly labs into a draft of a paper. Do not spend too much time on formatting. You must use a bib file.
http: //www. ncbi. nlm. nih. gov/pubmed/22784623
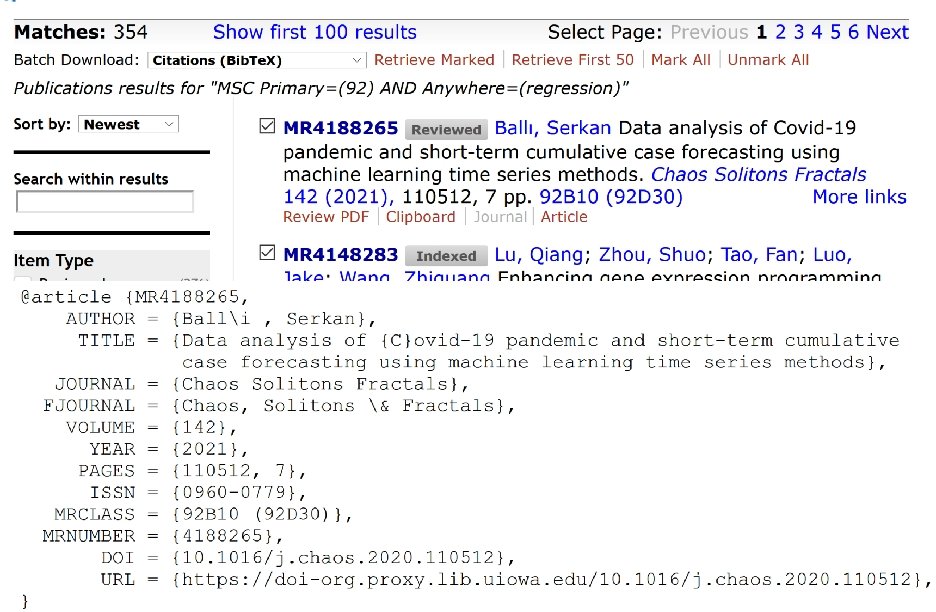
Resources for finding articles including articles about data sets: https: //mathscinet-ams-org. proxy. lib. uiowa. edu/mathscinet https: //www. ncbi. nlm. nih. gov/ https: //arxiv. org/list/math/recent https: //scholar. google. com/ Can also search for excel filetype: Duckduckgo: topic site: edu filetype: xls
https: //mathscinet-ams-org. proxy. lib. uiowa. edu/mathscinet
https: //mathscinet-ams-org. proxy. lib. uiowa. edu/msnhtml/msc 2020. pdf
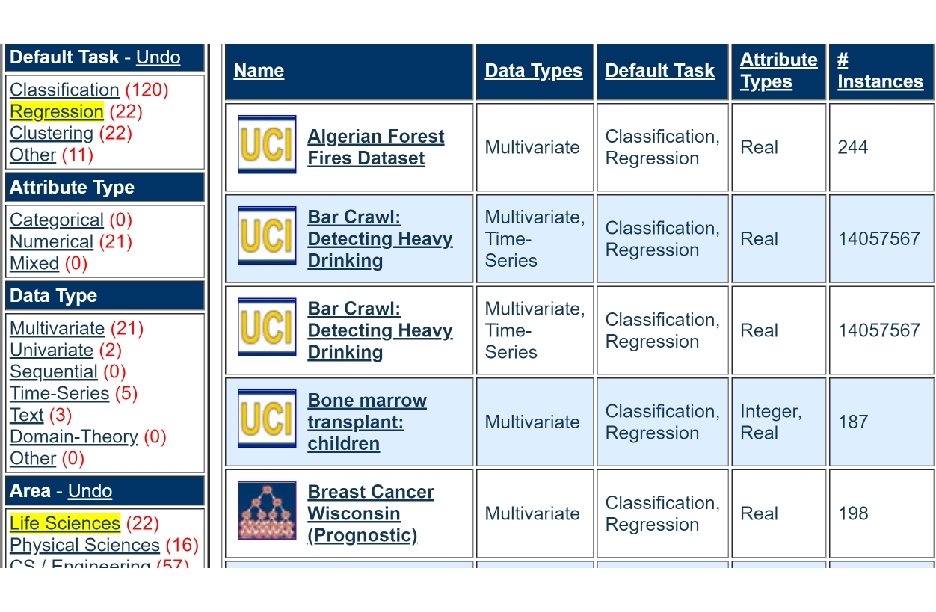
We currently maintain 412 data sets as a service to the machine learning community. http: //archive. ics. uci. edu/ml/index. php
An image taken by black and white digital camera can be viewed as a vector, with one coordinate for each pixel Each pixel has a “gray scale” value, can be thought of as a real number (in reality, takes one of 255 values) Typical camera uses tens of thousands of pixels, so images lie in a very high dimensional space, call it pixel space, P
Lee-Mumford-Pedersen [LMP] study only high contrast patches. Collection: 4. 5 x 10⁶ high contrast patches from a collection of images obtained by van Hateren and van der Schaaf http: //www. kyb. mpg. de/de/forschung/fg/bethgegroup/downloads/van-hateren-dataset. html
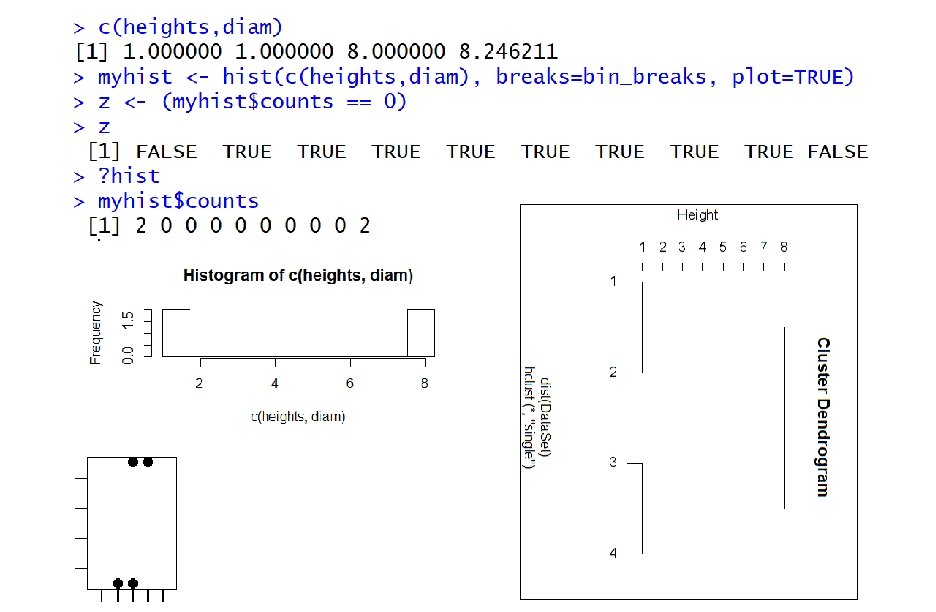
Hierarchical clustering Figure courtesy of Paul Samuel Ignacio
Hierarchical clustering Data http: //en. wikipedia. org/wiki/ File: Clusters. svg Dendrogram http: //en. wikipedia. org/wiki/File: Hierar chical_clustering_simple_diagram. svg
Increasing threshold Connect vertices whose distance is less than a given threshold single linkage hierarchical clustering
Hierarchical clustering Data http: //en. wikipedia. org/wiki/ File: Clusters. svg Dendrogram http: //en. wikipedia. org/wiki/File: Hierar chical_clustering_simple_diagram. svg
Different type of hierarchical clustering What is the distance between 2 clusters? http: //en. wikipedia. org/wiki/File: Hierar chical_clustering_simple_diagram. svg http: //www. multid. se/genex/hs 515. htm
Increasing threshold Connect vertices (or clusters) whose distance is less than a given threshold
http: //statweb. stanford. edu/~tibs/Elem. Stat. Learn/ The Elements of Statistical Learning (2 nd edition) Hastie, Tibshirani and Friedman
Figure courtesy of Paul Samuel Ignacio
If you care about connected components: Single linkage DBscan Figures courtesy of Wako Bungula If you care about closeness: Complete linkage Average linkage Ward’s linkage K-means
Dbscan (Density-based spatial clustering of applications with noise ) Figures courtesy of Wako Bungula
Figures courtesy of Wako Bungula
Figures courtesy of Wako Bungula
Figures courtesy of Wako Bungula
http: //scikit-learn. org/stable/auto_examples/cluster/plot_cluster_comparison. html
U Dimensionality Reduction: Given dataset D RN Want: embedding f: D Rn where n << N which “preserves” the structure of the data. Many reduction methods: f 1: D R, f 2: D R, … fn: D R (f 1, f 2, … fn): D Rn Many are linear, M: RN Rn, Mx = y But there also non-linear dimensionality reduction algorithms.
Example: Principle component analysis (PCA) http: //en. wikipedia. org/wiki/File: Gaussian. Scatter. PCA. png
https: //en. wikipedia. org/wiki/Nonlinear_dimensionality_reduction
Why use PCA in data analysis? Consider the points (0, 0, …, 0), (10, 0, …, 0) 0 1 Add noise to first point (0, 0, …, 0) (0, 1, …, 1) In R 100, d((0, 1, …, 1), (1, 0, …, 0)) = 10 > 9. Add small noise to first point (0, 0, …, 0) (0, 0. 1, …, 0. 1) In R 39, 900, d((0, 0. 1, …, 0. 1), (1, 0, …, 0)) = 20 > 9. 10
q 5 p d(p, q) = ? ? 4 3 Euclidean Minkowski distance Chebyshev distance
In Rn If n small, Euclidean distance often makes sense If n is large, consider Chebyshev distance or performing PCA first to project data into Rd, for small d and then using Euclidean distance Chebyshev distance:
Section 2. 2. 2: Distances (optional)