
Summer 2018 State of the Property Insurance Market



- Slides: 17
Summer 2018 State of the Property Insurance Market Heidi Hull Operations Senior Vice President FM Global
• Introduction • Current Environment • Future state
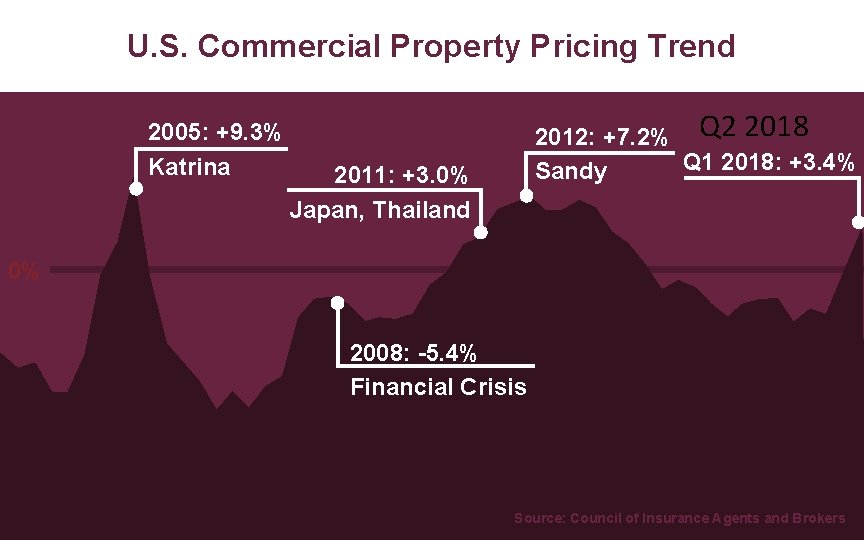
U. S. Commercial Property Pricing Trend 2005: +9. 3% Katrina 2012: +7. 2% Q 2 2018 Q 1 2018: +3. 4% Sandy 2011: +3. 0% Japan, Thailand 0% 2008: -5. 4% Financial Crisis Source: Council of Insurance Agents and Brokers
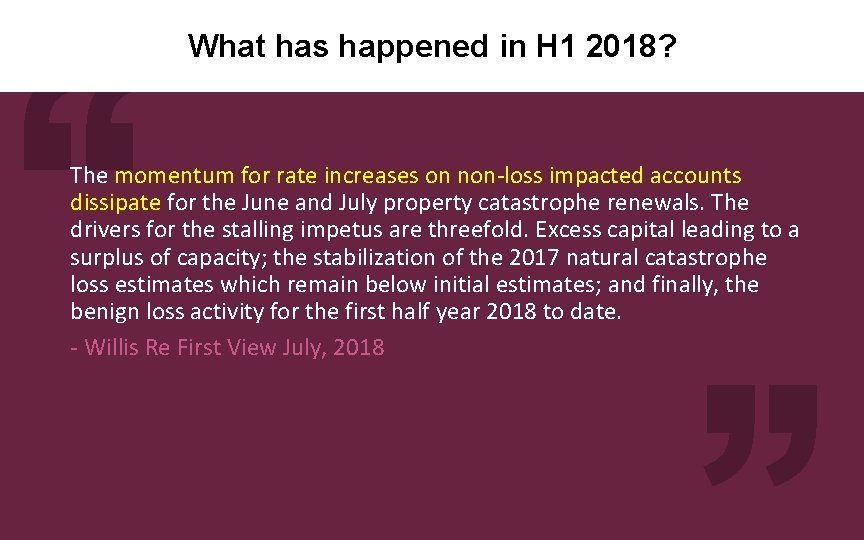
What has happened in H 1 2018? The momentum for rate increases on non-loss impacted accounts dissipate for the June and July property catastrophe renewals. The drivers for the stalling impetus are threefold. Excess capital leading to a surplus of capacity; the stabilization of the 2017 natural catastrophe loss estimates which remain below initial estimates; and finally, the benign loss activity for the first half year 2018 to date. - Willis Re First View July, 2018
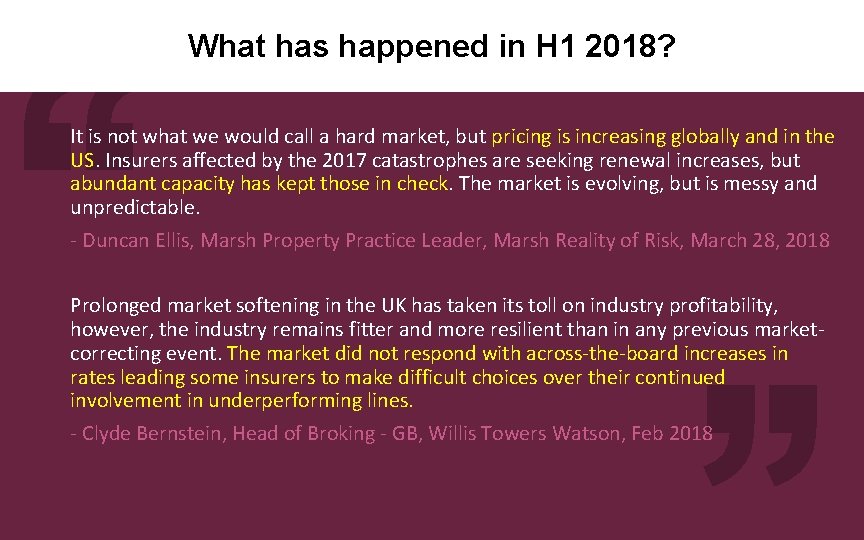
What has happened in H 1 2018? It is not what we would call a hard market, but pricing is increasing globally and in the US. Insurers affected by the 2017 catastrophes are seeking renewal increases, but abundant capacity has kept those in check. The market is evolving, but is messy and unpredictable. - Duncan Ellis, Marsh Property Practice Leader, Marsh Reality of Risk, March 28, 2018 Prolonged market softening in the UK has taken its toll on industry profitability, however, the industry remains fitter and more resilient than in any previous marketcorrecting event. The market did not respond with across-the-board increases in rates leading some insurers to make difficult choices over their continued involvement in underperforming lines. - Clyde Bernstein, Head of Broking - GB, Willis Towers Watson, Feb 2018
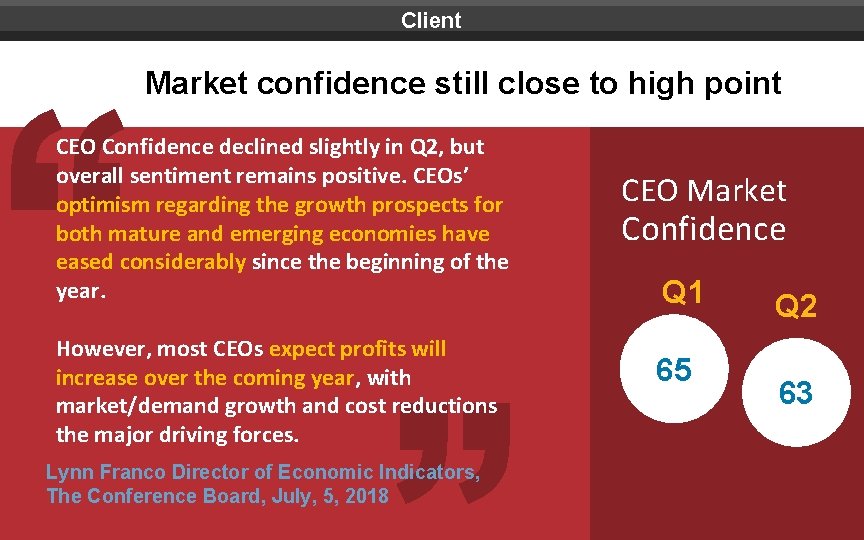
Client Market confidence still close to high point CEO Confidence declined slightly in Q 2, but overall sentiment remains positive. CEOs’ optimism regarding the growth prospects for both mature and emerging economies have eased considerably since the beginning of the year. However, most CEOs expect profits will increase over the coming year, with market/demand growth and cost reductions the major driving forces. Lynn Franco Director of Economic Indicators, The Conference Board, July, 5, 2018 CEO Market Confidence Q 1 65 Q 2 63
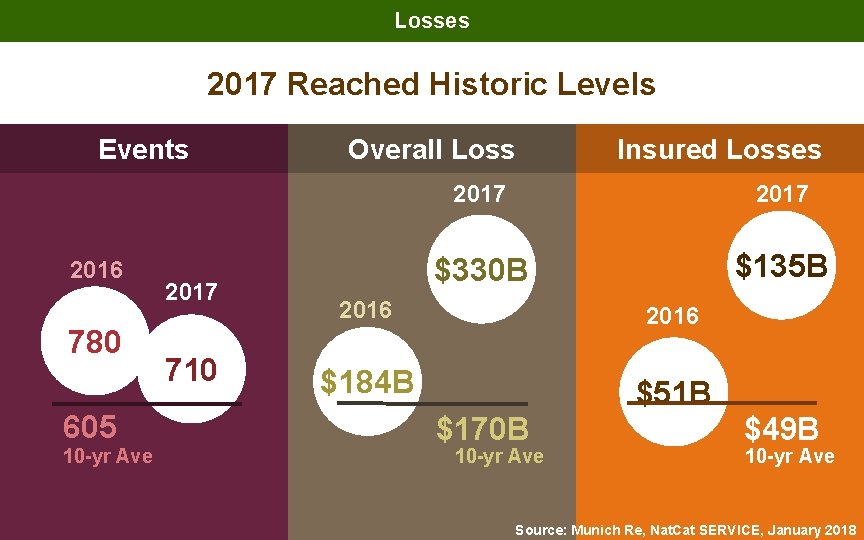
Losses 2017 Reached Historic Levels Events 2016 780 605 10 -yr Ave 2017 710 Overall Loss Insured Losses 2017 $330 B $135 B 2016 $184 B $51 B $170 B 10 -yr Ave $49 B 10 -yr Ave Source: Munich Re, Nat. Cat SERVICE, January 2018
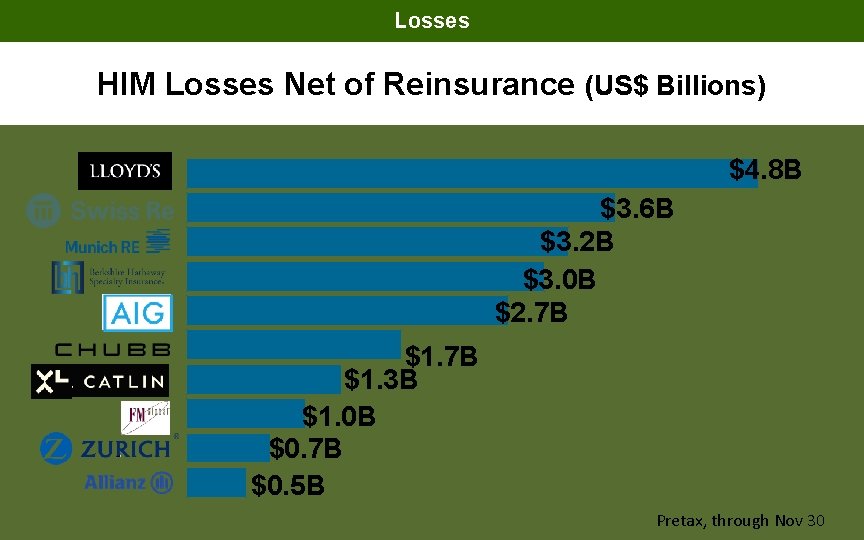
Losses HIM Losses Net of Reinsurance (US$ Billions) $4. 8 B $3. 6 B $3. 2 B $3. 0 B $2. 7 B $1. 3 B $1. 0 B $0. 7 B $0. 5 B Pretax, through Nov 30
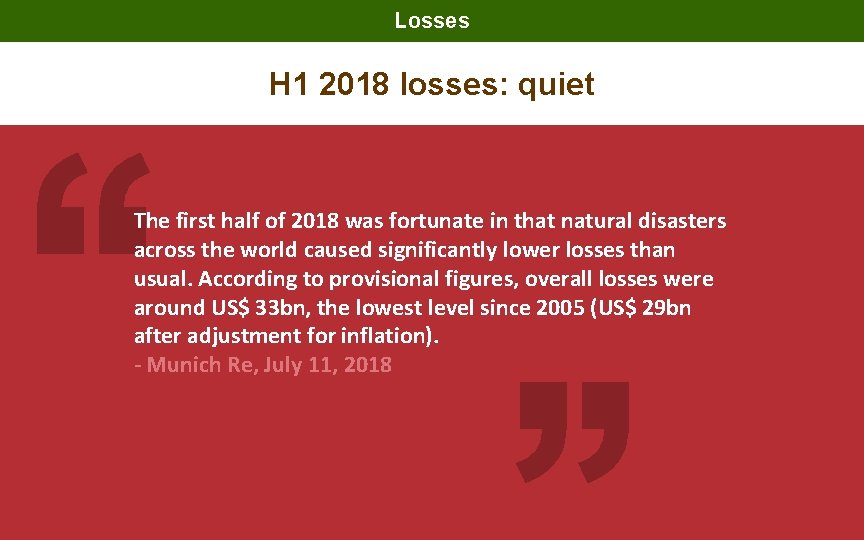
Losses H 1 2018 losses: quiet The first half of 2018 was fortunate in that natural disasters across the world caused significantly lower losses than usual. According to provisional figures, overall losses were around US$ 33 bn, the lowest level since 2005 (US$ 29 bn after adjustment for inflation). - Munich Re, July 11, 2018
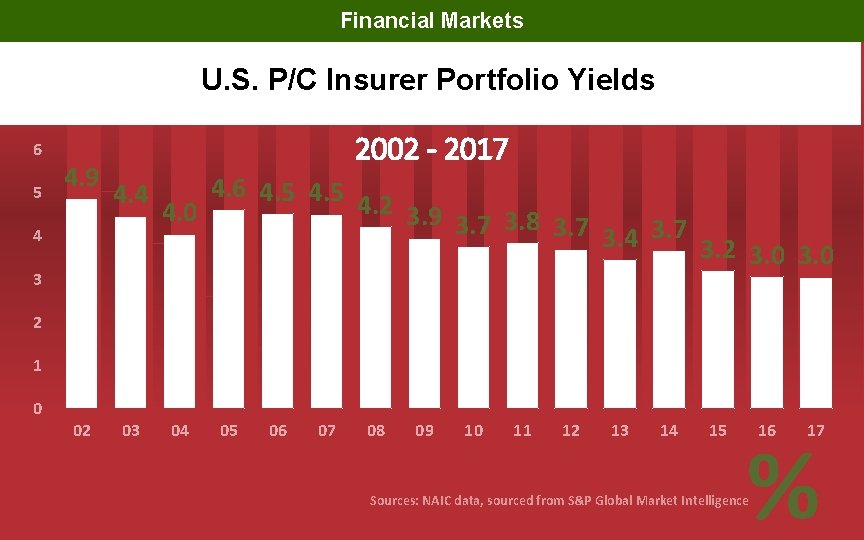
Financial Markets U. S. P/C Insurer Portfolio Yields 6 5 4. 9 2002 - 2017 4. 4 4 3 4. 6 4. 5 4. 2 3. 9 4. 0 3. 7 3. 8 3. 7 3. 4 3. 7 3. 2 3. 0 2 1 0 02 03 04 05 06 07 08 09 10 11 12 13 14 15 16 17 % Sources: NAIC data, sourced from S&P Global Market Intelligence
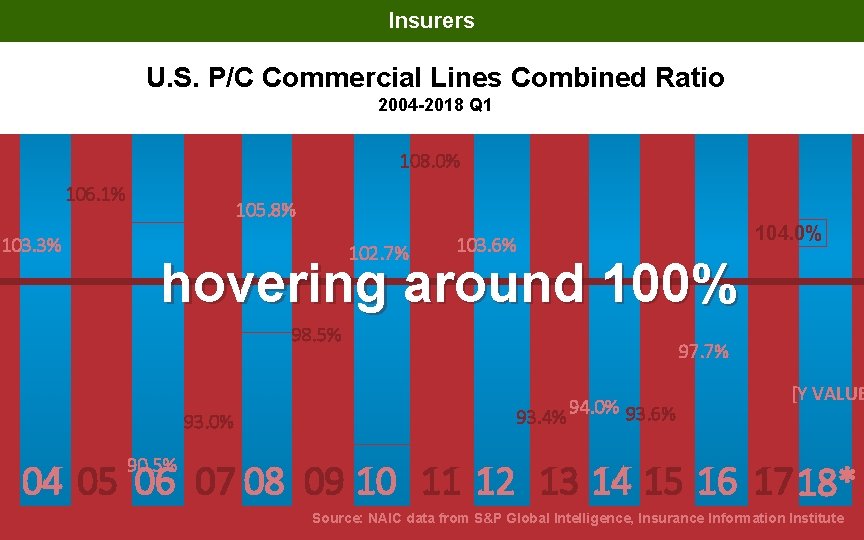
Insurers U. S. P/C Commercial Lines Combined Ratio 2004 -2018 Q 1 108. 0% 106. 1% 103. 3% 105. 8% 102. 7% 104. 0% 103. 6% hovering around 100% 98. 5% 93. 0% 97. 7% 94. 0% 93. 6% 93. 4% [Y VALUE 90. 5% 04 05 06 07 08 09 10 11 12 13 14 15 16 17 18* Source: NAIC data from S&P Global Intelligence, Insurance Information Institute
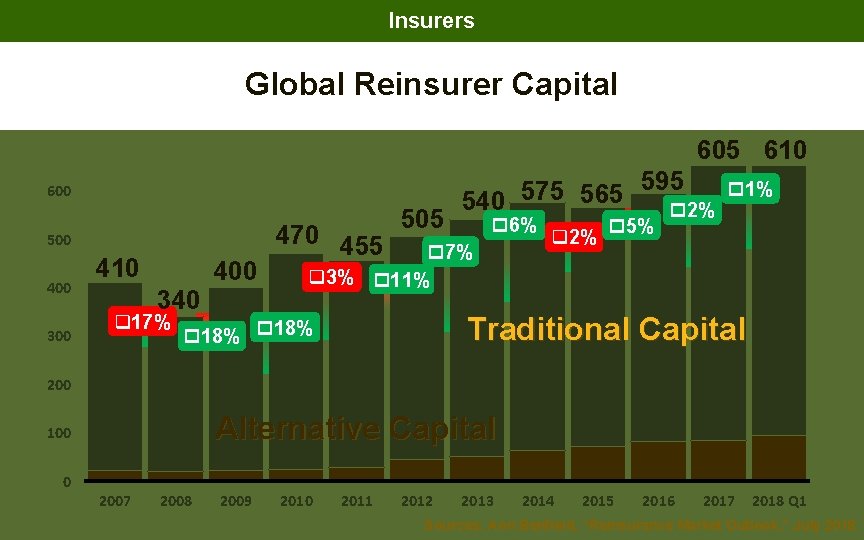
Insurers Global Reinsurer Capital 605 610 600 500 400 300 410 340 q 17% 400 470 455 505 595 575 565 540 p 2% p 6% p 7% q 3% p 11% q 2% p 1% p 5% Traditional Capital p 18% 200 Alternative Capital 100 0 2007 2008 2009 2010 2011 2012 2013 2014 2015 2016 2017 2018 Q 1 Sources: Aon Benfield, “Reinsurance Market Outlook, ” July 2018
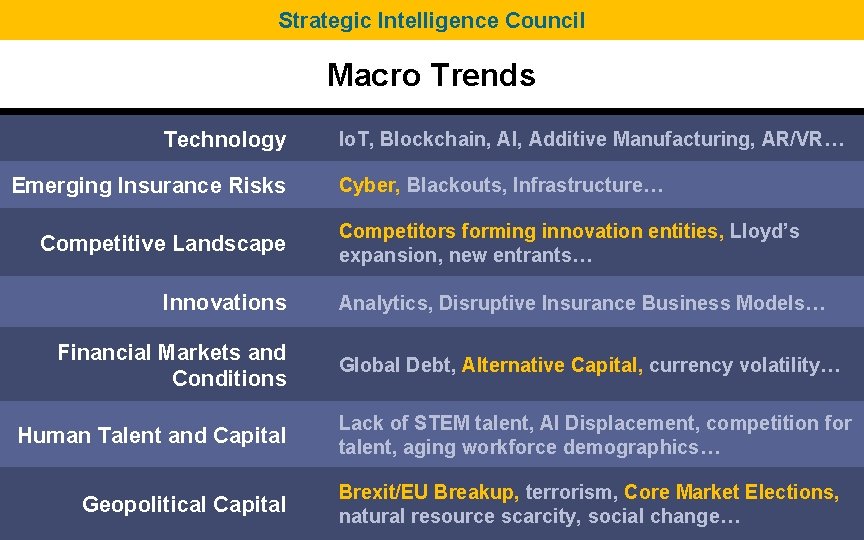
Strategic Intelligence Council Macro Trends Technology Emerging Insurance Risks Competitive Landscape Innovations Financial Markets and Conditions Human Talent and Capital Geopolitical Capital Io. T, Blockchain, AI, Additive Manufacturing, AR/VR… Cyber, Blackouts, Infrastructure… Competitors forming innovation entities, Lloyd’s expansion, new entrants… Analytics, Disruptive Insurance Business Models… Global Debt, Alternative Capital, currency volatility… Lack of STEM talent, AI Displacement, competition for talent, aging workforce demographics… Brexit/EU Breakup, terrorism, Core Market Elections, natural resource scarcity, social change…
2018 market environment § Optimism about economic growth § Lack of insured natural disasters § Abundant Capacity § Continued insurer weak earnings § Potential disruptions on the horizon § Downward pressure easing on pricing levels
2018 market environment: external perspective Despite upward rate pressure since 4 Q 2017 through 2 Q 2018, absent above average natural catastrophe losses for the second half of 2018 (e. g. , above average Windstorm losses), Aon anticipates that readily available capacity will begin to temper upward rate movement in the second half of 2018. - 2018 U. S. Property Market Dynamics – Q 2 2018 Update Peak zone Florida risk continues to dominate June and July treaty reinsurance renewals with strong trading also in United States nationwide and Australian property catastrophe risk. The risk transfer market continued to show a strong appetite for renewals in each of these regions, even on loss-affected accounts. . . ” - Aon Benfield Reinsurance Outlook, August 7, 2018
Take Control of Your Destiny HOW? § Prepare § Leverage analytics & advice § Assess program offerings on value § Organizations change – build resilience § Set reasonable expectations