
Summer 2007 COUPP Project Internship Using Bubble Chambers
Summer 2007 COUPP Project Internship Using Bubble Chambers for Dark Matter Detection
Overview • Introduction to Dark Matter Detection • Introduction to COUPP • Chicagoland Observatory for Underground Particle Physics (COUPP) • Data Analysis Review Project
Introduction to Dark Matter Detection What is dark matter? Why do we think it exists? How can we “see” dark matter? What are the current leading experiments?
What is Dark Matter? Dark Matter is one hypothesis explaining several cosmological challenges About 95% of the Universe’s mass and energy is invisible to us DM ≈ one third Dark Matter is matter that does not emit or reflect electromagnetic radiation Therefore, except for gravitational effects, it is functionally invisible
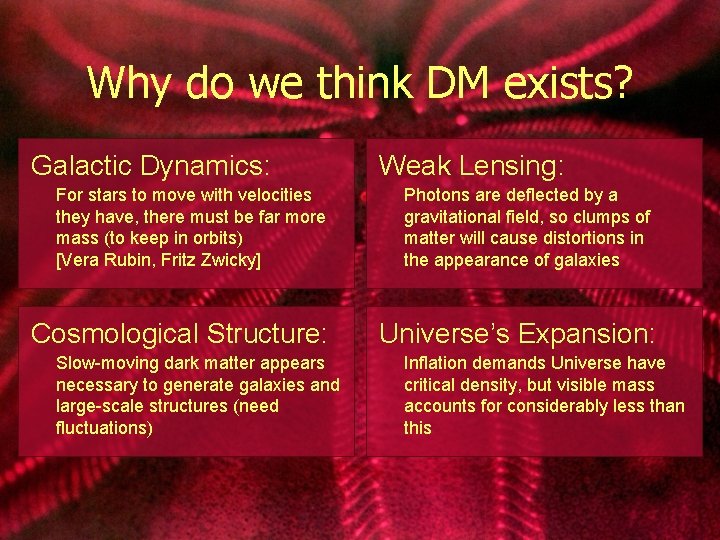
Why do we think DM exists? Galactic Dynamics: For stars to move with velocities they have, there must be far more mass (to keep in orbits) [Vera Rubin, Fritz Zwicky] Cosmological Structure: Slow-moving dark matter appears necessary to generate galaxies and large-scale structures (need fluctuations) Weak Lensing: Photons are deflected by a gravitational field, so clumps of matter will cause distortions in the appearance of galaxies Universe’s Expansion: Inflation demands Universe have critical density, but visible mass accounts for considerably less than this
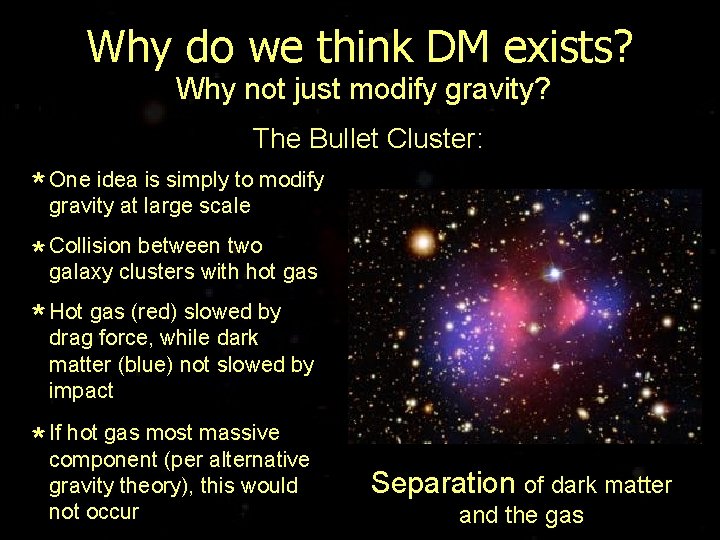
Why do we think DM exists? Why not just modify gravity? The Bullet Cluster: idea is simply to modify * One gravity at large scale between two * Collision galaxy clusters with hot gas (red) slowed by * Hot drag force, while dark matter (blue) not slowed by impact hot gas most massive * Ifcomponent (per alternative gravity theory), this would not occur Separation of dark matter and the gas
How can we detect dark matter? Indirect Detection We know WIMPs can collide with each other, producing neutrinos or gamma rays So look for neutrinos and gamma rays -- because WIMPs really high energy, look for Ge. V energy gamma rays and neutrinos Gamma rays produced as a factor of density squared -- look for high density of DM (center of galaxy) Direct Detection WIMPs can also collide with target nuclei Set up experiment to watch for WIMP collisions with target nuclei
What are the current leading experiments? (Direct Detection) CDMS Cryogenic Dark Matter Search To reduce noise : Very cold Bottom of Soudan Mine (neutrons produced from atmospheric muons) Look for ratio of: Phonons -- tiny increase in heat in single cold Germanium crystal Ionization Xenon 10 Phototubes in liquid Xenon Look for ratio of ionization to scintillation signal Surpassed CDMS early 2007

Introduction to COUPP Methods of Detection Design Advantages over Competitors
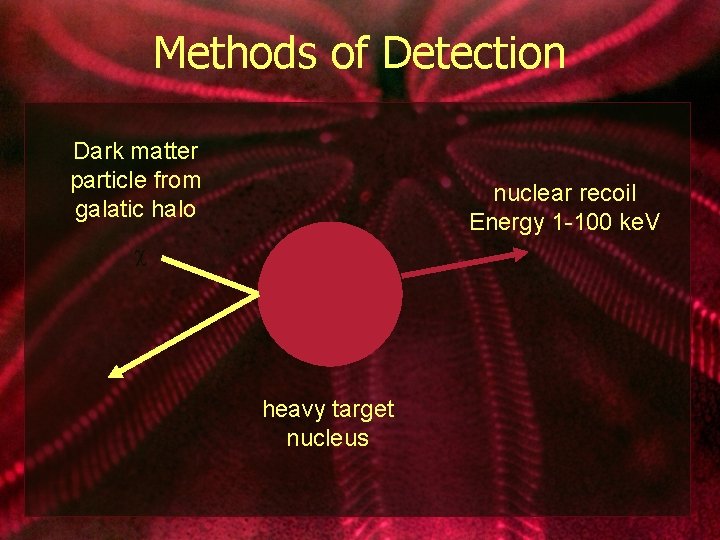
Methods of Detection Dark matter particle from galatic halo nuclear recoil Energy 1 -100 ke. V Heavy heavy target nucleus
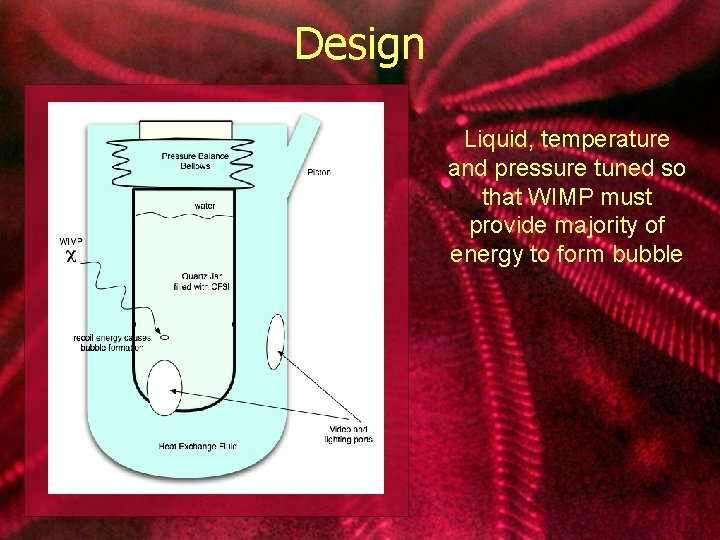
Design Liquid, temperature and pressure tuned so that WIMP must provide majority of energy to form bubble
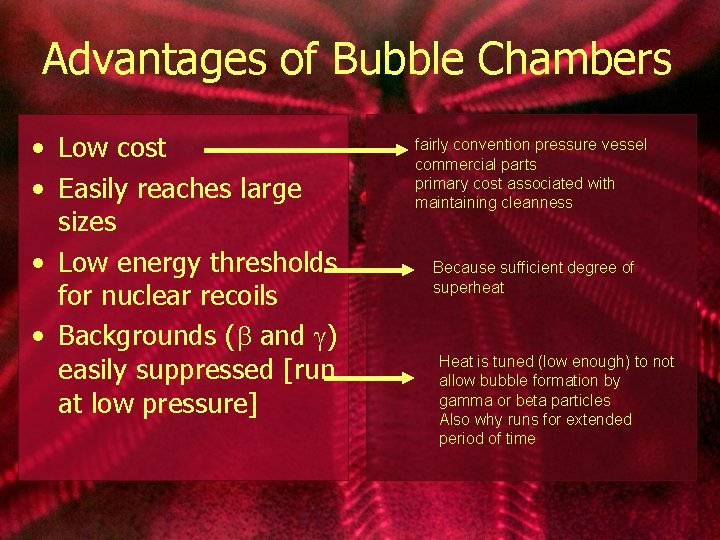
Advantages of Bubble Chambers • Low cost • Easily reaches large sizes • Low energy thresholds for nuclear recoils • Backgrounds ( and ) easily suppressed [run at low pressure] fairly convention pressure vessel commercial parts primary cost associated with maintaining cleanness Because sufficient degree of superheat Heat is tuned (low enough) to not allow bubble formation by gamma or beta particles Also why runs for extended period of time
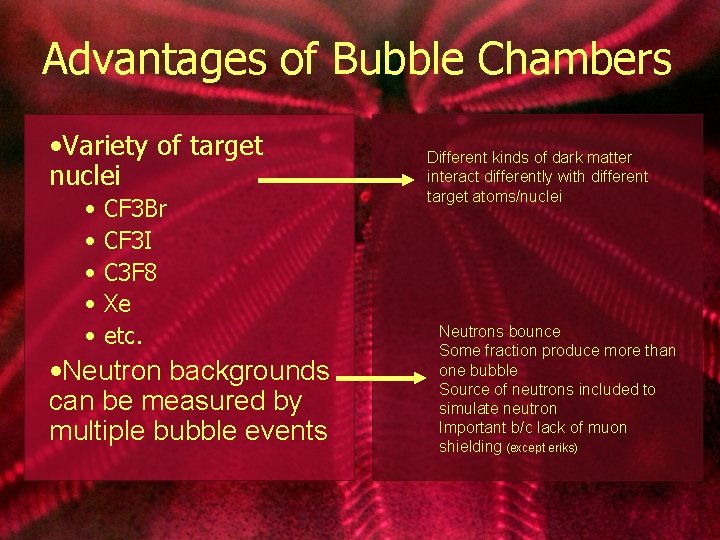
Advantages of Bubble Chambers • Variety of target nuclei • • • CF 3 Br CF 3 I C 3 F 8 Xe etc. • Neutron backgrounds can be measured by multiple bubble events Different kinds of dark matter interact differently with different target atoms/nuclei Neutrons bounce Some fraction produce more than one bubble Source of neutrons included to simulate neutron Important b/c lack of muon shielding (except eriks)
Data Analysis Review Project Problem Method of Assessment Results
Problem The bubble chamber is contaminated with Radon. This results in a significant background count. With what accuracy does the current method of data analysis report the radon levels in the bubble chamber? Method of Assessment 1) Develop Monte Carlo to simulate the real data 2) Analyze MC data using the project’s data analysis methods (Maximum Likelihood method of fit) 3) Determine the fraction of bubble counts that data analysis would attribute to Radon 4) Compare the data analysis fraction to the fraction actually input into the Monte Carlo
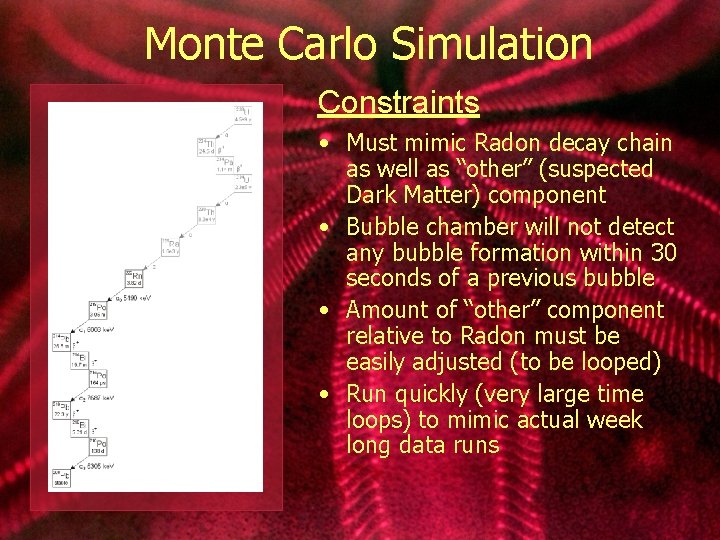
Monte Carlo Simulation Constraints • Must mimic Radon decay chain as well as “other” (suspected Dark Matter) component • Bubble chamber will not detect any bubble formation within 30 seconds of a previous bubble • Amount of “other” component relative to Radon must be easily adjusted (to be looped) • Run quickly (very large time loops) to mimic actual week long data runs
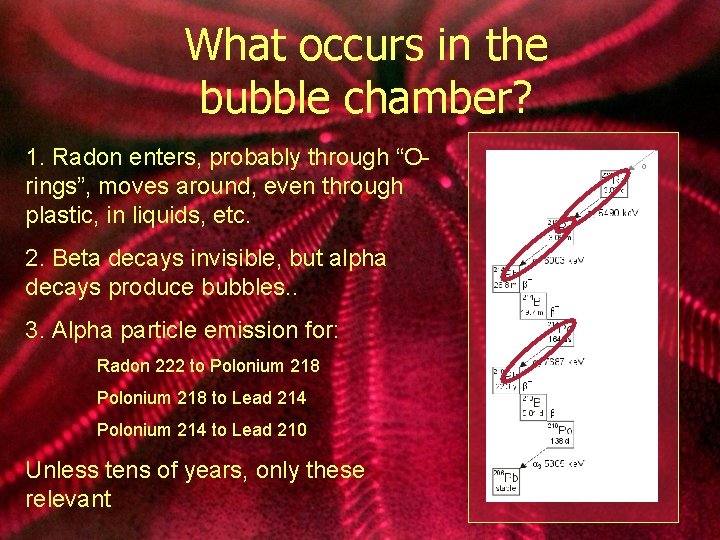
What occurs in the bubble chamber? 1. Radon enters, probably through “Orings”, moves around, even through plastic, in liquids, etc. 2. Beta decays invisible, but alpha decays produce bubbles. . 3. Alpha particle emission for: Radon 222 to Polonium 218 to Lead 214 Polonium 214 to Lead 210 Unless tens of years, only these relevant
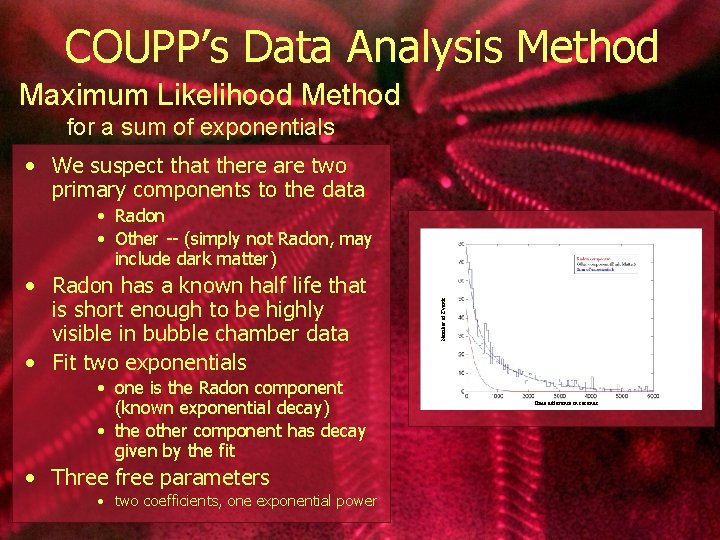
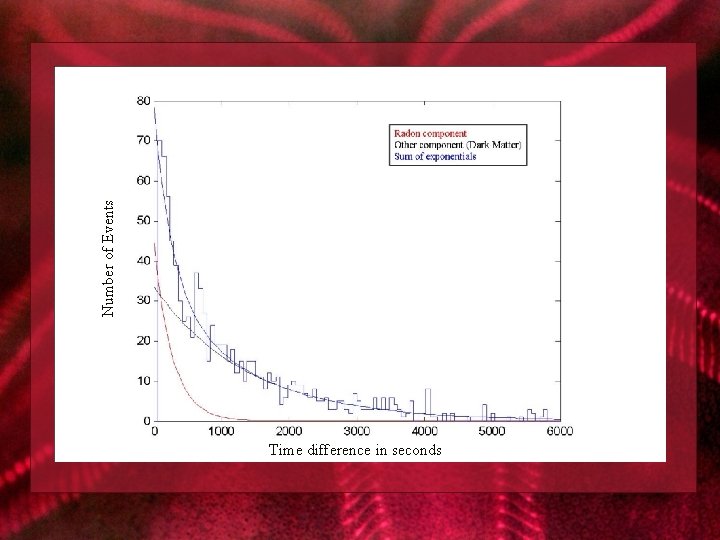
COUPP’s Data Analysis Method Maximum Likelihood Method for a sum of exponentials • We suspect that there are two primary components to the data • Radon has a known half life that is short enough to be highly visible in bubble chamber data • Fit two exponentials • one is the Radon component (known exponential decay) • the other component has decay given by the fit • Three free parameters • two coefficients, one exponential power Number of Events • Radon • Other -- (simply not Radon, may include dark matter) Time difference in seconds
Number of Events Time difference in seconds
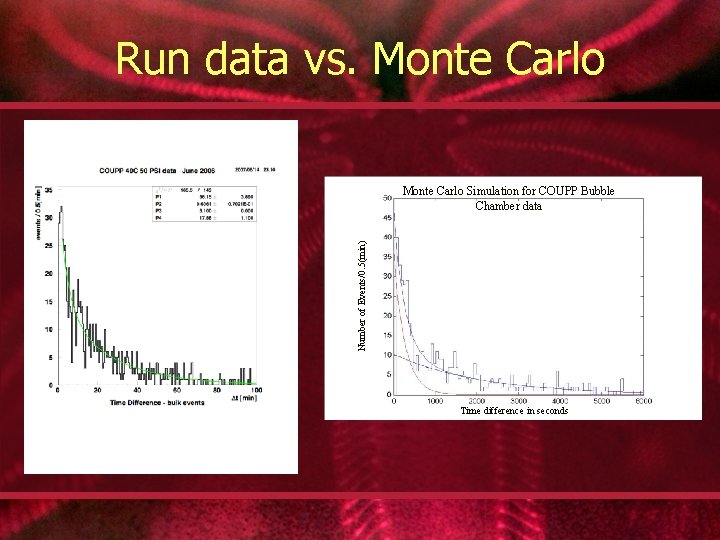
Run data vs. Monte Carlo Number of Events/0. 5(min) Monte Carlo Simulation for COUPP Bubble Chamber data Time difference in seconds
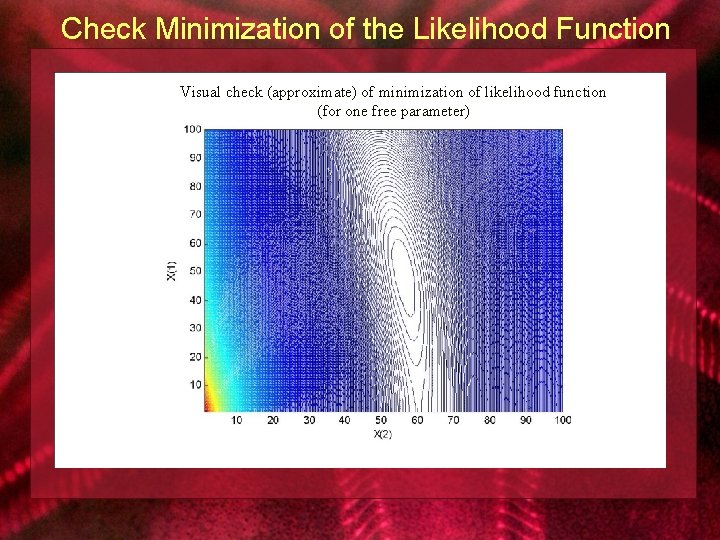
Check Minimization of the Likelihood Function Visual check (approximate) of minimization of likelihood function (for one free parameter)
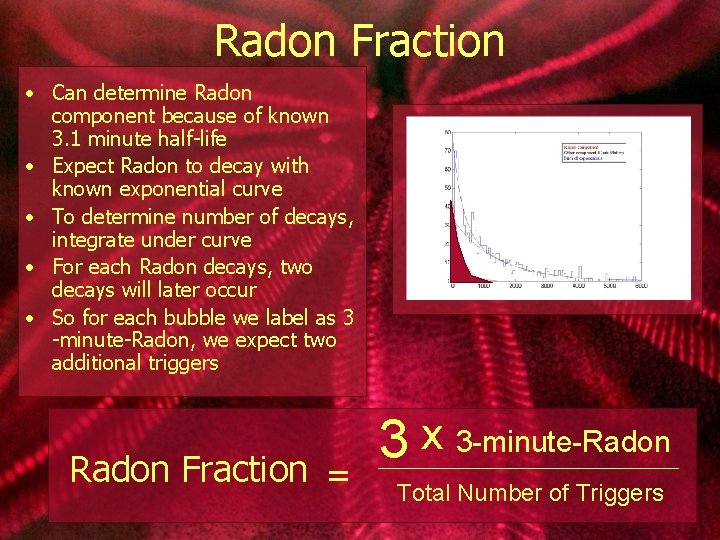
Radon Fraction • Can determine Radon component because of known 3. 1 minute half-life • Expect Radon to decay with known exponential curve • To determine number of decays, integrate under curve • For each Radon decays, two decays will later occur • So for each bubble we label as 3 -minute-Radon, we expect two additional triggers Radon Fraction = 3 x 3 -minute-Radon Total Number of Triggers
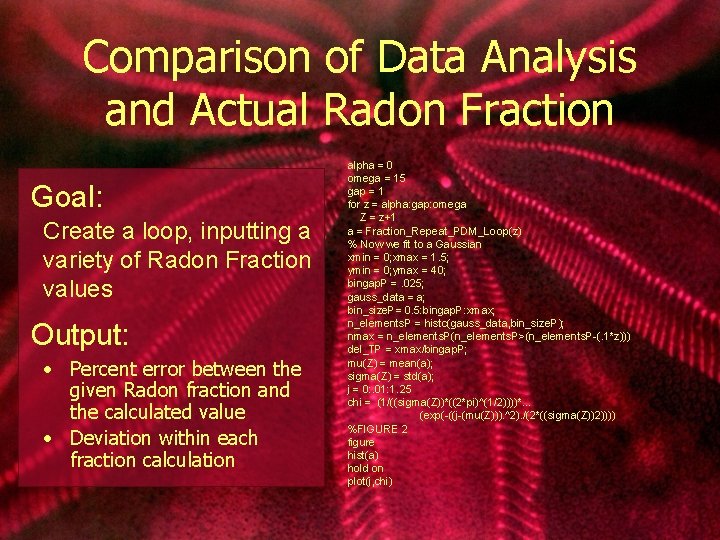
Comparison of Data Analysis and Actual Radon Fraction Goal: Create a loop, inputting a variety of Radon Fraction values Output: • Percent error between the given Radon fraction and the calculated value • Deviation within each fraction calculation alpha = 0 omega = 15 gap = 1 for z = alpha: gap: omega Z = z+1 a = Fraction_Repeat_PDM_Loop(z) % Now we fit to a Gaussian xmin = 0; xmax = 1. 5; ymin = 0; ymax = 40; bingap. P =. 025; gauss_data = a; bin_size. P= 0. 5: bingap. P: xmax; n_elements. P = histc(gauss_data, bin_size. P); nmax = n_elements. P(n_elements. P>(n_elements. P-(. 1*z))) del_TP = xmax/bingap. P; mu(Z) = mean(a); sigma(Z) = std(a); j = 0: . 01: 1. 25 chi = (1/((sigma(Z))*((2*pi)^(1/2))))*… (exp(-((j-(mu(Z))). ^2). /(2*((sigma(Z))2)))) %FIGURE 2 figure hist(a) hold on plot(j, chi)
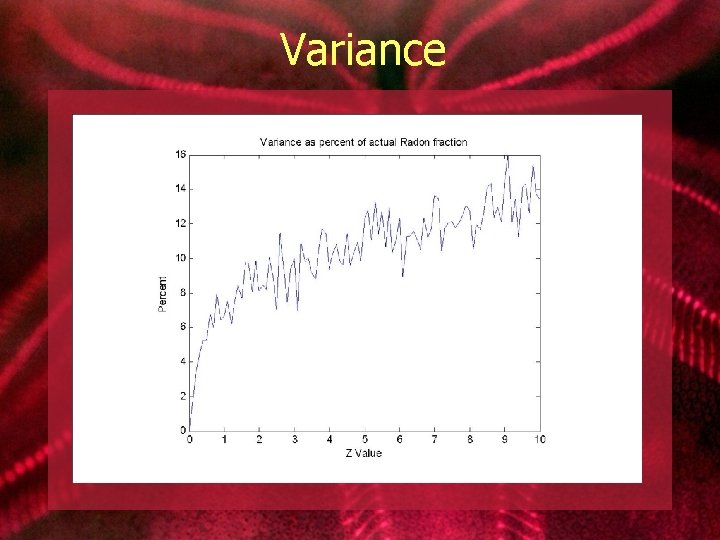
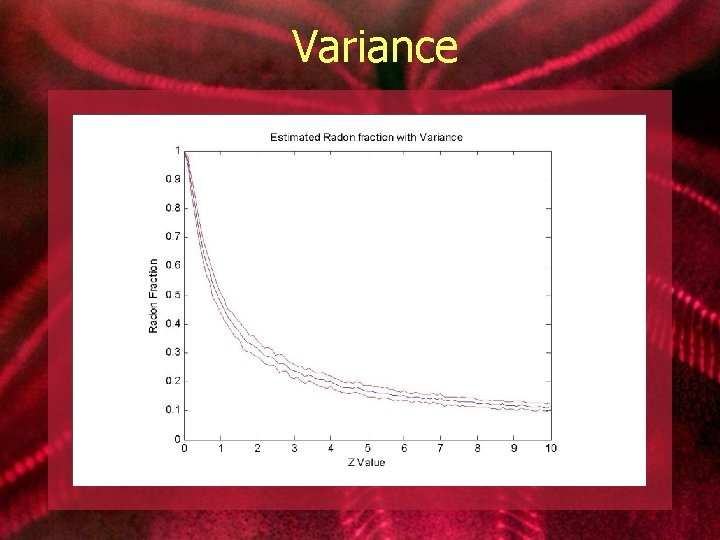
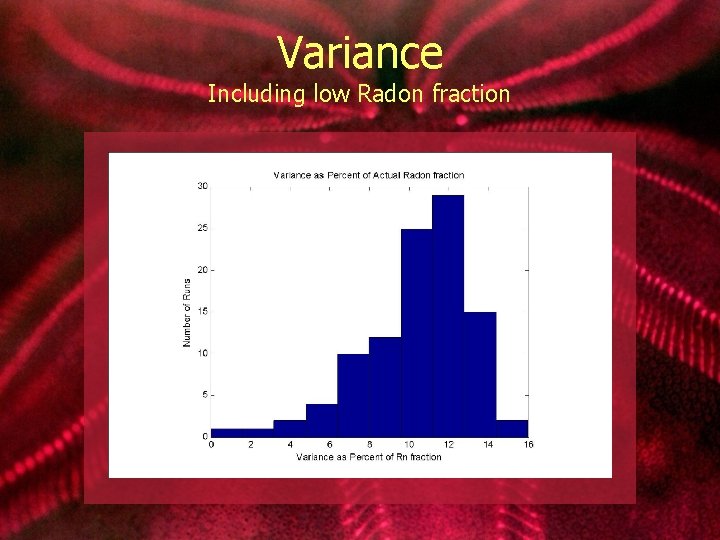
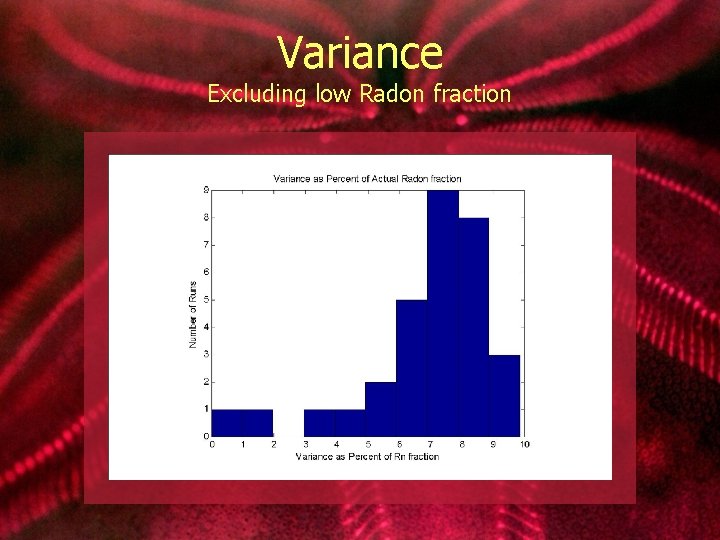
Results Mean value of Radon fraction calculated by the analysis is fairly accurate for high Radon fractions -- for low values, problematic Variance, Variance however, can be quite large, large with values often at seven to eight percent of the actual Radon fraction (for high Rn fractions) Analysis underestimates for low Radon fraction values and overestimates for higher Radon fraction values
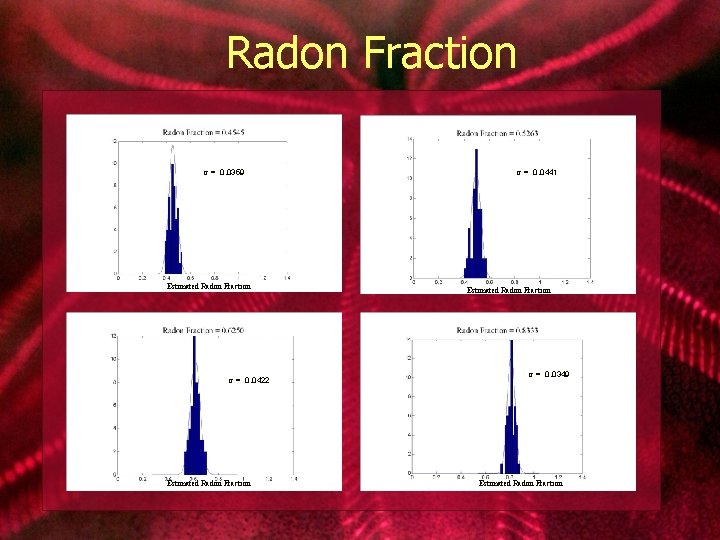
Radon Fraction = 0. 0359 Estimated Radon Fraction = 0. 0422 Estimated Radon Fraction = 0. 0441 Estimated Radon Fraction = 0. 0349 Estimated Radon Fraction
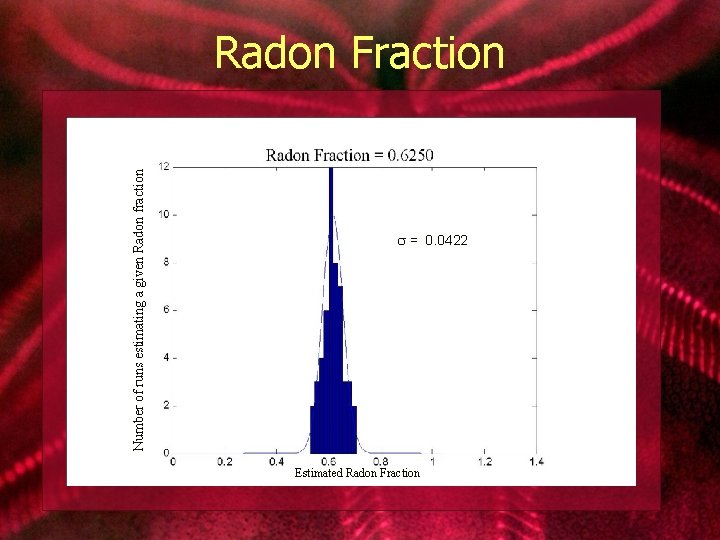
Number of runs estimating a given Radon fraction Radon Fraction = 0. 0422 Estimated Radon Fraction
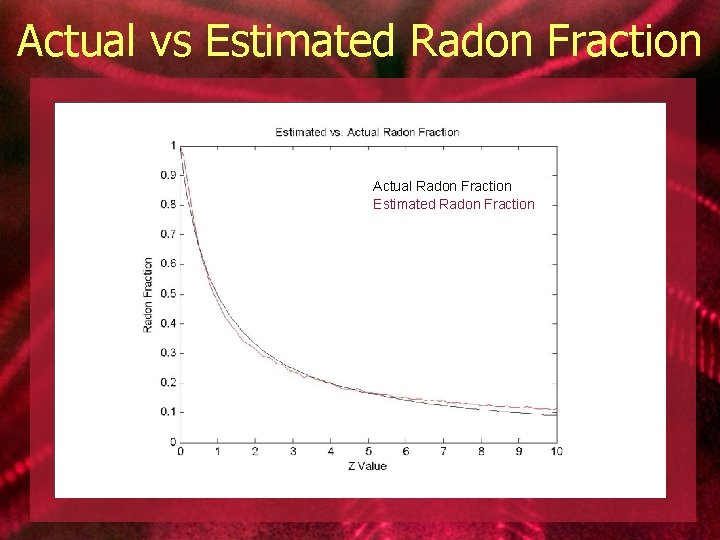
Actual vs Estimated Radon Fraction Actual Radon Fraction Estimated Radon Fraction
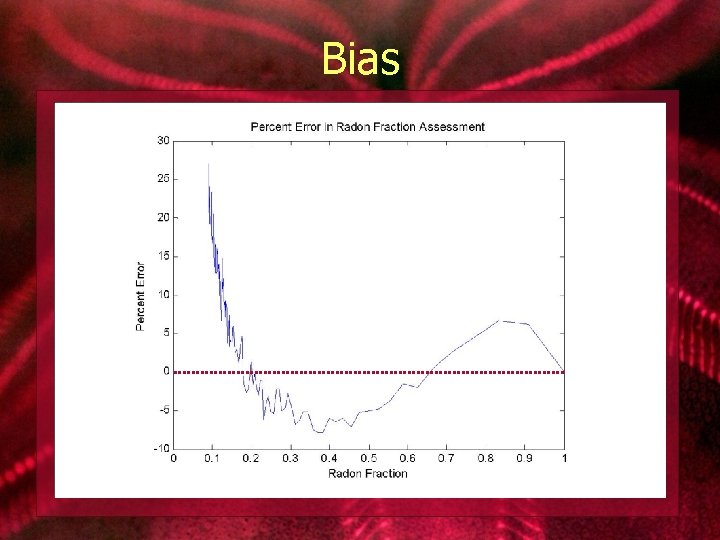
Bias
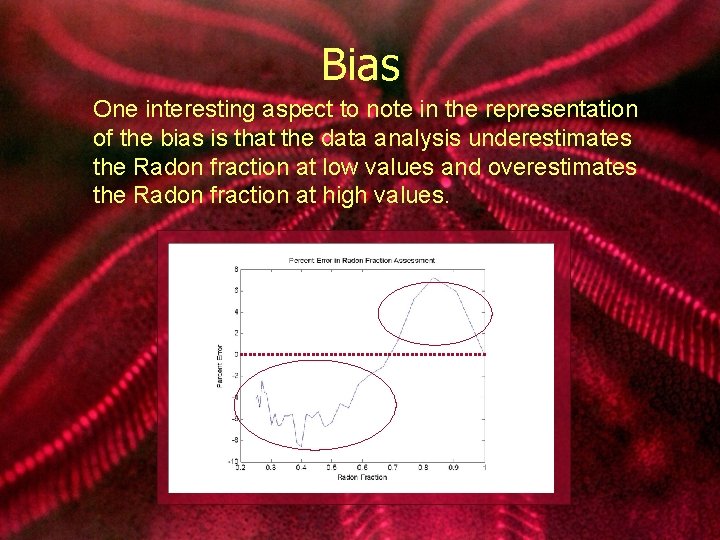
Bias One interesting aspect to note in the representation of the bias is that the data analysis underestimates the Radon fraction at low values and overestimates the Radon fraction at high values.
Variance
Variance
Variance Including low Radon fraction
Variance Excluding low Radon fraction
Conclusions Analysis method has sufficient accuracy, but is dependent on the Radon fraction Low Rn fraction unlikely, given actual data, so accuracy good Considerable variance in individual runs from the mean, so experiment must conduct many runs, to ensure that an accurate mean is determined
Questions
- Slides: 35