Summary Statistics Center Spread Range Mean and Median

 and Measures of Spread/Variation (such as")


 What is the")
 Find the area")


")
")

 - The range of the middle half of the data; the")


 of this data set is: 13. 1 So")


 Which of the")
 Use the calculator")

 Is the distribution")
 Make a box")
 Why is the")
 Which distribution is")
 Looking at the")
 i. Does the")
- Slides: 41
Summary Statistics, Center, Spread, Range, Mean, and Median Ms. Daniels Integrated Math 1
Summary Statistics Measures of Center (mean and median) and Measures of Spread/Variation (such as range, IQR, SD) are called summary statistics because they help to summarize the information in a distribution or data set.
Spread • The spread of data is how “spread out” the data is or how close together. We use range, Interquartile Range (IQR), and Standard Deviation to measure the spread of a data set. • Today we will just talk about RANGE. (We will talk about IQR and SD in the coming days).
Range • Ex 1: 22, 26, 15, 34, 35, 19, 24 Range = 35 – 15 Range = 20
Center • The two most widely used measures of the "center" of the data are the mean (average) and the median. • The median is generally a better measure of the center when there are extreme values or outliers because it is not affected by the precise numerical values of the outliers. • The mean is the most common measure of the center.
Mean • Mean- The sum of the data divided by the number of items in the data set. Ex 1: 22, 26, 15, 34, 35, 19, 24 22+26+15+34+35+19+24 = 175 This is most useful when the data has no extreme values.
Median- the middle number of the data ordered from least to greatest, or the mean of the middle two numbers. Ex 1: Ex 2: 12, 42, 17, 25, 36, 28, 20 12, 17, 20, 25, 28, 36, 42 3, 5, 6, 9, 13, 16 This is most useful when the data has extreme values and there are no big gaps in the middle of the data.
Unit 1 Lesson 1 Inv. 2 pg. 85 #3 a. ) What is the position of the median when there are 40 values? Find the median of this set of values. Locate the median on the horizontal axis of the histogram. There are 40 values, so the median occurs at position (40 +1) / 2, OR halfway between the 20 th and 21 st values, which are 4 and 5. The median is 4. 5 and is located on the boundary between the 4 bar and the 5 bar.
Unit 1 Lesson 1 Inv. 2 pg. 85 #3 b. ) Find the area of the bars to the left of the median. Find the area of the bars to the right of the median. How can you use area to estimate the median from a histogram? The area of the bars to the left of median is 20. The area of the bars to the right of median is 20. Estimate the value that divides the total area of the bars in half. (Note- doesn’t work this way- doesn’t always have two equal halves. )
Unit 1 Lesson 1 Inv. 2 pg. 85 #4 Students may think in terms of frequency bars. More than half of the data are on the left of the hand, so the median is to the left of the hand. Alternatively, the total area of the bars to the left of the hand is greater than the total area of the bars to the right of the hand, so the median is to the left of the hand.
Boxplots, IQR, Range, Outliers, Minimum/ Maximum
Measure of Variation/Variability • Used to describe the distribution of the data; similar to spread;
Box and Whisker Plots Box plots are most useful when the distribution is skewed or has outliers or if you want to compare two or more distributions or sets of data.
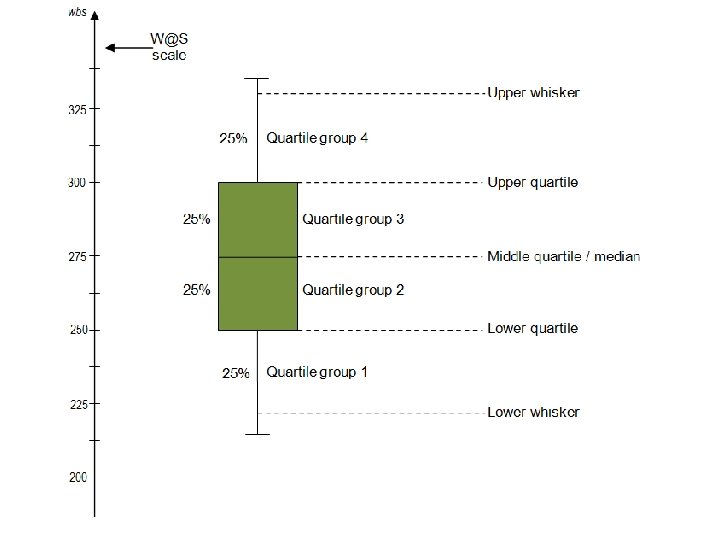
Quartiles values that divide the data into four equal parts, each representing 25% of the data.
Lower Quartile The median of the lower half of a set of data. (LQ) -(25% of the data is below this number and 75% of the data is above this number)
Upper Quartile The median of the upper half of a set of data. (UQ) -(25% of the data is above this number, 75% of the data is below this number)
Range • Ex 1: 22, 26, 15, 34, 35, 19, 24 Range = 35 – 15 Range = 20
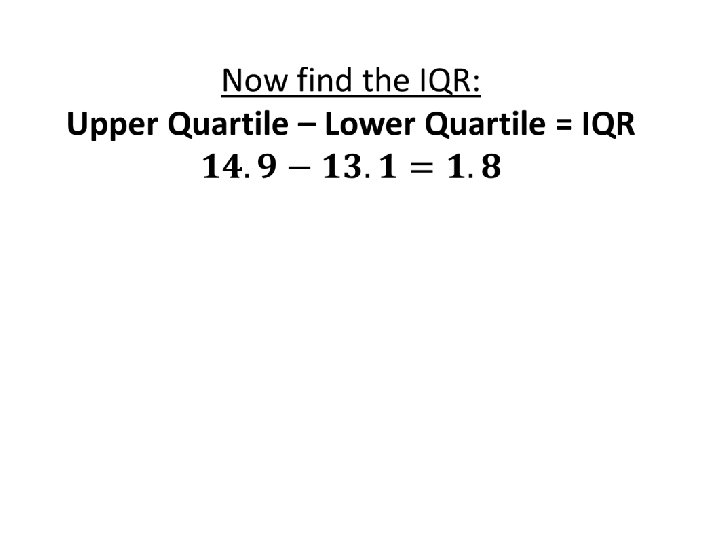
Interquartile Range (IQR) - The range of the middle half of the data; the difference between the upper quartile and lower quartile. (IQR) Upper Quartile – Lower Quartile = IQR
Minimum Value - The smallest value in the data set. Maximum Value - The largest value in the data set. Example: 4, 7, 9, 14, 17, 26, 31, 42 Minimum Maximum
Standard Deviation Standard deviation is a distance that is used to describe the variability in a distribution. http: //www. mathsisfun. com/data/standard-deviation. html
Standard Deviation pt. 2 http: //www. mathsisfun. com/data/standard-deviation-formulas. html
How to find SD in your Calc: First, enter your sets of data into L 1, L 2, or both. STAT ENTER Once you’ve entered your data we need to calculate the summary statistics, or the “ 1 -Variable Statistics. ” STAT ENTER Arrow to the right to highlight “CALC” 2 nd 2 Then arrow down to “Calculate” and press “Sx” (circled in red) is the standard deviation we will use at this level. ENTER
Standard Deviation Practice
So the Lower Quartile (LQ) of this data set is: 13. 1 So the Upper Quartile (UQ) of this data set is: 14. 9
Your Turn!
Your Turn Again!
Extra Practice!
Unit 2: Lesson 2: Inv. 1: pg. 106 #6 Find 5# summary & Box Plot info with Calculator. (including SD)
Unit 2: Lesson 2: Inv. 1: pg. 106 #6 a. ) Which of the students has greater variability in his or her grades? Jack’s grades are more spread out. His grades vary from 4 through 10, while Susan’s grades only vary from 6 through 10. But aside from looking at just the extreme values, most of the grades for Jack are away from the center of his distribution, while those for Susan tend to be lumped in the middle.
Unit 2: Lesson 2: Inv. 1: pg. 106 #6 B-C. ) Use the calculator to find the median, Upper and Lower Quartiles for Jack’s and Susan’s grades. Susan: Jack: LQ: 7. 5 Med: 8 UQ: 8. 5 LQ: 5 Med: 7 UQ: 8
Unit 2: Lesson 2: Inv. 2: pg. 109 #2 Use calculator to find range and IQR for following set of data. 1, 2 , 3, 4, 5, 6, 70 a. ) Remove the outlier 70. Find range & IQR of data. What changed more? b. ) Which is more resistant to outliers? Why? c. ) Why is the interquartile range more informative than the range as a measure of variability?
Unit 2: Lesson 2: Inv. 2: pg. 109 #3 a. ) Is the distribution skewed to the left or to the right, or is it symmetric? Explain.
Unit 2: Lesson 2: Inv. 2: pg. 110 #4 a. ) Make a box plot for Susan’s homework grades. b. ) Why do the plots for Maria and Tran have no whiskers at the upper end?
Unit 2: Lesson 2: Inv. 2: pg. 110 #4 c. ) Why is the lower whisker on Gia’s box plot so long? Does this mean there are more grades for Gia in that whisker than in the shorter whisker?
Unit 2: Lesson 2: Inv. 2: pg. 110 #4 d. ) Which distribution is the most symmetric? Which distributions are skewed to the left?
Unit 2: Lesson 2: Inv. 2: pg. 110 #4 e. ) Looking at the box plots, which of the 5 students has the lowest median grade?
Unit 2: Lesson 2: Inv. 2: pg. 110 #4 f. ) i. Does the student with the smallest IQR also have the smallest range? ii. Does the student with the largest IQR also have the largest range?