
Summary of Findings tables in Cochrane reviews Lets
Summary of Findings tables in Cochrane reviews Let’s do it right Esther van Zuuren Department of Dermatology LEIDEN
Agenda Introduction (20 -25 min) • What is GRADE? • Where can we find information on GRADE • GRADE approach • Rating quality of the evidence • Factors that decrease quality of evidence • Factors that increase quality of evidence Workshop • Working in two –three groups (40 min) • Discussion within whole group and working all with GRADEpro. GDT (20 -25 min) 2 05 -dec-20
What is ? Grading of Recommendations, Assessment, Development and Evaluation Systematic and explicit approach to making judgements about quality of evidence and strength of recommendations Quality of evidence rating includes reporting on: ‒ Methodological flaws ‒ Consistency of results ‒ Generalizability ‒ Magnitude of effect is used by WHO, Cochrane, NICE and >70 other organizations for guideline making 3 05 -dec-20

GRADE – getting information http: //www. gradeworkinggroup. org/ 4 05 -dec-20
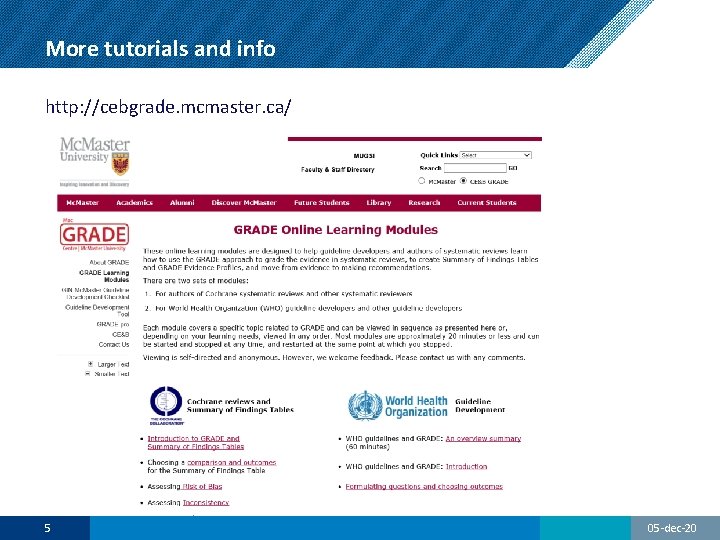
More tutorials and info http: //cebgrade. mcmaster. ca/ 5 05 -dec-20
What is ? = ? = ? 6 ? 05 -dec-20
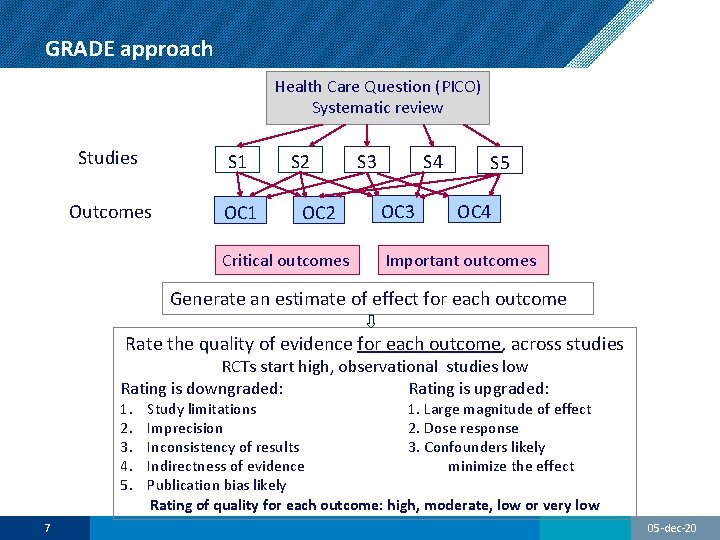
GRADE approach Health Care Question (PICO) Systematic review Studies S 1 Outcomes OC 1 S 2 OC 2 Critical outcomes S 4 S 3 OC 3 S 5 OC 4 Important outcomes Generate an estimate of effect for each outcome Rate the quality of evidence for each outcome, across studies RCTs start high, observational studies low Rating is downgraded: Rating is upgraded: 1. 2. 3. 4. 5. 7 Study limitations 1. Large magnitude of effect Imprecision 2. Dose response Inconsistency of results 3. Confounders likely Indirectness of evidence minimize the effect Publication bias likely Rating of quality for each outcome: high, moderate, low or very low 05 -dec-20
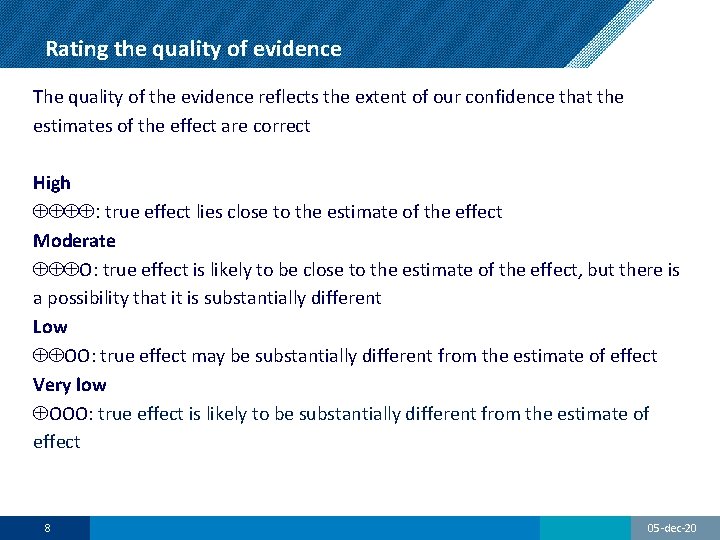
Rating the quality of evidence The quality of the evidence reflects the extent of our confidence that the estimates of the effect are correct High ÅÅÅÅ: true effect lies close to the estimate of the effect Moderate ÅÅÅO: true effect is likely to be close to the estimate of the effect, but there is a possibility that it is substantially different Low ÅÅOO: true effect may be substantially different from the estimate of effect Very low ÅOOO: true effect is likely to be substantially different from the estimate of effect 8 05 -dec-20
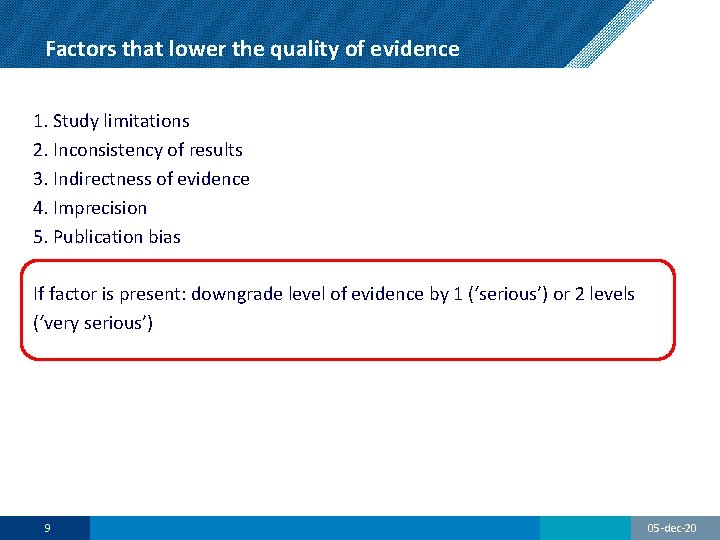
Factors that lower the quality of evidence 1. Study limitations 2. Inconsistency of results 3. Indirectness of evidence 4. Imprecision 5. Publication bias If factor is present: downgrade level of evidence by 1 (‘serious’) or 2 levels (‘very serious’) 9 05 -dec-20
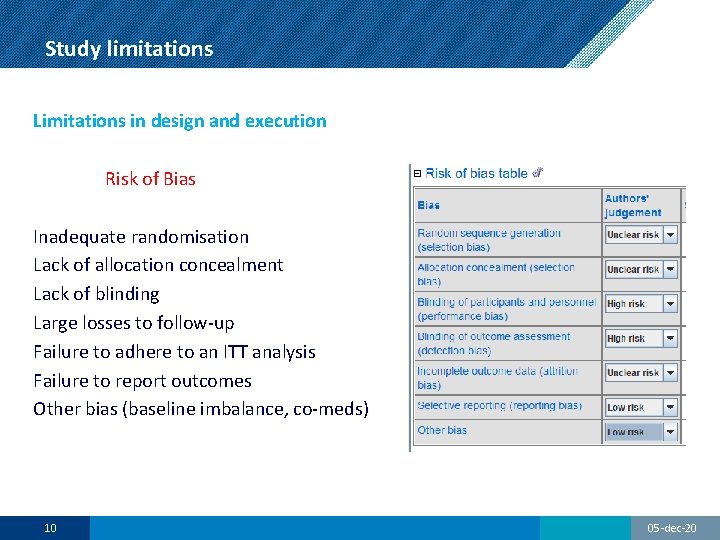
Study limitations Limitations in design and execution Risk of Bias Inadequate randomisation Lack of allocation concealment Lack of blinding Large losses to follow-up Failure to adhere to an ITT analysis Failure to report outcomes Other bias (baseline imbalance, co-meds) 10 05 -dec-20
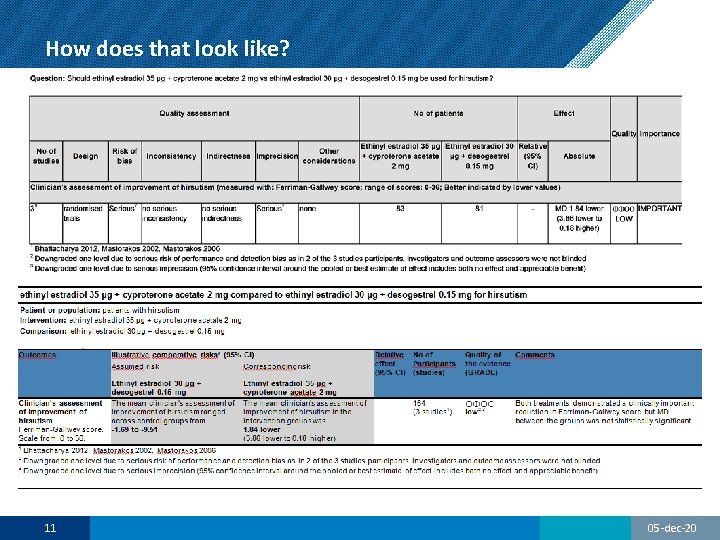
How does that look like? 11 05 -dec-20
Inconsistency in results Unexplained heterogeneity of results across studies 1) Clinical heterogeneity may arise from differences in: Populations different effect in populations with more disease severity Interventions larger effect with higher doses or longer treatment duration Outcomes diminishing effect with time (duration in follow-up differ) 2) Methodological heterogeneity (differences in study design or differences in risk of bias) 12 05 -dec-20
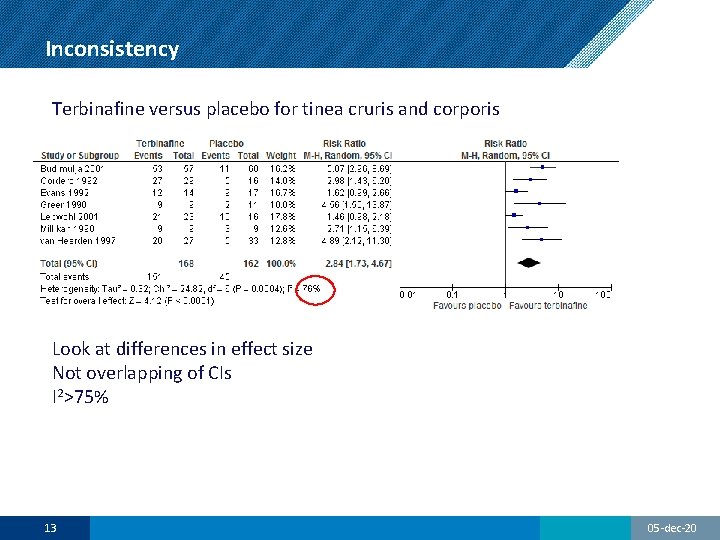
Inconsistency Terbinafine versus placebo for tinea cruris and corporis Look at differences in effect size Not overlapping of CIs I 2>75% 13 05 -dec-20
Indirectness Evidence comes from different research question Indirect comparison: terbinafine – miconazole terbinafine – placebo and miconazole – placebo Population: oral fumaric acid esters for psoriasis psoriatic arthritis Comparator: new drug – different dosages isotretinoin fixed doses of isotretinoin Outcome: patient satisfaction or aesthetics (treatment varicose) ultrasound 14 05 -dec-20
Imprecision When are results precise enough? Consider: Sample size -calculation of optimal information size (OIS) http: //cebgrade. mcmaster. ca/Imprecision/index. html calculator at http: //www. stat. ubc. ca/~rollin/stats/ssize/b 2. html Number of events -rule of thumbs rating down < 300 events in total group Wide confidence intervals -uncertainty about the magnitude of effect -CI includes both no effect AND appreciable benefit/harm (RR 0. 75/1. 25) 15 05 -dec-20
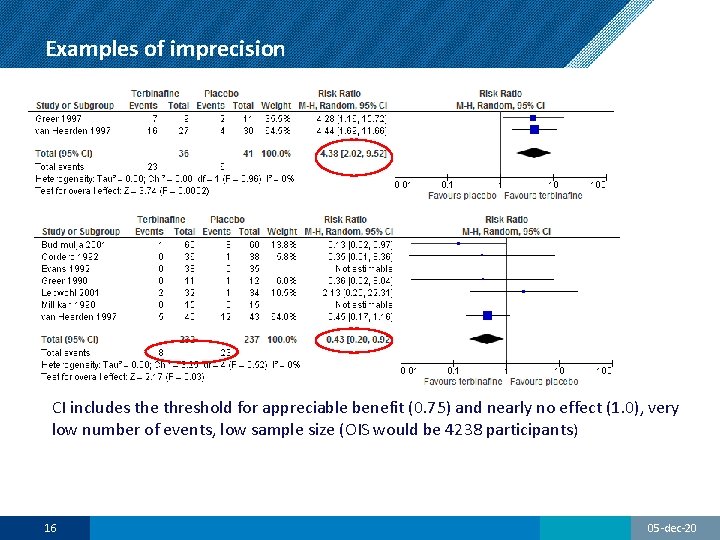
Examples of imprecision CI includes the threshold for appreciable benefit (0. 75) and nearly no effect (1. 0), very low number of events, low sample size (OIS would be 4238 participants) 16 05 -dec-20
Publication bias Systematic under- or overestimate of the effect due to selective publication of studies Trials including large numbers of patients are less likely to remain unpublished or ignored and tend to provide more precise estimates of the effect whether positive or negative Suspicion: evidence is limited to small number of trials, all showing benefit and funded by industry Check: funnel plot, trial registers, abstract books Publication bias: ‘undetected’ (no change in quality) ‘strongly suspected’(downgrade by 1 level) ‘very strongly suspected’ (downgrade by 2 levels) 17 05 -dec-20
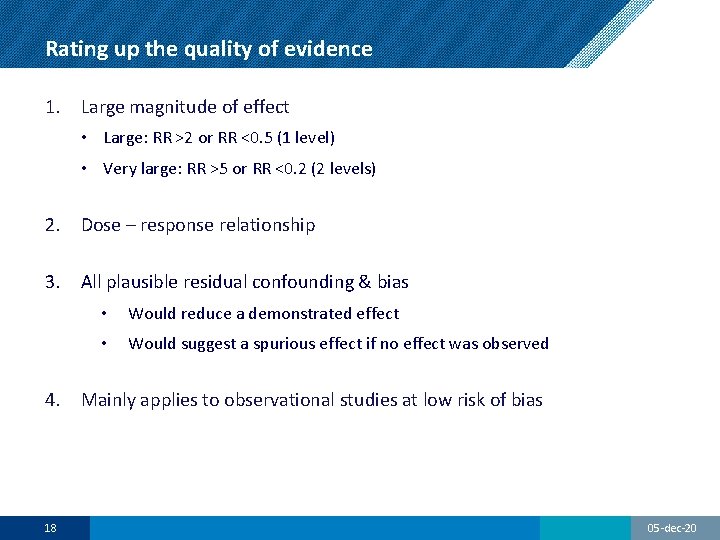
Rating up the quality of evidence 1. Large magnitude of effect • Large: RR >2 or RR <0. 5 (1 level) • Very large: RR >5 or RR <0. 2 (2 levels) 2. Dose – response relationship 3. All plausible residual confounding & bias • Would reduce a demonstrated effect • Would suggest a spurious effect if no effect was observed 4. Mainly applies to observational studies at low risk of bias 18 05 -dec-20
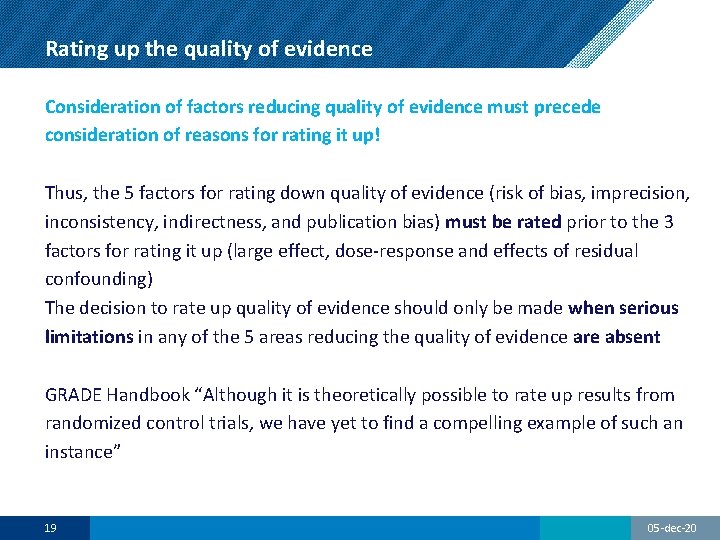
Rating up the quality of evidence Consideration of factors reducing quality of evidence must precede consideration of reasons for rating it up! Thus, the 5 factors for rating down quality of evidence (risk of bias, imprecision, inconsistency, indirectness, and publication bias) must be rated prior to the 3 factors for rating it up (large effect, dose-response and effects of residual confounding) The decision to rate up quality of evidence should only be made when serious limitations in any of the 5 areas reducing the quality of evidence are absent GRADE Handbook “Although it is theoretically possible to rate up results from randomized control trials, we have yet to find a compelling example of such an instance” 19 05 -dec-20
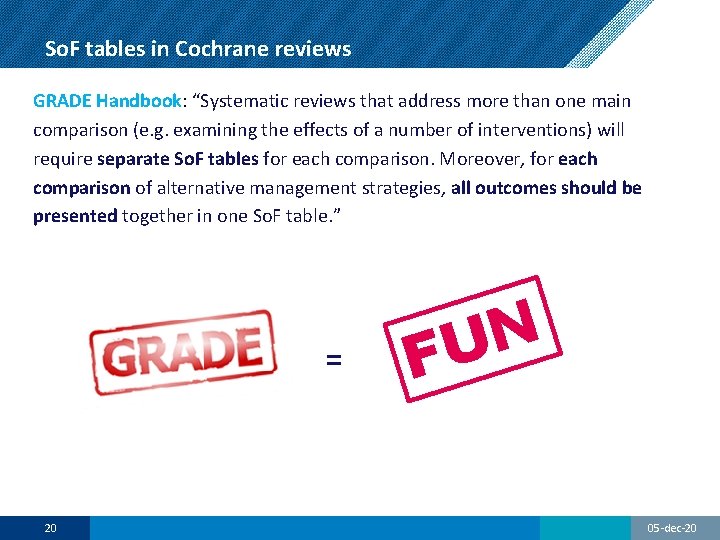
So. F tables in Cochrane reviews GRADE Handbook: “Systematic reviews that address more than one main comparison (e. g. examining the effects of a number of interventions) will require separate So. F tables for each comparison. Moreover, for each comparison of alternative management strategies, all outcomes should be presented together in one So. F table. ” = 20 N U F 05 -dec-20
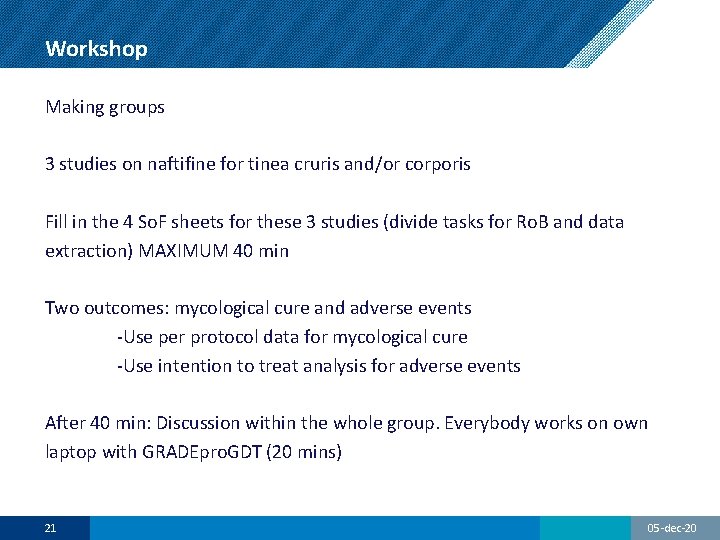
Workshop Making groups 3 studies on naftifine for tinea cruris and/or corporis Fill in the 4 So. F sheets for these 3 studies (divide tasks for Ro. B and data extraction) MAXIMUM 40 min Two outcomes: mycological cure and adverse events -Use per protocol data for mycological cure -Use intention to treat analysis for adverse events After 40 min: Discussion within the whole group. Everybody works on own laptop with GRADEpro. GDT (20 mins) 21 05 -dec-20
- Slides: 21