Summary of Examinations MayJune 2012 CAPE Entries 2010


- Slides: 34

Summary of Examinations May/June 2012

CAPE Entries 2010 - 2012 120, 000 108, 450 110, 057 Candidate Entry Subject Entry 101, 639 100, 000 80, 000 60, 000 40, 000 25, 785 27, 597 28, 043 20, 000 2011 2012

& AD & D TO IA GO ES IN BA AD GR EN S NE VI AT ER R . L UC ST TS IT AN E TH ID IN TR CE NT IN . V ST . K ST CA AI 672 855 104 585 44 741 1 24 120 1, 437 549 10000 8, 826 13, 941 16000 TS ON M JA NA YA DA NA GU A AN YM CA GR E ND IN IC 0 M GR A M E OS LIZ BE AD RB A 144 4000 DO BA GU TI A 2000 AN LL GU I AN CAPE Territorial Entry 14000 12000 8000 6000

CSEC Entries 2010 - 2012 700000 Candidate Entry 610, 713 607, 014 600000 635, 656 Subject Entry 500000 400000 300000 200000 153, 493 153, 120 156, 970 100000 0 2011 2012

BE AD RB OS A A LL UD RB BA 30, 791 40000 493 246 14 3, 012 148 3, 537 1, 262 23 80000 83, 048 90000 126 13, 894 3, 438 1, 006 1, 707 3, 040 8, 479 2, 254 452 10000 BA & GU I AN 20000 LIZ D GR OM E AN IN IC D CA A YM GR AN EN AD GU A YA NA JA M MA ON IC TS A ER RA T ST. K S IT TS ABA & ST NE. V VI IN ST S CE. NT LU ST &. M CI TH AA A E GR RT EN EN AD I SU NES RI TR NA IN M ID E AD TO R AN TO D L TU TO A B RK S & AGO CA IC OS A TI GU AN CSEC Territorial Entry Candidate Entry 70000 60000 50000 30000 0

CCSLC Entries 2010 – 2012 60, 000 Subject Entry 53, 697 49, 067 50, 000 40, 000 30, 000 20, 754 20, 000 10, 000 2011 2012

ST. EN T NC VI & E TH A OL RT TO S DI NE IA . L UC S NE VI AT 49 49 200 818 838 1, 132 1, 135 1, 917 2000 EN A GR & ST TS IT . K ST ER R TS CA AI 500 ON M 690 521 1000 JA DA NA GR E A IC A IN M UD RB BA DO & A LL GU I 1500 M A TI GU AN AN CCSLC Territorial Entry 2500 Candidate Entry 0

CSEC RESULTS

CSEC Trends and Highlights – Region CSEC ENGLISH A • Significant decline in performance • 47% achieved Grades I – III • Summary writing remains a challenge • Performance on the Understanding profile significantly better than on Expression www. cxc. org

CSEC Trends and Highlights – Region CSEC ENGLISH B • First exams on new texts • Slight decline (3%) in percentages at Grades I – III • Decline most evident on Poetry profile www. cxc. org

CSEC Trends and Highlights – Region CSEC MATHEMATICS • A few candidates scored full marks on each paper www. cxc. org • Much evidence of unfamiliarity with basic lower secondary level concepts • Completion of programmes such as CCSLC would provide solid foundation

CSEC Trends and Highlights - Region CSEC ADDITIONAL MATHEMATICS • First examinations in this subject at CSEC • A platform for success at CAPE Pure Mathematics • Approximately 58% at Grades I – III

CSEC Trends and Highlights - Region CSEC PHYSICS • Great disparity in performance on topics related to Modern Physics • Slight improvement in performance compared with 2011 www. cxc. org

CSEC Trends and Highlights - Region CSEC IT • Performance improved compared to 2010. • Over 80% at Grades I – III • A number of candidates demonstrated poor examination strategies www. cxc. org

CSEC Trends and Highlights - Region CSEC CARIBBEAN HISTORY • Candidates challenged by questions requiring extended essays as responses • Teachers need to embrace their role in monitoring and rejecting instances of plagiarism in SBA www. cxc. org

CSEC Trends and Highlights - Region CSEC AGRICULTURAL SCIENCE www. cxc. org

CSEC Trends and Highlights – Region CSEC TD Areas requiring attention: • Adherence to standard drawing practices • Presentation, including line work, dimensioning and labelling • Teacher involvement in the syllabus review process

CAPE RESULTS

CAPE Trends and Highlights - Region CAPE CARIBBEAN STUDIES • Performance generally ranged from satisfactory to good over almost all areas examined on the external papers • However, plagiarism appeared to increase on the SBA www. cxc. org

CAPE Trends and Highlights - Region CAPE COMMUNICATION STUDIES www. cxc. org

CAPE Trends and Highlights - Region CAPE PURE MATHEMATICS Improved performance in both Units www. cxc. org

CAPE Trends and Highlights – Region CAPE BIOLOGY www. cxc. org

CAPE Trends and Highlights - Region CAPE LAW www. cxc. org

CAPE Trends and Highlights - Region CAPE SOCIOLOGY • Numbers in both Units have improved gradually. Unit 1 – numbers more than twice those of Unit 2 www. cxc. org

CAPE Trends and Highlights - Region CAPE MOB Improved performance on Unit 1 Steady performance on Unit 2 www. cxc. org

CCSLC RESULTS

Percentage of Candidates Achieving Mastery and Competence by Subject CCSLC DATA Subject No. Entries Acceptable Grades 2011 2012 English 11109 5045 78. 8% 85. 8% Mathematics 15132 5592 64. 2% 73. 7% Social Studies 7811 2999 73. 2% 81. 5% Integrated Science 6897 2851 67. 2% 84. 3% French 713 996 59. 9% 73. 0% Spanish 1610 1338 73. 4% 68. 4%

Percentage of Candidates Achieving Mastery and Competence by Subject CCSLC - 2012 Spanish, 68. 4% English, 85. 8% French, 73. 0% Integrated Science, 84. 3% Mathematics, 73. 7% Social Studies, 81. 5%

Number of Candidates Qualifying for CCSLC Certificates Year No. Entries 2011 19678 2012 7249 Math and English ONLY Math, English plus one subject Math, English plus two subjects Math, English plus three subjects 6198 1223 1263 596 31% 6% 6% 3% 3650 514 547 1066 50% 7% 74% 15%

CPEA RESULTS

CPEA – External Assessment Subject Mean % Score Science 61. 3 Mathematics 51. 8 Language 55. 6

CPEA –Overall Results • Total of 1951 candidates in two territories, ranging in age from 10 to 13 years Territory Entry Mean % Highest Score Range (%) Anguilla 223 61. 0 88% 16 -88 Grenada 1728 58. 9 93% 0 -93

Some numbers to ponder Number of candidates who wrote English A Number of candidates who wrote Mathematics Candidates achieving Grades I – III in five subjects, including English A and Mathematics at this sitting Region: 93 283 Region: 94 514 Region: 16819 (31%)

Some numbers to ponder • Greatest number of CSEC® subjects written by a candidate: 17 • Age range of candidates 12 – 72 years • Two 12 -year-olds achieved Grade I in Mathematics • One 12 -year-old achieved Grade I in Agricultural Science (SA) www. cxc. org
 New york state teacher certification exams
 Tyre impression forensic science
 Exam prayer to st joseph of cupertino
 Agrotat uoa
 General physical examination
 Examinations.ie marking scheme
 Hong kong examinations and assessment authority
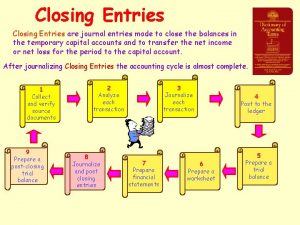
 How to close out revenue account
 Webdhis eastern cape
 Map of south carolina lighthouses
 Tundra landforms
 Cape henlopen soccer club
 Cultural landscape example ap human geography
 Cape meares loop
 Cape information technology unit 1 notes
 Cape funding list
 Cape coral charter school authority
 Ford transit cape cod
 Bitou cape
 Exhibition stand africa
 Upper cape tech nursing program
 University of cape coast
 Joshua fiske
 Piidpa
 Plumed serpent ley line
 Elim - cape south coast
 Jim gordon cape wind
 Cape technologies
 Cape breton water utility
 Rovos rail cape town to dar es salaam
 Osd cape
 5 major types of species interactions
 Safecape
 Cape flats nature reserve
 Milkor centurion
