Suicide in San Diego County of San Diego


 Suicide Rate by Age, 2001 - 2010 18. 6 18.")


 • King, et al. meta-analysis – RR")


- Slides: 27
Suicide in San Diego County of San Diego Health and Human Services Agency Public Health Services
Suicide Rate by State, 2007 AK MT AZ OR OK VT ME State FL AL LA Total NH U. S. Total MN DE CA California (#42) RI CT DC 0 5 Source: Centers for Disease Control and Prevention, National Center for Health Statistics. Compressed Mortality File 1999 -2005. CDC WONDER On-line Database, compiled from Compressed Mortality File 1999 -2005 Series 20 No. 2 K, 2008. Accessed at http: //wonder. cdc. gov/cmf-icd 10. html on Mar 23, 2009 6: 12: 29 PM 10 15 Rate per 100, 000 (Age Adjusted) 20 25
Suicide Rate by California County, 1999 - 2007 Plumas Humboldt Yuba Calaveras Tehama Mariposa County El Dorado Marin Kern San Diego County (#30) San Diego San Francisco Riverside Santa Barbara Total Kings Monterey Orange California Total Los Angeles San Benito 0 5 Source: Centers for Disease Control and Prevention, National Center for Health Statistics. Compressed Mortality File 1999 -2005. CDC WONDER On-line Database, compiled from Compressed Mortality File 1999 -2005 Series 20 No. 2 K, 2008. Accessed at http: //wonder. cdc. gov/cmf-icd 10. html on Mar 23, 2009 6: 12: 29 PM 10 15 Rate per 100, 000 (Age Adjusted) 20 25
Number of Suicides by Age and Gender San Diego County, 2000 - 2009 70% 25 to 64 years 52% of population 800 739 700 648 Number of Suicides 600 11% 500 15 to 24 years 517 17% of population 482 486 374 400 19% 65+ 477 11% of population 357 300 203 222 244 200 166 89 100 10 0 192 4 14 10 -14 15 -19 25 -34 252 118 56 41 20 -24 201 120 112 109 20 248 35 -44 45 -54 55 -64 Age Group Male Source: County of San Diego HHSA, Public Health Services Emergency Medical Services, Medical Examiner’s Database, 2000 - 2009 Female Total 65 -74 51 75 -84 140 22 85+
Suicide Rates by Age and Gender San Diego County, 2000 - 2009 80 Highest rates in oldest males 67. 86 70 Rate per 100, 000 60 50 Female suicide rate peaks at 45 -54 years 39. 01 40 30 25. 61 16. 91 20 10 -14 15 -19 20 -24 25 -34 35 -44 Male Source: County of San Diego HHSA, Public Health Services Emergency Medical Services, Medical Examiner’s Database, 2000 - 2009 45 -54 Female 55 -64 Total 65 -74 75 -84 85+ All Ages
Overall Suicide Rate by Age Group and Year, San Diego County, 1988 - 2010 40 Rate per 100, 000 35 Age distribution starting to change 30 25 20 15 10 5 0 1988 - 1992 1993 -1997 1998 -2002 2003 15 -24 2004 25 -44 Source: County of San Diego HHSA, Public Health Services Emergency Medical Services, Medical Examiner’s Database, 1988 - 2010 2005 45 -64 2006 65+ 2007 2008 Total 2009 2010
Overall Suicide Rate by Year, San Diego County, 1988 - 2010 1988 – 1992 average 16 13. 5/100, 000 Rate per 100, 000 14 18% Decline 2005 – 2009 average 11. 1/100, 000 12 10 8 6 4 2 19 8 8 19 9 9 19 0 9 19 1 9 19 2 9 19 3 9 19 4 9 19 5 9 19 6 9 19 7 9 19 8 9 20 9 0 20 0 0 20 1 0 20 2 0 20 3 0 20 4 0 20 5 0 20 6 0 20 7 0 20 8 0 20 9 10 0 Source: County of San Diego HHSA, Public Health Services Emergency Medical Services, Medical Examiner’s Database, 1988 - 2009
Suicide Methods: Both Sexes, All Ages, 2000 - 2009 Jump 7% Other 10% Firearm 40% Source: County of San Diego HHSA, Public Health Services Emergency Medical Services, Medical Examiner’s Database, 2000 - 2009 OD/Poison 21% Hang/Asphyxia 22%
Suicide Rates by Method, 5 -Year Periods, 1990 - 2009 Average Annual Rate per 100, 000 8 7 39% Decline in Firearm-Related Suicide Rate Firearm, 6. 92 6 5 Firearm, 4. 2 4 3 2 1 0 1990 - 1994 Firearm 1995 - 1999 OD/Poisoning 2000 - 2004 Hang/Strangle/Suffocation Source: County of San Diego HHSA, Public Health Services Emergency Medical Services, Medical Examiner’s Database, 2000 - 2009 2005 - 2009 Jump/Other
Suicide Rates by Method, 1990 - 2009 7 6 5 4 3 2 1 Firearm/Explosive OD/Poisoning Hang/Strangle/Suffocation Source: County of San Diego HHSA, Public Health Services Emergency Medical Services, Medical Examiner’s Database, 2000 - 2009 Jump from high place 09 20 08 20 07 20 06 20 05 20 04 20 03 20 02 20 01 20 00 20 99 19 98 19 97 19 96 19 95 19 94 19 93 19 92 19 91 19 90 0 19 Average Annual Rate per 100, 000 8 Non-firearm
Suicide Rates by Race/Ethnicity: San Diego County, 2000 - 2009 30 Rate per 100, 000 25. 6 25 20 17. 12 15 10 10. 78 8. 53 5 6. 99 8. 61 5. 83 5. 71 3. 63 2. 75 1. 44 3. 02 0 White Black Hispanic Race/Ethnicity Male Source: County of San Diego HHSA, Public Health Services Emergency Medical Services, Medical Examiner’s Database, 2000 - 2009 Female Total Asian/Other
The Tip of the Iceberg Suicide/Self-Inflicted Injury, 2009 377 Deaths Hospital Admissions 1 per day 4 per day 1524 6. 5 per day 2370 Emergency Department 0 500 Source: County of San Diego HHSA, Public Health Services Emergency Medical Services, Medical Examiner’s Database, 1988 – 2009 California Department of Public Health, Safe and Active Communities Branch http: //epicenter. cdph. ca. gov 1000 1500 2000 2500
YRBS
Transitional Age Youth (TAY) Suicide Rate by Age, 2001 - 2010 18. 6 18. 8 Suicide Rate per 100, 000 20 Transitional Age Youth – 18 – 24 16 11. 8 12 8 4 0 3. 7 15 2. 3 16 6. 8 6. 3 6. 6 18 19 20 9. 3 9. 8 21 22 12. 9 11. 8 3. 7 17 Age Source: County of San Diego HHSA, Public Health Services Emergency Medical Services, Medical Examiner’s Database, 2001 - 2010 23 24 25 -44 45 -64 65+
Rate per 100, 000 Suicide Rates by Marital Status: Age 25 – 64 Years, 2000 - 2009 50 45 40 35 30 25 20 15 10 5 0 48. 4 45. 2 35. 4 28 27. 2 16. 2 15. 7 14. 7 10. 8 8. 6 7. 4 4 Single Married Divorced Marital Status Male Source: County of San Diego HHSA, Public Health Services Emergency Medical Services, Medical Examiner’s Database, 2000 - 2009 Female Total Widowed
Rate per 100, 000 Suicide Rates by Marital Status: Age 65 Years and Older, 2000 - 2009 90 80 70 60 50 40 30 20 10 0 78. 3 78. 2 77. 8 44. 5 34. 7 20. 9 19. 4 Single 12. 7 10. 8 4. 6 Married Divorced Marital Status Male Source: County of San Diego HHSA, Public Health Services Emergency Medical Services, Medical Examiner’s Database, 2000 - 2009 Female Total 7. 4 Widowed
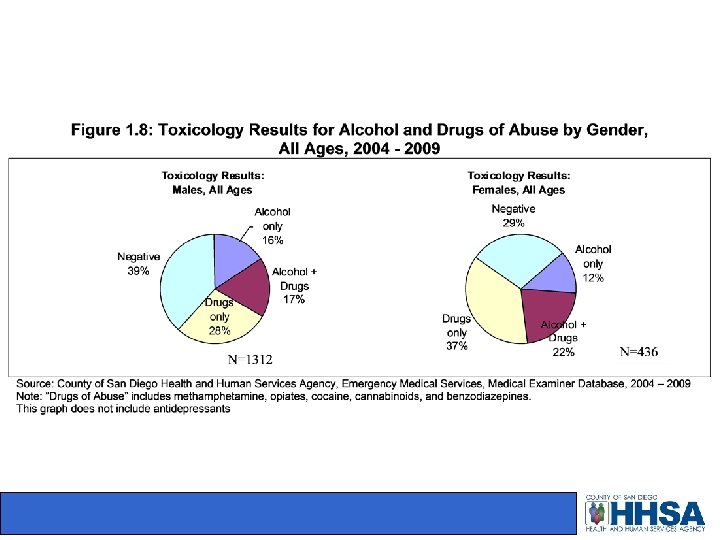
Toxicology: Percent Positive by Substance and Sex, 2000 - 2007 35% Percent Tested 30% 25% 20% 15% 10% 5% es in id C oc B en C ai zo an di na az bi ep no ol ab et m ne m ha et M s s ite es at pi O ph A et lc am oh in ol e 0% Male Female Total Source: County of San Diego HHSA, Public Health Services, Emergency Medical Services, Medical Examiner Database, 2000 – 2007
Special Population: Lesbian, Gay, Bisexual, Transgender (LGBT) • King, et al. meta-analysis – RR suicide attempts (vs hetero): 2. 47 • Men: 4. 28; Women: 1. 82 – RR depression: 2. 03 – RR alcohol/substance abuse: 1. 51 • Mass. Dept. of PH – 31% of transgendered seriously considered attempting suicide
LGBT • No local data, but: • Mustanski, et al. (Am J Public Health. 2010; 100: 2426– 2432. ) – Study of 246 LGBT youth (16 -20 yrs) in Chicago – 31% lifetime suicide attempts – 7% 12 month suicide attempts – Comparable to YRBS in same area
Special Populations: Military/Veterans • 10% of 15 -24 year old male suicides • ~5% of 25 -44 year old male suicides • PTSD and depression increased significantly since Iraq invasion – Seal et al. , AJPH, July, 2009 • Middle-aged and older male veterans not at increased risk of suicide – Miller et al. , AJE, May, 2009
Special Populations: Incarcerated • From 2000 – 2008 in San Diego County – 44 Deaths in custody • About 10, 000 prisoners in custody on any day • Rate: about 50/100, 000 • Risk Factors – – Psychiatric disorder Substance abuse Violence Family suicide history
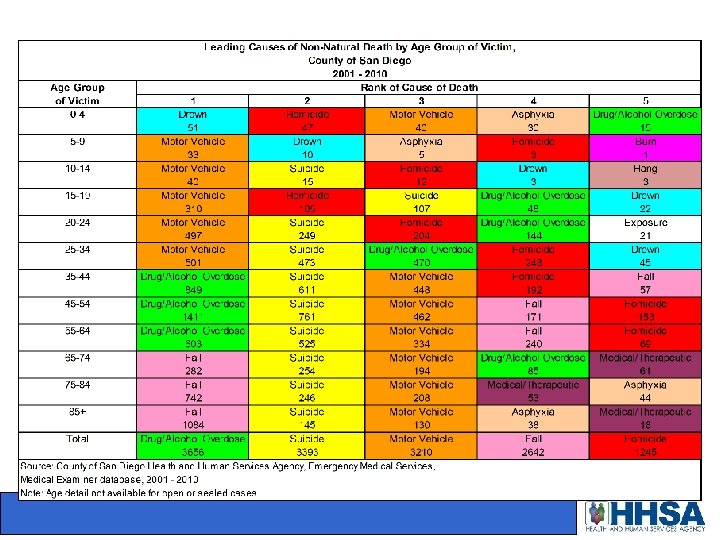
Conclusions • Suicide is still a major public health issue – #2 cause of non-natural death in county • Rates have been declining! – – Down 18% over the past 20 years Drops in almost every age group Firearm suicide rates down 39% BUT 45 – 64 year olds rates are still high • Recent increases are a concern
Conclusions: High Risk • Economy? Some evidence • Solitude • Mental Health – Depression – PTSD • Physical Health – Pain – Cancer • Substance Abuse • Access to Lethal Means
Conclusions: Protective Factors • Social Support – Marriage/Family – Work – Church • Access to Care
Contact Information Alan M. Smith, Ph. D, MPH County of San Diego, HHSA, Emergency Medical Services (619) 285 -6429 Alan. Smith@sdcounty. ca. gov