
Sugarcane Development Programme Dr A L Waghmare Director
- Slides: 20
Sugarcane Development Programme Dr. A. L. Waghmare Director DIRECTORATE OF SUGARCANE DEVELOPMENT Govt. of India, Ministry of Agriculture & Farmers Welfare Lucknow – 226 024 (U. P. )
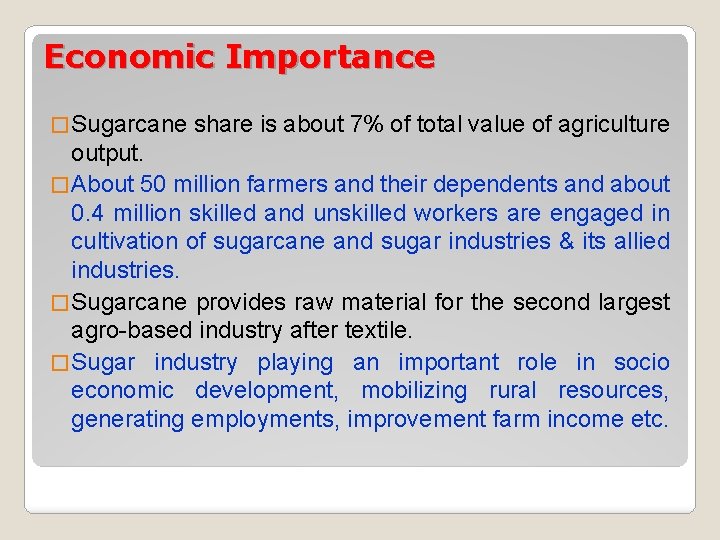
Economic Importance � Sugarcane share is about 7% of total value of agriculture output. � About 50 million farmers and their dependents and about 0. 4 million skilled and unskilled workers are engaged in cultivation of sugarcane and sugar industries & its allied industries. � Sugarcane provides raw material for the second largest agro-based industry after textile. � Sugar industry playing an important role in socio economic development, mobilizing rural resources, generating employments, improvement farm income etc.
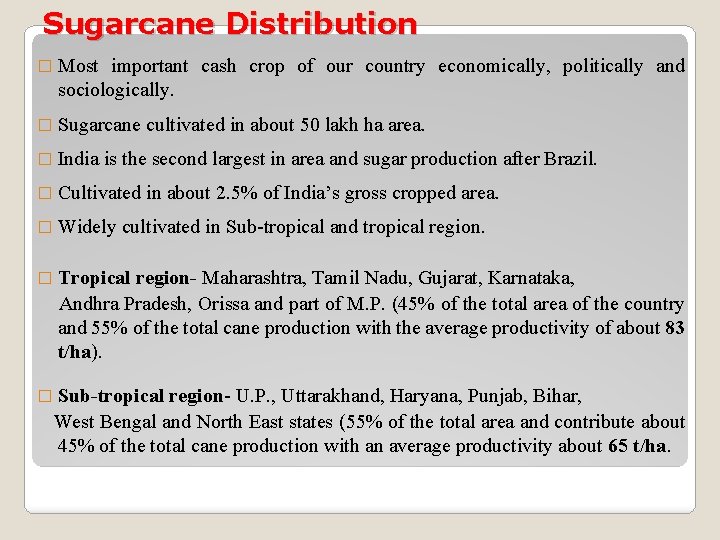
Sugarcane Distribution � Most important cash crop of our country economically, politically and sociologically. � Sugarcane cultivated in about 50 lakh ha area. � India is the second largest in area and sugar production after Brazil. � Cultivated in about 2. 5% of India’s gross cropped area. � Widely cultivated in Sub-tropical and tropical region. � Tropical region- Maharashtra, Tamil Nadu, Gujarat, Karnataka, Andhra Pradesh, Orissa and part of M. P. (45% of the total area of the country and 55% of the total cane production with the average productivity of about 83 t/ha). � Sub-tropical region- U. P. , Uttarakhand, Haryana, Punjab, Bihar, West Bengal and North East states (55% of the total area and contribute about 45% of the total cane production with an average productivity about 65 t/ha.
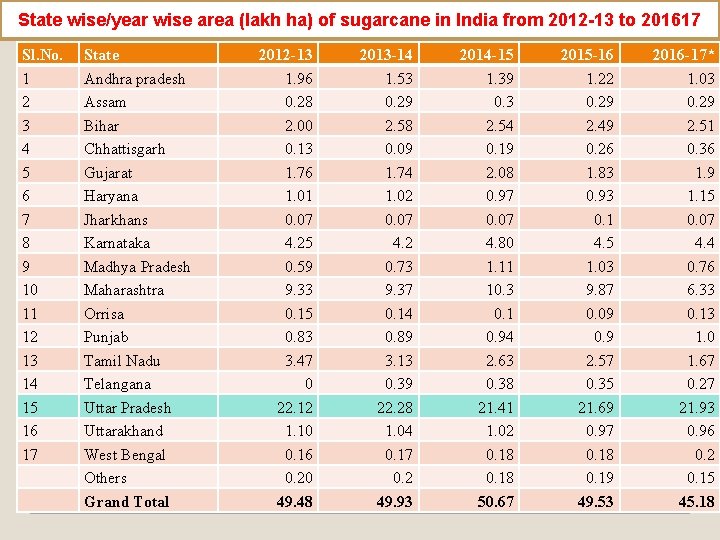
State wise/year wise area (lakh ha) of sugarcane in India from 2012 -13 to 201617 Sl. No. 1 2 3 4 5 6 7 8 9 10 11 12 13 14 15 16 17 State Andhra pradesh Assam Bihar Chhattisgarh Gujarat Haryana Jharkhans Karnataka Madhya Pradesh Maharashtra Orrisa Punjab Tamil Nadu Telangana Uttar Pradesh Uttarakhand West Bengal Others Grand Total 2012 -13 1. 96 0. 28 2. 00 0. 13 1. 76 1. 01 0. 07 4. 25 0. 59 9. 33 0. 15 0. 83 3. 47 0 22. 12 1. 10 0. 16 0. 20 49. 48 2013 -14 1. 53 0. 29 2. 58 0. 09 1. 74 1. 02 0. 07 4. 2 0. 73 9. 37 0. 14 0. 89 3. 13 0. 39 22. 28 1. 04 0. 17 0. 2 49. 93 2014 -15 1. 39 0. 3 2. 54 0. 19 2. 08 0. 97 0. 07 4. 80 1. 11 10. 3 0. 1 0. 94 2. 63 0. 38 21. 41 1. 02 0. 18 50. 67 2015 -16 1. 22 0. 29 2. 49 0. 26 1. 83 0. 93 0. 1 4. 5 1. 03 9. 87 0. 09 0. 9 2. 57 0. 35 21. 69 0. 97 0. 18 0. 19 49. 53 2016 -17* 1. 03 0. 29 2. 51 0. 36 1. 9 1. 15 0. 07 4. 4 0. 76 6. 33 0. 13 1. 0 1. 67 0. 27 21. 93 0. 96 0. 2 0. 15 45. 18
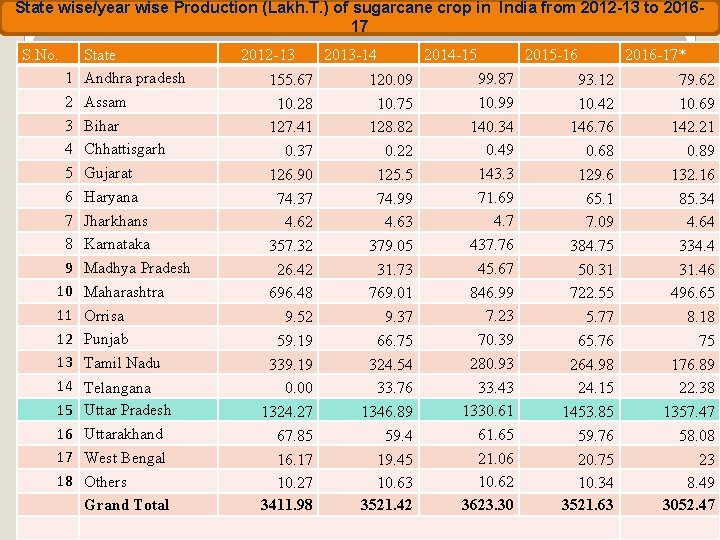
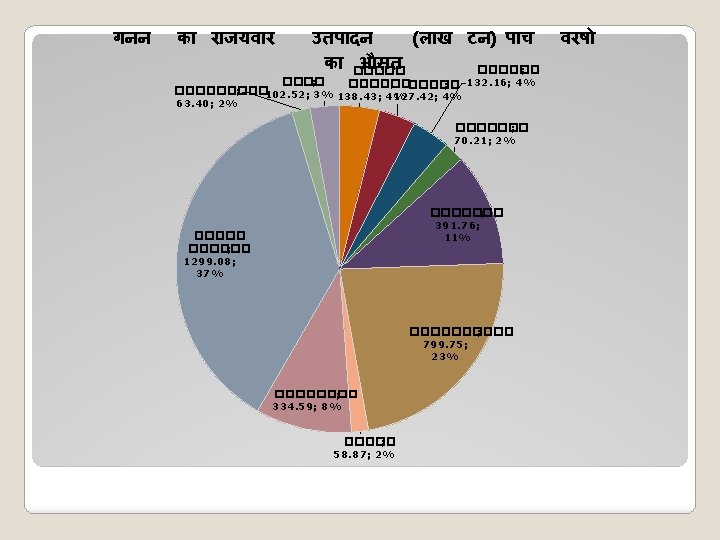
State wise/year wise Production (Lakh. T. ) of sugarcane crop in India from 2012 -13 to 201617 S. No. 1 2 3 4 5 6 7 8 9 10 11 12 13 14 15 16 17 18 State Andhra pradesh Assam Bihar Chhattisgarh Gujarat Haryana Jharkhans Karnataka Madhya Pradesh Maharashtra Orrisa Punjab Tamil Nadu Telangana Uttar Pradesh Uttarakhand West Bengal Others Grand Total 2012 -13 155. 67 10. 28 127. 41 0. 37 126. 90 74. 37 4. 62 357. 32 26. 42 696. 48 9. 52 59. 19 339. 19 0. 00 1324. 27 67. 85 16. 17 10. 27 3411. 98 2013 -14 120. 09 10. 75 128. 82 0. 22 125. 5 74. 99 4. 63 379. 05 31. 73 769. 01 9. 37 66. 75 324. 54 33. 76 1346. 89 59. 4 19. 45 10. 63 3521. 42 2014 -15 99. 87 10. 99 140. 34 0. 49 143. 3 71. 69 4. 7 437. 76 45. 67 846. 99 7. 23 70. 39 280. 93 33. 43 1330. 61 61. 65 21. 06 10. 62 3623. 30 2015 -16 93. 12 10. 42 146. 76 0. 68 129. 6 65. 1 7. 09 384. 75 50. 31 722. 55 5. 77 65. 76 264. 98 24. 15 1453. 85 59. 76 20. 75 10. 34 3521. 63 2016 -17* 79. 62 10. 69 142. 21 0. 89 132. 16 85. 34 4. 64 334. 4 31. 46 496. 65 8. 18 75 176. 89 22. 38 1357. 47 58. 08 23 8. 49 3052. 47
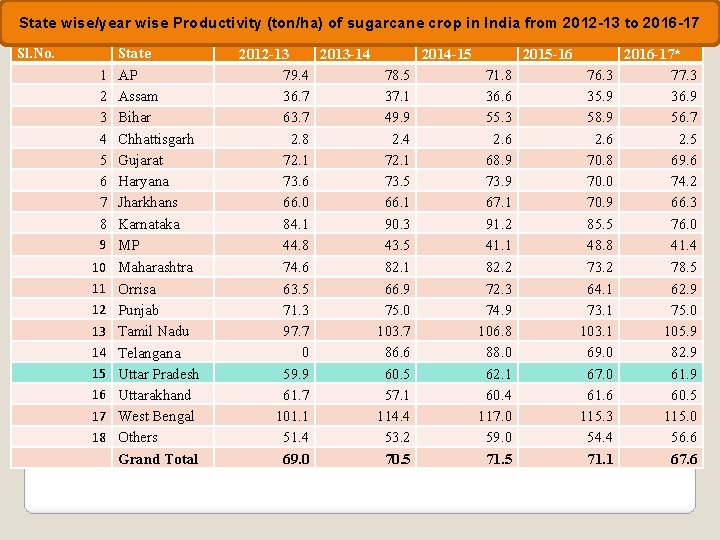
State wise/year wise Productivity (ton/ha) of sugarcane crop in India from 2012 -13 to 2016 -17 Sl. No. 1 2 3 4 5 6 7 8 9 10 11 12 13 14 15 16 17 18 State AP Assam Bihar Chhattisgarh Gujarat Haryana Jharkhans Karnataka MP Maharashtra Orrisa Punjab Tamil Nadu Telangana Uttar Pradesh Uttarakhand West Bengal Others Grand Total 2012 -13 2013 -14 2014 -15 2015 -16 2016 -17* 79. 4 78. 5 71. 8 76. 3 77. 3 36. 7 37. 1 36. 6 35. 9 36. 9 63. 7 49. 9 55. 3 58. 9 56. 7 2. 8 2. 4 2. 6 2. 5 72. 1 68. 9 70. 8 69. 6 73. 5 73. 9 70. 0 74. 2 66. 0 66. 1 67. 1 70. 9 66. 3 84. 1 90. 3 91. 2 85. 5 76. 0 44. 8 43. 5 41. 1 48. 8 41. 4 74. 6 82. 1 82. 2 73. 2 78. 5 63. 5 66. 9 72. 3 64. 1 62. 9 71. 3 75. 0 74. 9 73. 1 75. 0 97. 7 103. 7 106. 8 103. 1 105. 9 0 86. 6 88. 0 69. 0 82. 9 59. 9 60. 5 62. 1 67. 0 61. 9 61. 7 57. 1 60. 4 61. 6 60. 5 101. 1 114. 4 117. 0 115. 3 115. 0 51. 4 53. 2 59. 0 54. 4 56. 6 69. 0 70. 5 71. 1 67. 6
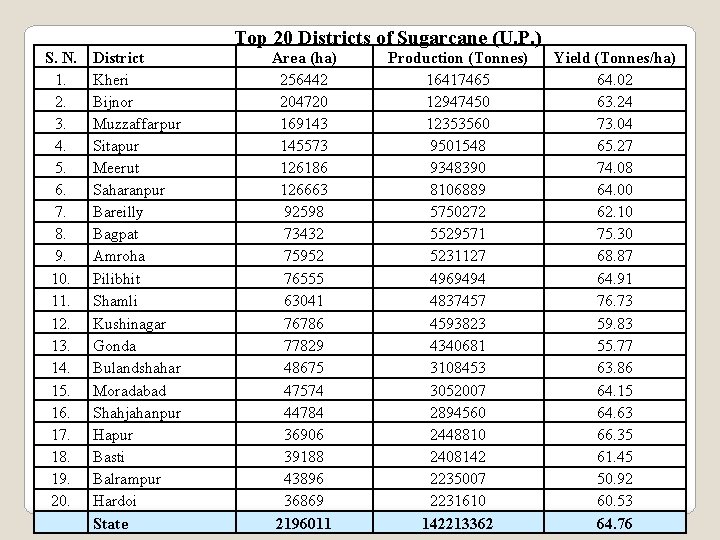
Top 20 Districts of Sugarcane (U. P. ) S. N. 1. 2. 3. 4. 5. 6. 7. 8. 9. 10. 11. 12. 13. 14. 15. 16. 17. 18. 19. 20. District Kheri Bijnor Muzzaffarpur Sitapur Meerut Saharanpur Bareilly Bagpat Amroha Pilibhit Shamli Kushinagar Gonda Bulandshahar Moradabad Shahjahanpur Hapur Basti Balrampur Hardoi State Area (ha) 256442 204720 169143 145573 126186 126663 92598 73432 75952 76555 63041 76786 77829 48675 47574 44784 36906 39188 43896 36869 2196011 Production (Tonnes) 16417465 12947450 12353560 9501548 9348390 8106889 5750272 5529571 5231127 4969494 4837457 4593823 4340681 3108453 3052007 2894560 2448810 2408142 2235007 2231610 142213362 Yield (Tonnes/ha) 64. 02 63. 24 73. 04 65. 27 74. 08 64. 00 62. 10 75. 30 68. 87 64. 91 76. 73 59. 83 55. 77 63. 86 64. 15 64. 63 66. 35 61. 45 50. 92 60. 53 64. 76
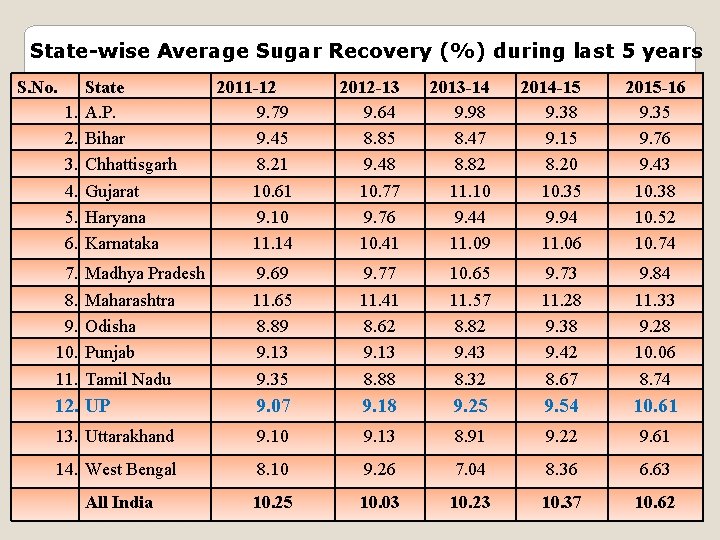
State-wise Average Sugar Recovery (%) during last 5 years S. No. 2011 -12 9. 79 9. 45 8. 21 10. 61 9. 10 11. 14 2012 -13 9. 64 8. 85 9. 48 10. 77 9. 76 10. 41 2013 -14 9. 98 8. 47 8. 82 11. 10 9. 44 11. 09 2014 -15 9. 38 9. 15 8. 20 10. 35 9. 94 11. 06 9. 69 11. 65 8. 89 9. 13 9. 35 9. 77 11. 41 8. 62 9. 13 8. 88 10. 65 11. 57 8. 82 9. 43 8. 32 9. 73 11. 28 9. 38 9. 42 8. 67 9. 84 11. 33 9. 28 10. 06 8. 74 12. UP 9. 07 9. 18 9. 25 9. 54 10. 61 13. Uttarakhand 9. 10 9. 13 8. 91 9. 22 9. 61 14. West Bengal 8. 10 9. 26 7. 04 8. 36 6. 63 All India 10. 25 10. 03 10. 23 10. 37 10. 62 1. 2. 3. 4. 5. 6. 7. 8. 9. 10. 11. State A. P. Bihar Chhattisgarh Gujarat Haryana Karnataka Madhya Pradesh Maharashtra Odisha Punjab Tamil Nadu 2015 -16 9. 35 9. 76 9. 43 10. 38 10. 52 10. 74
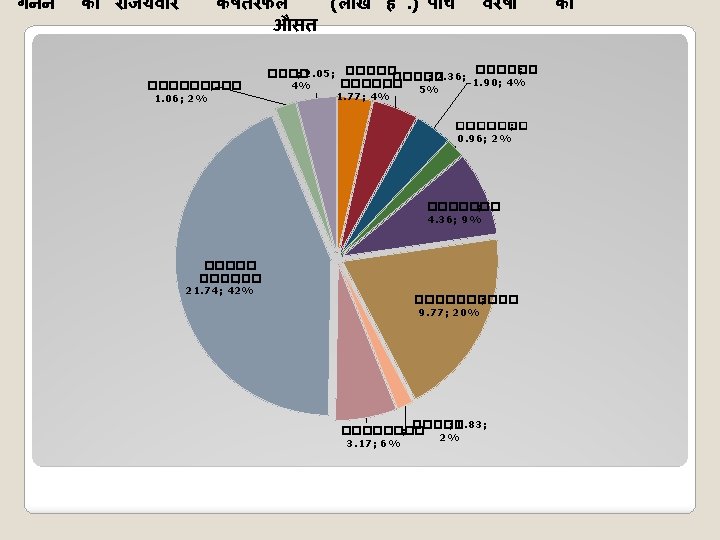
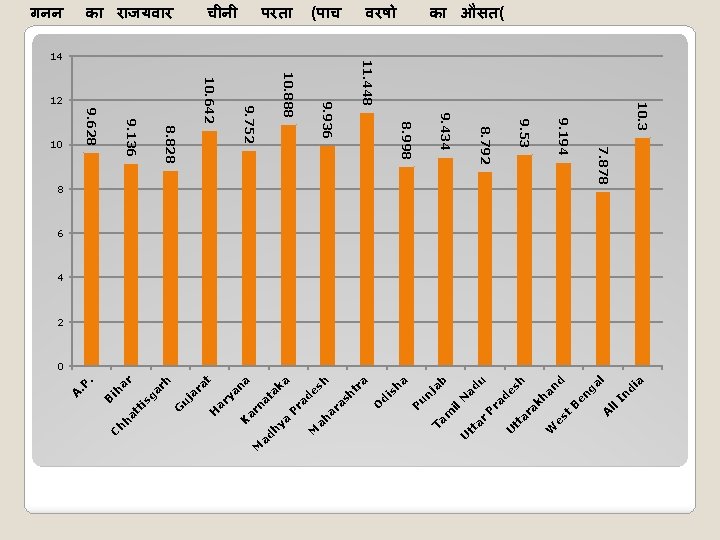
A t es W ll a di In l ga en B d an h de s h ak b u ad n ja N ra P ar tt U Ta m il u P sh a di O a tr h a h de s as ar ah M ra P t n a ak at n ar ya h ad M K ya ar H h ra ja u G ar sg ti 10. 3 8 7. 878 9. 194 ar 14 9. 53 at वरष 8. 792 ih (प च 9. 434 8. 998 B परत 11. 448 9. 936 h h च न 10. 888 C क र जयव र 9. 752 . 12 10. 642 8. 828 9. 136 . P 10 9. 628 A गनन क औसत( 6 4 2 0
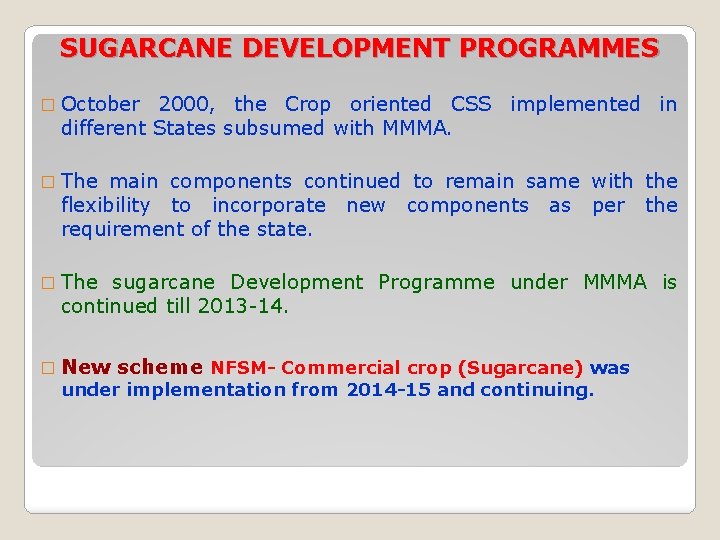
SUGARCANE DEVELOPMENT PROGRAMMES � October 2000, the Crop oriented CSS implemented in different States subsumed with MMMA. � The main components continued to remain same with the flexibility to incorporate new components as per the requirement of the state. � The sugarcane Development Programme under MMMA is continued till 2013 -14. � New scheme NFSM- Commercial crop (Sugarcane) was under implementation from 2014 -15 and continuing.
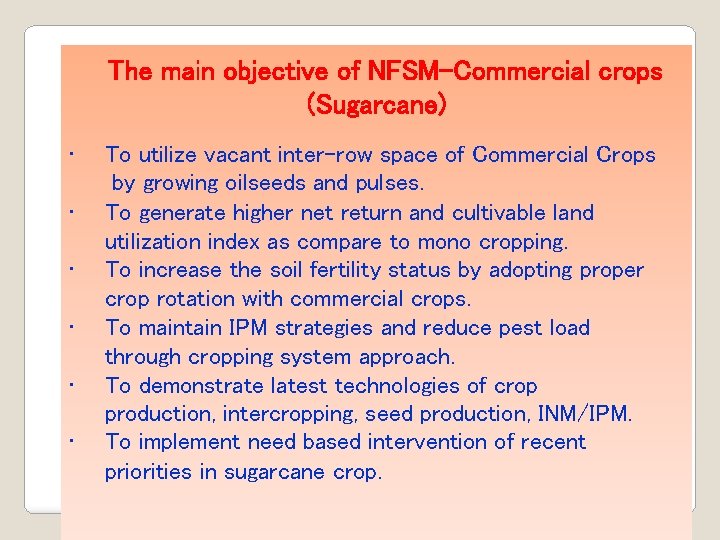
The main objective of NFSM-Commercial crops (Sugarcane) • • • To utilize vacant inter-row space of Commercial Crops by growing oilseeds and pulses. To generate higher net return and cultivable land utilization index as compare to mono cropping. To increase the soil fertility status by adopting proper crop rotation with commercial crops. To maintain IPM strategies and reduce pest load through cropping system approach. To demonstrate latest technologies of crop production, intercropping, seed production, INM/IPM. To implement need based intervention of recent priorities in sugarcane crop.
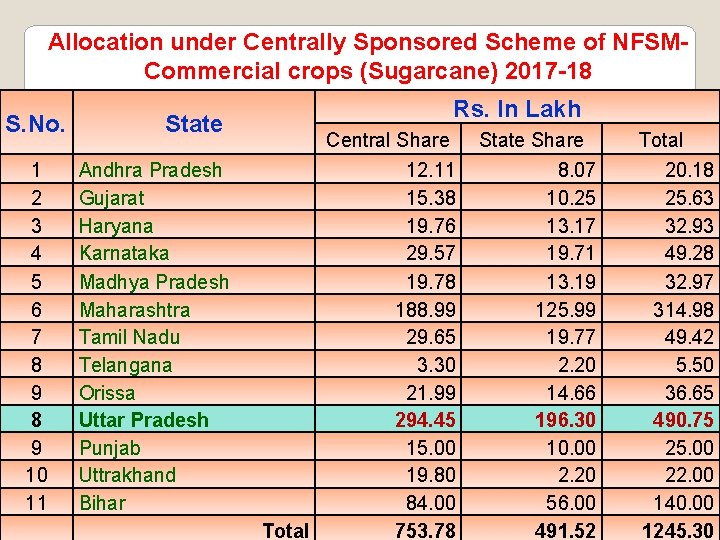
Allocation under Centrally Sponsored Scheme of NFSMCommercial crops (Sugarcane) 2017 -18 S. No. 1 2 3 4 5 6 7 8 9 10 11 State Andhra Pradesh Gujarat Haryana Karnataka Madhya Pradesh Maharashtra Tamil Nadu Telangana Orissa Uttar Pradesh Punjab Uttrakhand Bihar Rs. In Lakh Central Share 12. 11 15. 38 19. 76 29. 57 19. 78 188. 99 29. 65 3. 30 21. 99 294. 45 15. 00 19. 80 84. 00 Total 753. 78 State Share 8. 07 10. 25 13. 17 19. 71 13. 19 125. 99 19. 77 2. 20 14. 66 196. 30 10. 00 2. 20 56. 00 491. 52 Total 20. 18 25. 63 32. 93 49. 28 32. 97 314. 98 49. 42 5. 50 36. 65 490. 75 25. 00 22. 00 140. 00 1245. 30
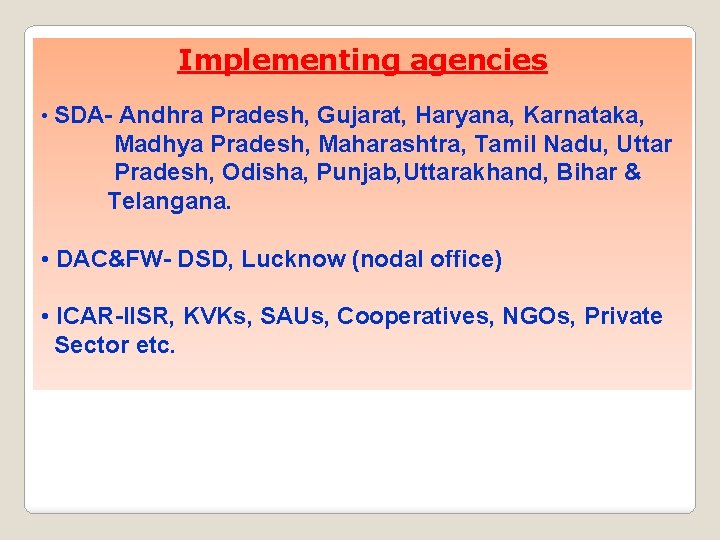
Implementing agencies • SDA- Andhra Pradesh, Gujarat, Haryana, Karnataka, Madhya Pradesh, Maharashtra, Tamil Nadu, Uttar Pradesh, Odisha, Punjab, Uttarakhand, Bihar & Telangana. • DAC&FW- DSD, Lucknow (nodal office) • ICAR-IISR, KVKs, SAUs, Cooperatives, NGOs, Private Sector etc.
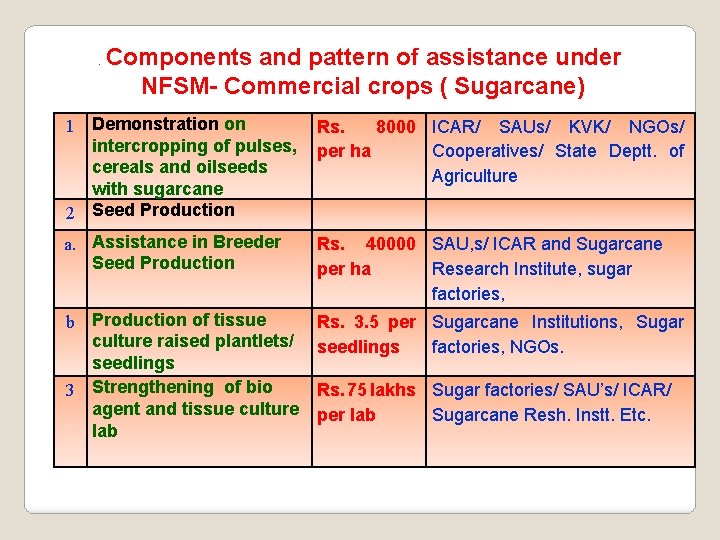
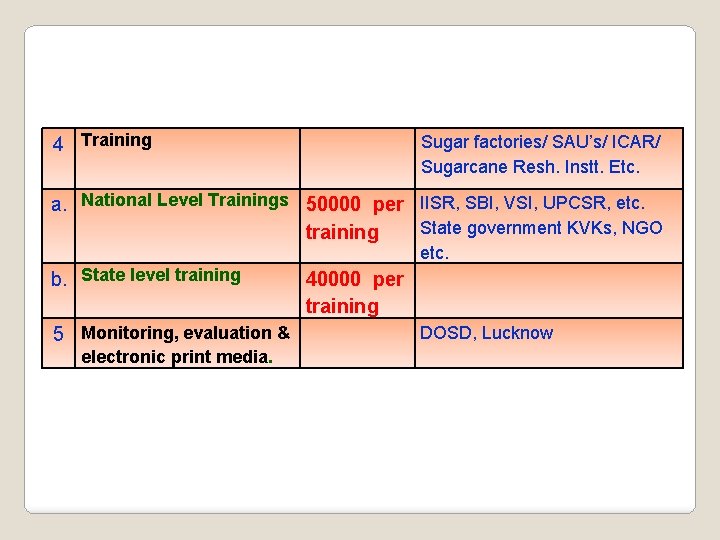
. Components and pattern of assistance under NFSM- Commercial crops ( Sugarcane) 1 Demonstration on intercropping of pulses, cereals and oilseeds with sugarcane 2 Seed Production Rs. 8000 ICAR/ SAUs/ KVK/ NGOs/ per ha Cooperatives/ State Deptt. of Agriculture a. Assistance in Breeder Seed Production Rs. 40000 SAU, s/ ICAR and Sugarcane per ha Research Institute, sugar factories, b Production of tissue culture raised plantlets/ seedlings 3 Strengthening of bio agent and tissue culture lab Rs. 3. 5 per Sugarcane Institutions, Sugar seedlings factories, NGOs. Rs. 75 lakhs Sugar factories/ SAU’s/ ICAR/ per lab Sugarcane Resh. Instt. Etc.
4 Training Sugar factories/ SAU’s/ ICAR/ Sugarcane Resh. Instt. Etc. a. National Level Trainings 50000 per IISR, SBI, VSI, UPCSR, etc. State government KVKs, NGO training etc. b. State level training 5 Monitoring, evaluation & electronic print media. 40000 per training DOSD, Lucknow
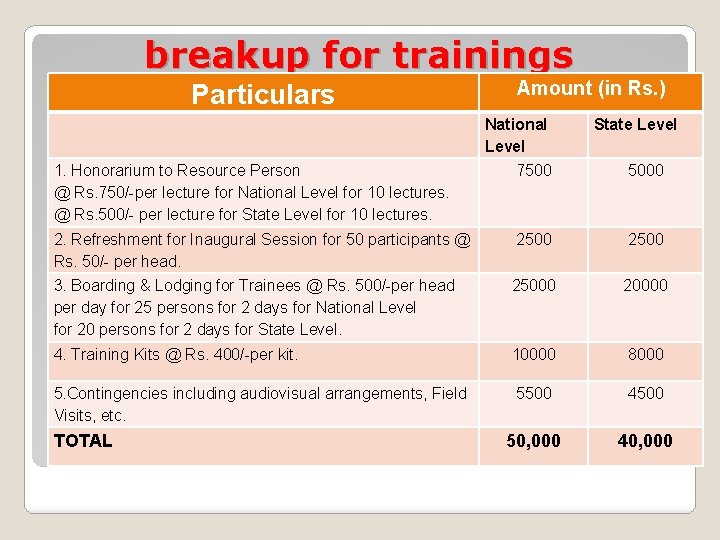
breakup for trainings Particulars 1. Honorarium to Resource Person @ Rs. 750/-per lecture for National Level for 10 lectures. @ Rs. 500/- per lecture for State Level for 10 lectures. Amount (in Rs. ) National Level 7500 State Level 5000 2. Refreshment for Inaugural Session for 50 participants @ Rs. 50/- per head. 3. Boarding & Lodging for Trainees @ Rs. 500/-per head per day for 25 persons for 2 days for National Level for 20 persons for 2 days for State Level. 25000 20000 4. Training Kits @ Rs. 400/-per kit. 10000 8000 5. Contingencies including audiovisual arrangements, Field Visits, etc. 5500 4500 50, 000 40, 000 TOTAL
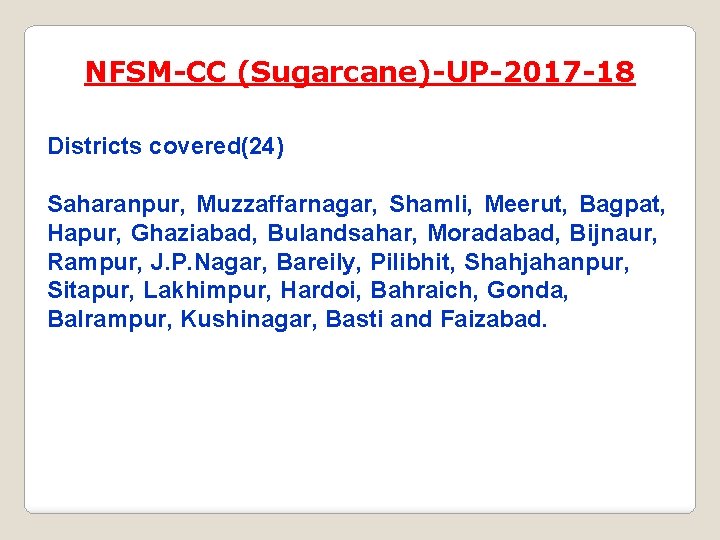
NFSM-CC (Sugarcane)-UP-2017 -18 Districts covered(24) Saharanpur, Muzzaffarnagar, Shamli, Meerut, Bagpat, Hapur, Ghaziabad, Bulandsahar, Moradabad, Bijnaur, Rampur, J. P. Nagar, Bareily, Pilibhit, Shahjahanpur, Sitapur, Lakhimpur, Hardoi, Bahraich, Gonda, Balrampur, Kushinagar, Basti and Faizabad.
THANK YOU 20