
Studying Geography Chapter 2 Lesson 1 Globe vs
Studying Geography Chapter 2 Lesson 1
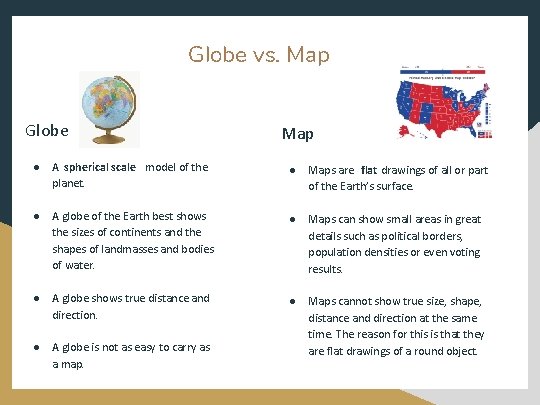
Globe vs. Map Globe Map ● A spherical scale model of the planet. ● Maps are flat drawings of all or part of the Earth’s surface. ● A globe of the Earth best shows the sizes of continents and the shapes of landmasses and bodies of water. ● Maps can show small areas in great details such as political borders, population densities or even voting results. ● A globe shows true distance and direction. ● Maps cannot show true size, shape, distance and direction at the same time. The reason for this is that they are flat drawings of a round object. ● A globe is not as easy to carry as a map.
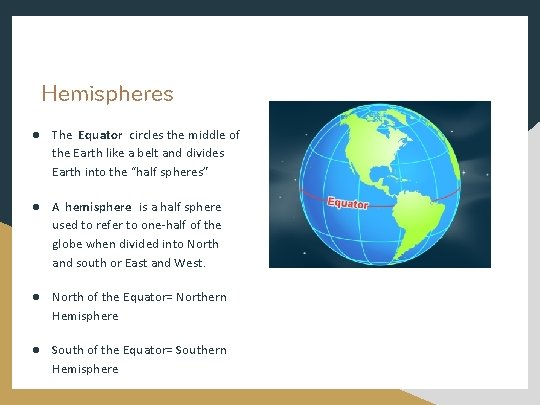
Hemispheres ● The Equator circles the middle of the Earth like a belt and divides Earth into the “half spheres” ● A hemisphere is a half sphere used to refer to one-half of the globe when divided into North and south or East and West. ● North of the Equator= Northern Hemisphere ● South of the Equator= Southern Hemisphere
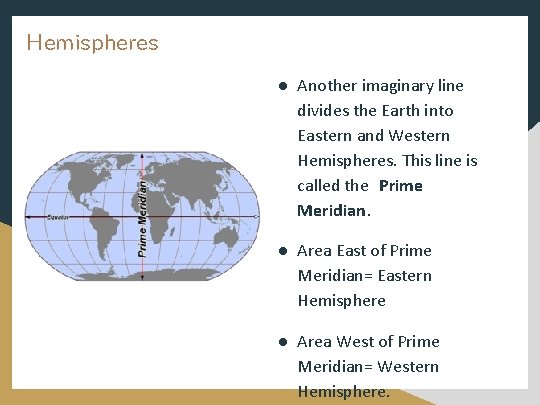
Hemispheres ● Another imaginary line divides the Earth into Eastern and Western Hemispheres. This line is called the Prime Meridian. ● Area East of Prime Meridian= Eastern Hemisphere ● Area West of Prime Meridian= Western Hemisphere.

Latitude - Imaginary lines that circle the earth - Run parallel to the equator (0 degrees latitude) - “Rungs on a ladder”
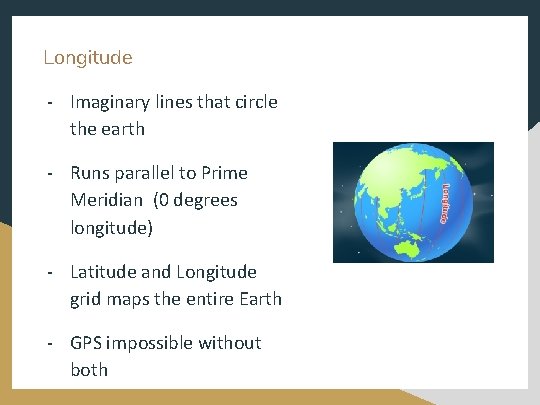
Longitude - Imaginary lines that circle the earth - Runs parallel to Prime Meridian (0 degrees longitude) - Latitude and Longitude grid maps the entire Earth - GPS impossible without both
END OF TODAY’S LESSON
The Five Themes of Geography - To understand how our world is connected, some geographers have broken the study of geography into five THEMES. - The Five Themes of Geography are: - Location - Place - Human-Environment Interaction - Movement - Regions
Six Essential Elements Recently, geographers have begun to divide the study of geography into Six Essential Elements. Understanding these elements will help you build your knowledge of Geography.
1. The World in Spatial Terms What do geographers do when studying a certain place? They first take a look at where the place is located. Location is a useful starting point. By asking “Where is it? ” you begin to develop an awareness of the world around you.
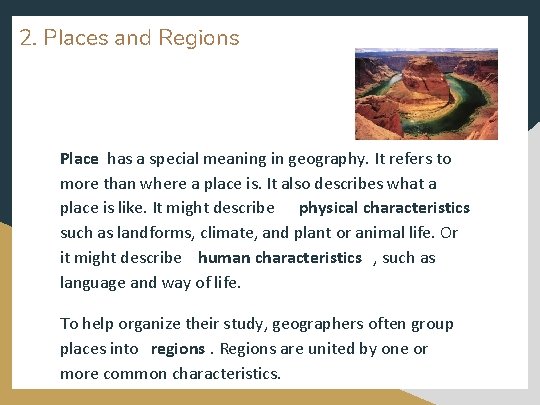
2. Places and Regions Place has a special meaning in geography. It refers to more than where a place is. It also describes what a place is like. It might describe physical characteristics such as landforms, climate, and plant or animal life. Or it might describe human characteristics , such as language and way of life. To help organize their study, geographers often group places into regions. Regions are united by one or more common characteristics.
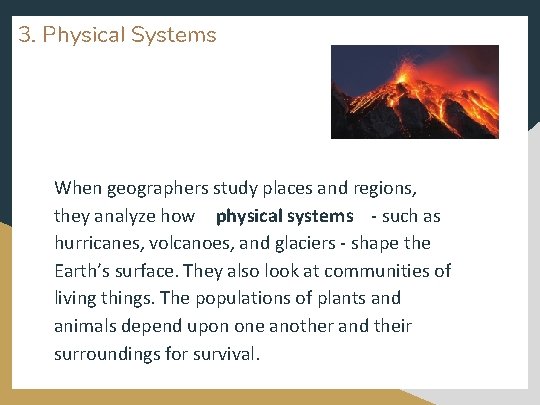
3. Physical Systems When geographers study places and regions, they analyze how physical systems - such as hurricanes, volcanoes, and glaciers - shape the Earth’s surface. They also look at communities of living things. The populations of plants and animals depend upon one another and their surroundings for survival.
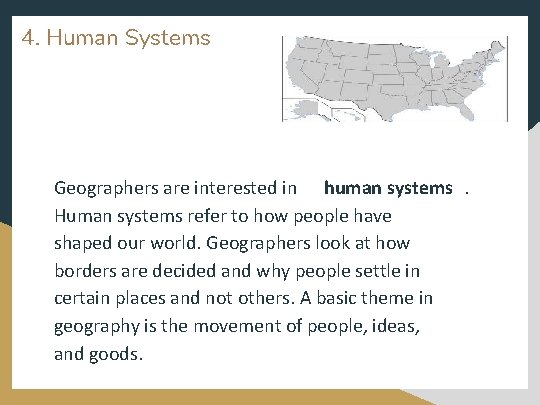
4. Human Systems Geographers are interested in human systems. Human systems refer to how people have shaped our world. Geographers look at how borders are decided and why people settle in certain places and not others. A basic theme in geography is the movement of people, ideas, and goods.
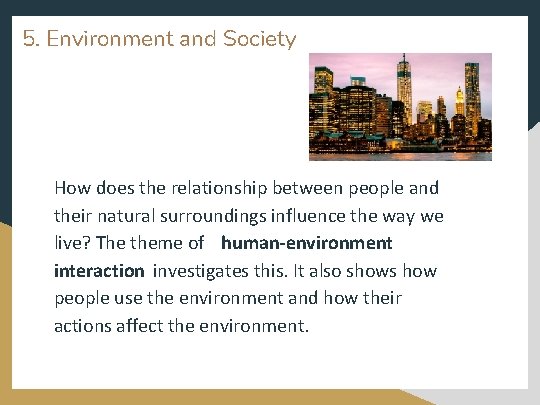
5. Environment and Society How does the relationship between people and their natural surroundings influence the way we live? The theme of human-environment interaction investigates this. It also shows how people use the environment and how their actions affect the environment.
The Uses of Geography helps us understand the relationships among people, places, and environments. Mastering the tools and technology used for studying geography can also help us in our daily lives.
Critical Thinking Skills You have 5 minutes to work at your table groups or with a partner to list several ways in which humans change the physical environment. You will list these on a single sheet of paper with all group member names on that sheet. We will share after five minutes. GO!
END OF TODAY’S LESSON
Types of Maps Geographers use many different types of maps. Maps that show a wide range of information are called general-purpose maps. These maps are often collected into one book called an atlas. An atlas may be a collection of special area maps - such as North America maps - or general maps of the entire world. Two of the most common general-purpose maps found in an atlas are physical and political maps.
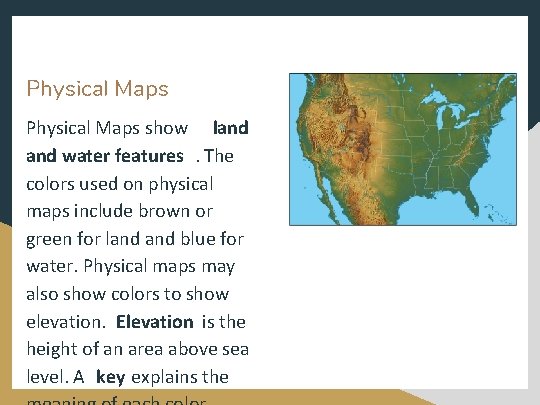
Physical Maps show land water features. The colors used on physical maps include brown or green for land blue for water. Physical maps may also show colors to show elevation. Elevation is the height of an area above sea level. A key explains the
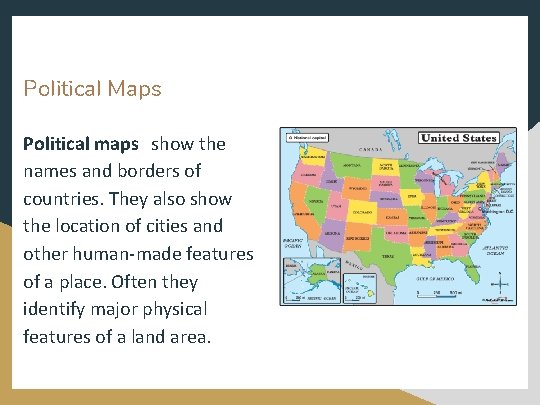
Political Maps Political maps show the names and borders of countries. They also show the location of cities and other human-made features of a place. Often they identify major physical features of a land area.
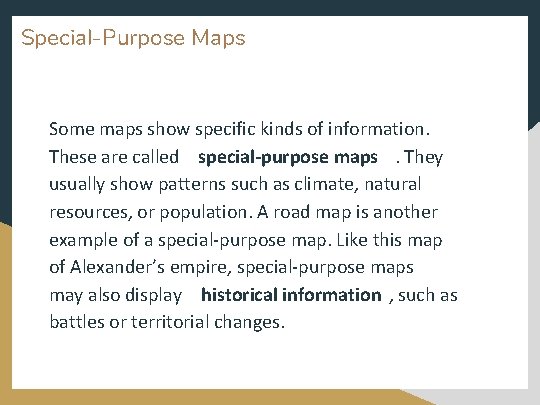
Special-Purpose Maps Some maps show specific kinds of information. These are called special-purpose maps. They usually show patterns such as climate, natural resources, or population. A road map is another example of a special-purpose map. Like this map of Alexander’s empire, special-purpose maps may also display historical information , such as battles or territorial changes.
Reading Maps An important step in reading a map is to study the map key. The key explains the lines and colors used on a map. It also explains any symbols , or signs and pictures, used on a map. For example, the map of Alexander’s empire details the size of the empire, the route of Alexander’s conquest, and some important battles. Cities are usually shown as a solid circle (. ), like the one for Athens.
Reading Maps The map’s scale is a measuring line that tells you the distances represented on the map. Using the scale bar will help you calculate the distance.
Reading Maps A map has a symbol called a compass rose that tells you the position of the cardinal directions north, south, east, and west. Cardinal directions help you explain the relative location of any place on Earth. Some maps also have a locator map , a small inset map. This shows where the region on the large map is located.
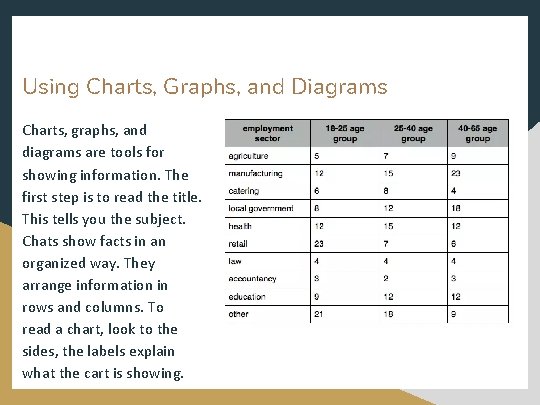
Using Charts, Graphs, and Diagrams Charts, graphs, and diagrams are tools for showing information. The first step is to read the title. This tells you the subject. Chats show facts in an organized way. They arrange information in rows and columns. To read a chart, look to the sides, the labels explain what the cart is showing.
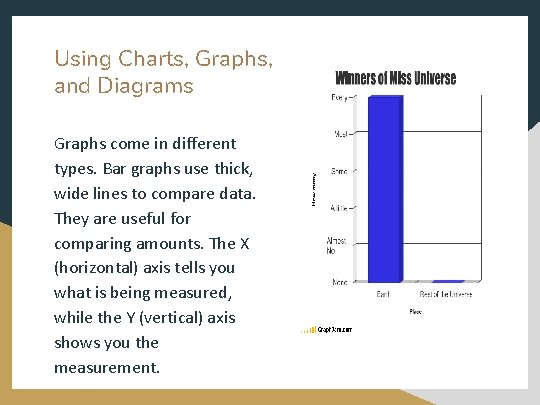
Using Charts, Graphs, and Diagrams Graphs come in different types. Bar graphs use thick, wide lines to compare data. They are useful for comparing amounts. The X (horizontal) axis tells you what is being measured, while the Y (vertical) axis shows you the measurement.
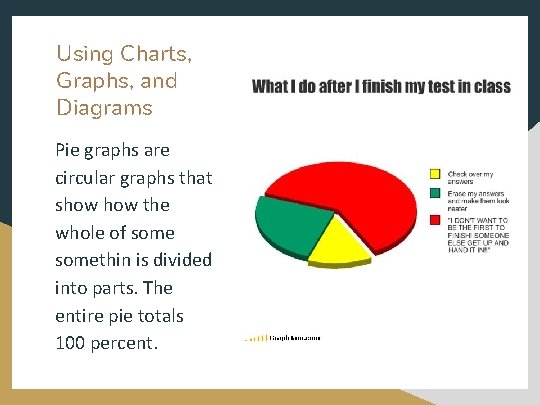
Using Charts, Graphs, and Diagrams Pie graphs are circular graphs that show the whole of somethin is divided into parts. The entire pie totals 100 percent.
END OF TODAY’S LESSON
Population and Culture This rest of this chapter is yours to do! As we did in class, find the correct pages and fill in the rest of our note sheets. Then, in table groups or with partners, answer the Lesson 1 Review Questions! ANSWERS SHOULD BE ON A SEPARATE SHEET OF PAPER TO BE TURNED IN!
- Slides: 29