
Study of The Diffractive Component of the Inclusive








- Slides: 54
Study of The Diffractive Component of the Inclusive Z->e+e- and Z->m+m- Cross Section Candidato: Marone Matteo Relatori: Dott. sa Arcidiacono Roberta Dott. Cartiglia Nicolo’ Scuola di dottorato in Scienza ed Alta Tecnologia, Indirizzo Fisica ed Astrofisica Ciclo XXIII, Ph. D. final dissertation
Outline • Introduction – LHC & CMS – ECAL • Measurement of ECAL Thermal Stability – DCU – Results • Study of the Diffractive Component – Pile-up Removal – Results 2/34 Matteo Marone –Ph. D. Final Dissertation Torino- June 20 th 2011
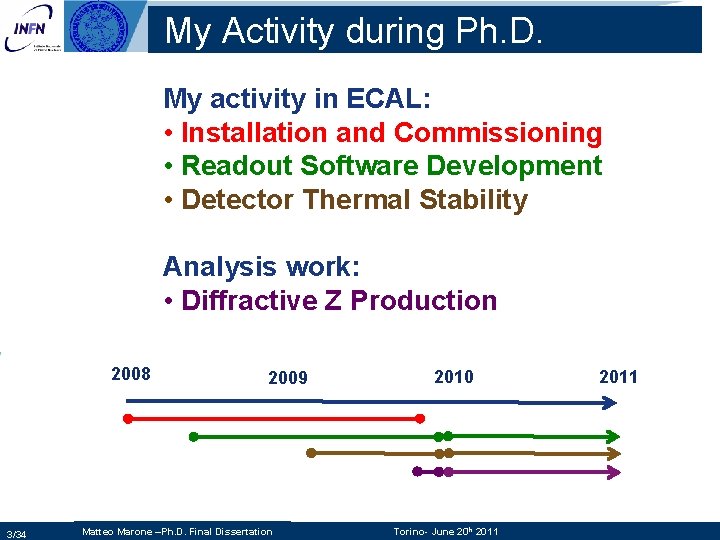
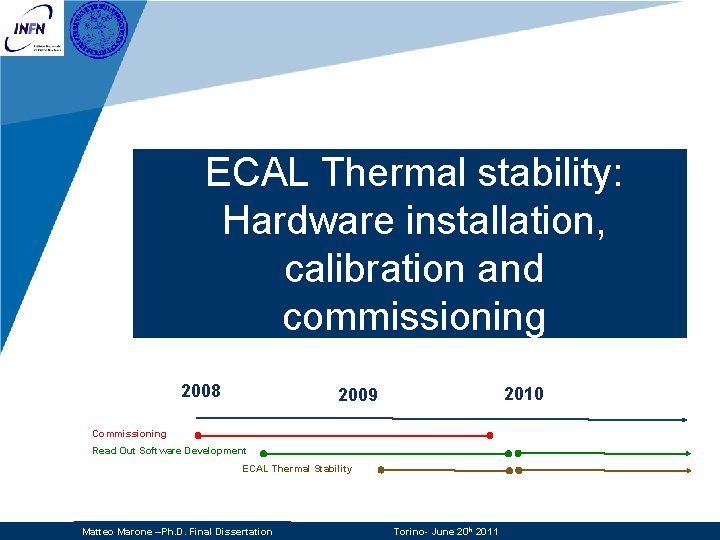
My Activity during Ph. D. My activity in ECAL: • Installation and Commissioning • Readout Software Development • Detector Thermal Stability Analysis work: • Diffractive Z Production 2008 3/34 2009 Matteo Marone –Ph. D. Final Dissertation 2010 Torino- June 20 th 2011
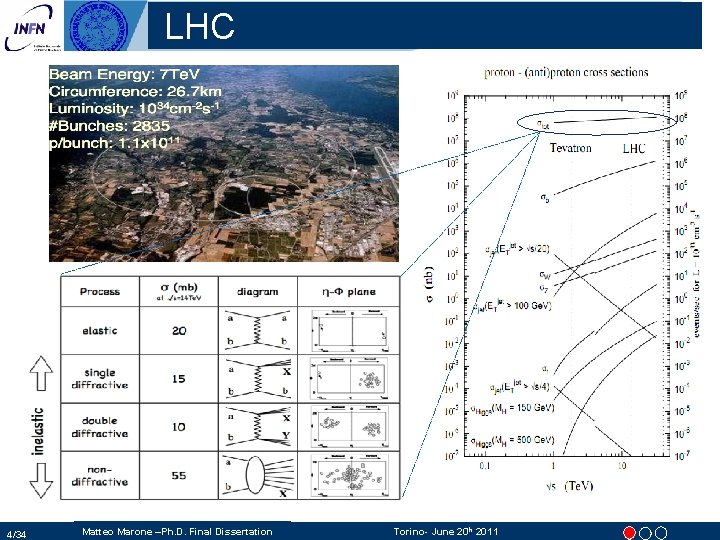
LHC 4/34 Matteo Marone –Ph. D. Final Dissertation Torino- June 20 th 2011
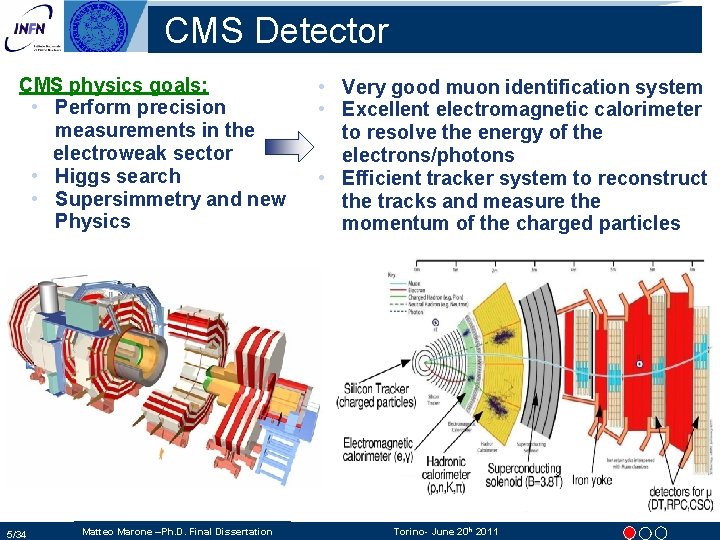
CMS Detector CMS physics goals: • Perform precision measurements in the electroweak sector • Higgs search • Supersimmetry and new Physics 5/34 Matteo Marone –Ph. D. Final Dissertation • Very good muon identification system • Excellent electromagnetic calorimeter to resolve the energy of the electrons/photons • Efficient tracker system to reconstruct the tracks and measure the momentum of the charged particles Torino- June 20 th 2011
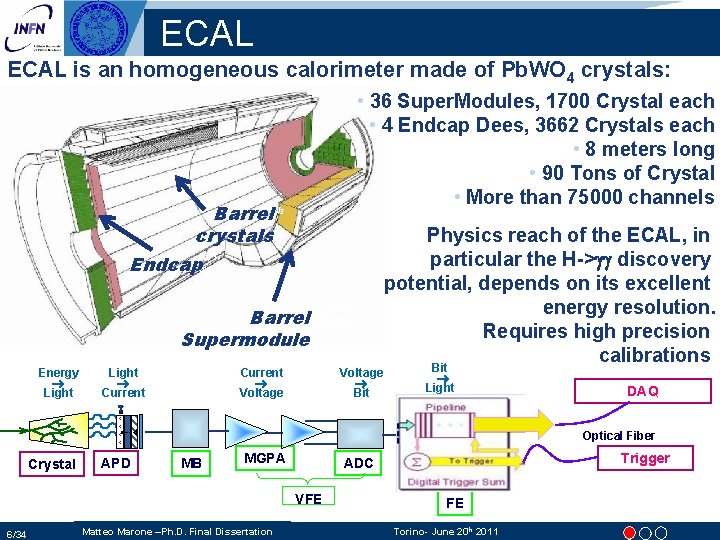
ECAL is an homogeneous calorimeter made of Pb. WO 4 crystals: • 36 Super. Modules, 1700 Crystal each • 4 Endcap Dees, 3662 Crystals each • 8 meters long • 90 Tons of Crystal • More than 75000 channels Barrel crystals Endcap Preshower Pb/Si Barrel Supermodule Energy ® Light Current ® Voltage Light ® Current Voltage ® Bit Physics reach of the ECAL, in particular the H-> discovery potential, depends on its excellent energy resolution. Requires high precision calibrations Bit ® Light DAQ Optical Fiber Crystal APD MB MGPA VFE 6/34 Matteo Marone –Ph. D. Final Dissertation Trigger ADC FE Torino- June 20 th 2011
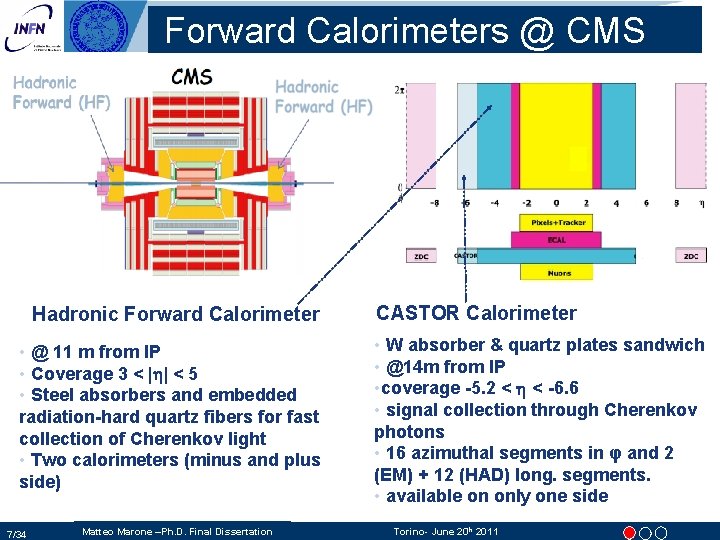
Forward Calorimeters @ CMS Hadronic Forward Calorimeter • @ 11 m from IP • Coverage 3 < |h| < 5 • Steel absorbers and embedded radiation-hard quartz fibers for fast collection of Cherenkov light • Two calorimeters (minus and plus side) 7/34 Matteo Marone –Ph. D. Final Dissertation CASTOR Calorimeter • W absorber & quartz plates sandwich • @14 m from IP • coverage -5. 2 < h < -6. 6 • signal collection through Cherenkov photons • 16 azimuthal segments in φ and 2 (EM) + 12 (HAD) long. segments. • available on only one side Torino- June 20 th 2011
ECAL Thermal stability: Hardware installation, calibration and commissioning 2008 2010 2009 Commissioning Read Out Software Development ECAL Thermal Stability Matteo Marone –Ph. D. Final Dissertation Torino- June 20 th 2011
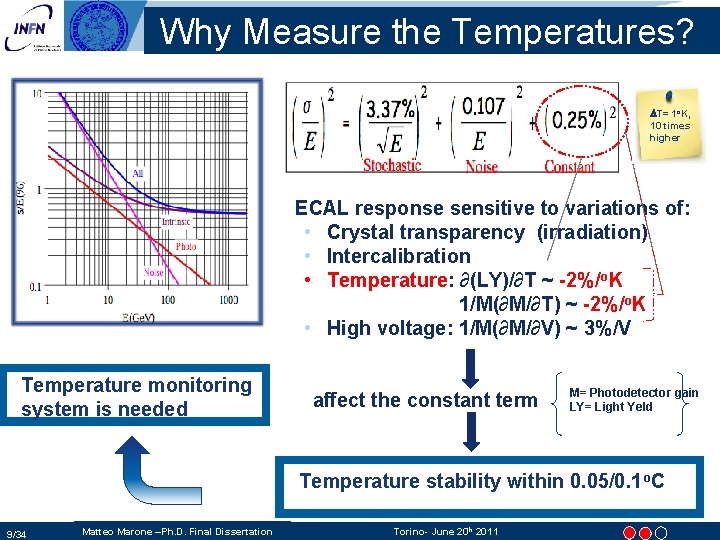
Why Measure the Temperatures? DT= 1 o. K, 10 times higher ECAL response sensitive to variations of: • Crystal transparency (irradiation) • Intercalibration • Temperature: ∂(LY)/∂T ~ -2%/o. K 1/M(∂M/∂T) ~ -2%/o. K • High voltage: 1/M(∂M/∂V) ~ 3%/V Temperature monitoring system is needed affect the constant term M= Photodetector gain LY= Light Yeld Temperature stability within 0. 05/0. 1 o. C 9/34 Matteo Marone –Ph. D. Final Dissertation Torino- June 20 th 2011
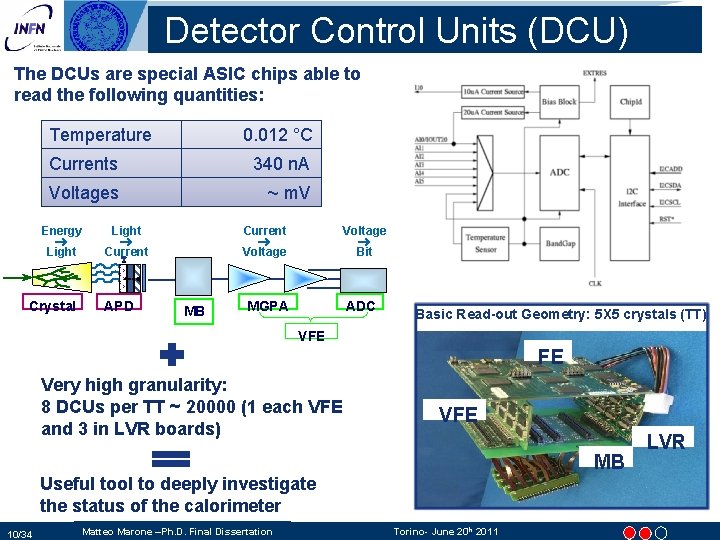
Detector Control Units (DCU) The DCUs are special ASIC chips able to read the following quantities: Temperature 0. 012 °C Currents 340 n. A Voltages ~ m. V Energy ® Light Crystal Light ® Current APD MB Current ® Voltage ® Bit MGPA ADC Basic Read-out Geometry: 5 X 5 crystals (TT) VFE FE Very high granularity: 8 DCUs per TT ~ 20000 (1 each VFE and 3 in LVR boards) VFE MB LVR Optical Fiber Useful tool to deeply investigate the status of the calorimeter 10/34 Matteo Marone –Ph. D. Final Dissertation Trigger Torino- June 20 th 2011
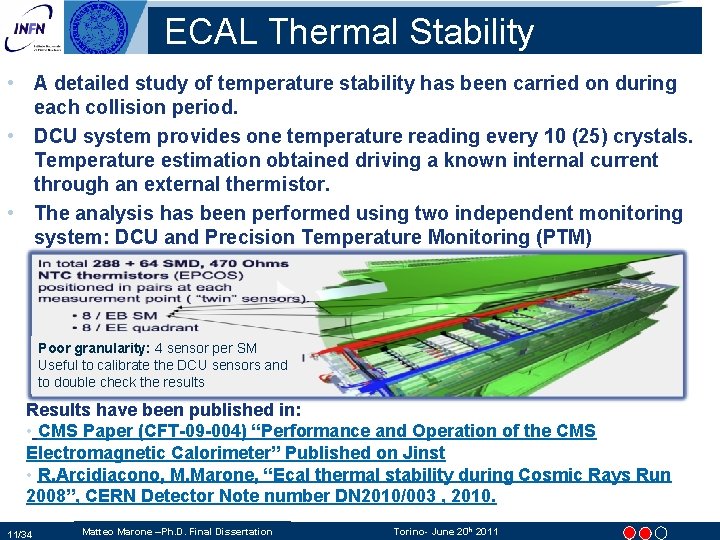
ECAL Thermal Stability • A detailed study of temperature stability has been carried on during each collision period. • DCU system provides one temperature reading every 10 (25) crystals. Temperature estimation obtained driving a known internal current through an external thermistor. • The analysis has been performed using two independent monitoring system: DCU and Precision Temperature Monitoring (PTM) Poor granularity: 4 sensor per SM Useful to calibrate the DCU sensors and to double check the results Results have been published in: • CMS Paper (CFT-09 -004) “Performance and Operation of the CMS Electromagnetic Calorimeter” Published on Jinst • R. Arcidiacono, M. Marone, “Ecal thermal stability during Cosmic Rays Run 2008”, CERN Detector Note number DN 2010/003 , 2010. 11/34 Matteo Marone –Ph. D. Final Dissertation Torino- June 20 th 2011
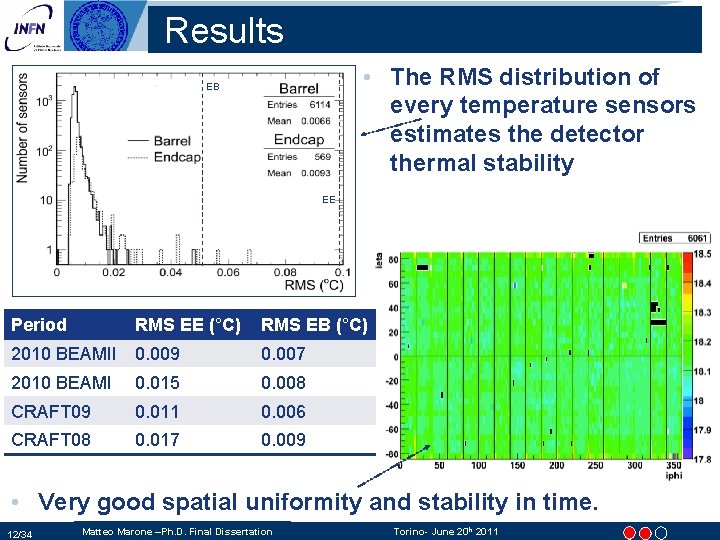
Results • The RMS distribution of every temperature sensors estimates the detector thermal stability EB EE Period RMS EE (°C) RMS EB (°C) 2010 BEAMII 0. 009 0. 007 2010 BEAMI 0. 015 0. 008 CRAFT 09 0. 011 0. 006 CRAFT 08 0. 017 0. 009 • Very good spatial uniformity and stability in time. 12/34 Matteo Marone –Ph. D. Final Dissertation Torino- June 20 th 2011
Results (2) • Integration of the DCU in the readout (online) software • Calibration of detector temperature thermistors • Measured the Barrel and Endcaps temperature stability to be within the specification (0. 05/0. 1 o. C). Measured the detector thermal time constant (in the “turn on” transition) to be ~2 hours in the barrel and ~6 in the Endcaps • Help the ECAL community to investigate front end problems (APD leakage, dead channels, . . ) using the DCU data “ECAL Front-End Monitoring in the CMS experiment” presented at CHEP 09: “International Conference On Computing In High Energy Physics And Nuclear Physics”, March 2009 13/34 Matteo Marone –Ph. D. Final Dissertation Torino- June 20 th 2011
Data Analysis: Measurement of the Inclusive Z->e+e- and Z->m+m- Cross Section 2008 2010 2009 Diffractive Z study Matteo Marone –Ph. D. Final Dissertation Torino- June 20 th 2011
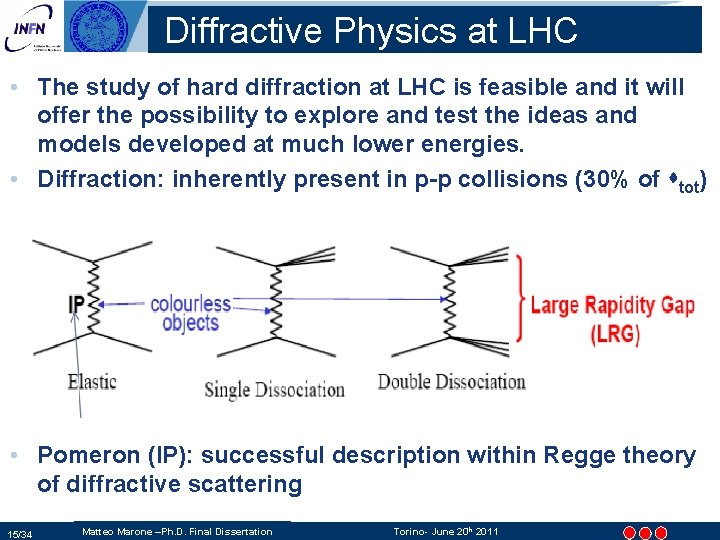
Diffractive Physics at LHC • The study of hard diffraction at LHC is feasible and it will offer the possibility to explore and test the ideas and models developed at much lower energies. • Diffraction: inherently present in p-p collisions (30% of tot) • Pomeron (IP): successful description within Regge theory of diffractive scattering 15/34 Matteo Marone –Ph. D. Final Dissertation Torino- June 20 th 2011
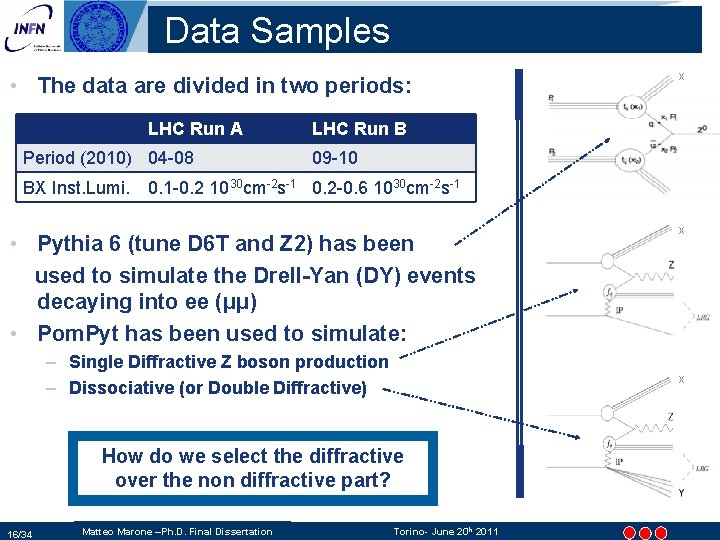
Data Samples • The data are divided in two periods: LHC Run A Period (2010) 04 -08 BX Inst. Lumi. LHC Run B 09 -10 0. 1 -0. 2 1030 cm-2 s-1 0. 2 -0. 6 1030 cm-2 s-1 • Pythia 6 (tune D 6 T and Z 2) has been used to simulate the Drell-Yan (DY) events decaying into ee (μμ) • Pom. Pyt has been used to simulate: – Single Diffractive Z boson production – Dissociative (or Double Diffractive) Matteo Marone –Ph. D. Final Dissertation X X How do we select the diffractive over the non diffractive part? 16/34 X Torino- June 20 th 2011
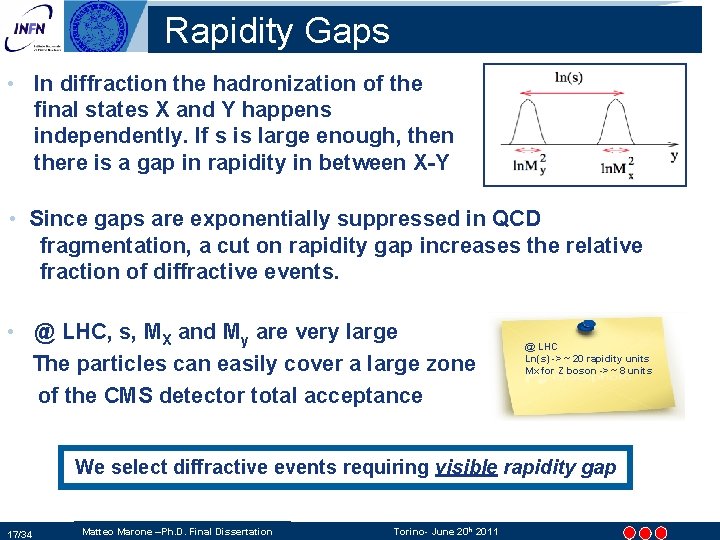
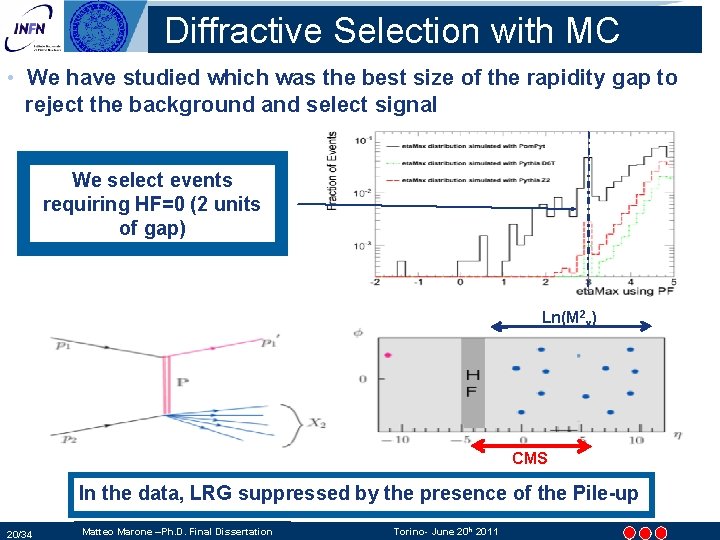
Rapidity Gaps • In diffraction the hadronization of the final states X and Y happens independently. If s is large enough, then there is a gap in rapidity in between X-Y • Since gaps are exponentially suppressed in QCD fragmentation, a cut on rapidity gap increases the relative fraction of diffractive events. • @ LHC, s, MX and My are very large The particles can easily cover a large zone of the CMS detector total acceptance @ LHC Ln(s) -> ~ 20 rapidity units Mx for Z boson -> ~ 8 units We select diffractive events requiring visible rapidity gap 17/34 Matteo Marone –Ph. D. Final Dissertation Torino- June 20 th 2011
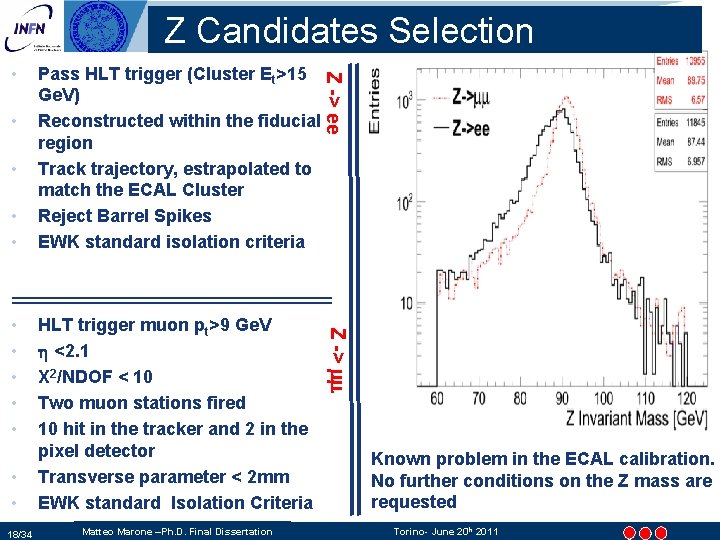
Z Candidates Selection • • • 18/34 HLT trigger muon pt>9 Ge. V h <2. 1 X 2/NDOF < 10 Two muon stations fired 10 hit in the tracker and 2 in the pixel detector Transverse parameter < 2 mm EWK standard Isolation Criteria Matteo Marone –Ph. D. Final Dissertation Z -> mm • • • Pass HLT trigger (Cluster Et>15 Ge. V) Reconstructed within the fiducial region Track trajectory, estrapolated to match the ECAL Cluster Reject Barrel Spikes EWK standard isolation criteria Z -> ee • Known problem in the ECAL calibration. No further conditions on the Z mass are requested Torino- June 20 th 2011
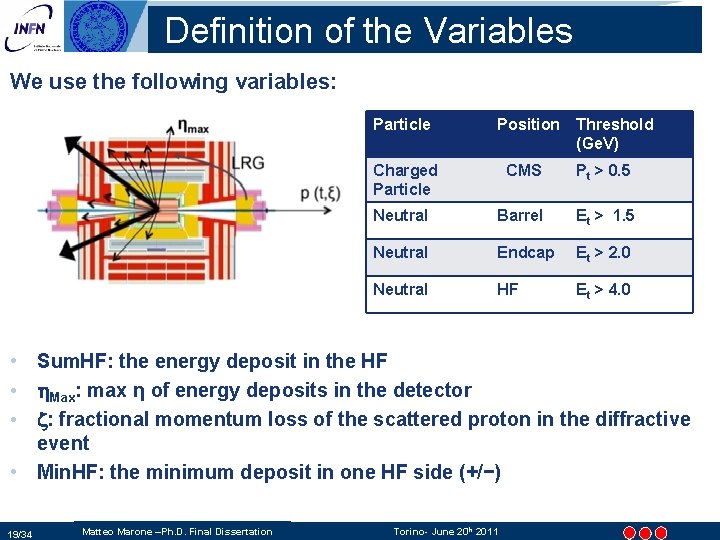
Definition of the Variables We use the following variables: Particle Position Threshold (Ge. V) Charged Particle CMS Pt > 0. 5 Neutral Barrel Et > 1. 5 Neutral Endcap Et > 2. 0 Neutral HF Et > 4. 0 • Sum. HF: the energy deposit in the HF • h. Max: max η of energy deposits in the detector • z: fractional momentum loss of the scattered proton in the diffractive event • Min. HF: the minimum deposit in one HF side (+/−) 19/34 Matteo Marone –Ph. D. Final Dissertation Torino- June 20 th 2011
Diffractive Selection with MC The conventional way to recognize a diffractive event is to look for rapidity gap in its particle flow. Since gaps are exponentially suppressed in QCD fragmentation 5, the cut on rapidity gap increases the relative fraction of diffractive events. • We have studied which was the best size of the rapidity gap to reject the background and select signal We select events requiring HF=0 (2 units of gap) Ln(M 2 x) CMS In the data, LRG suppressed by the presence of the Pile-up 20/34 Matteo Marone –Ph. D. Final Dissertation Torino- June 20 th 2011
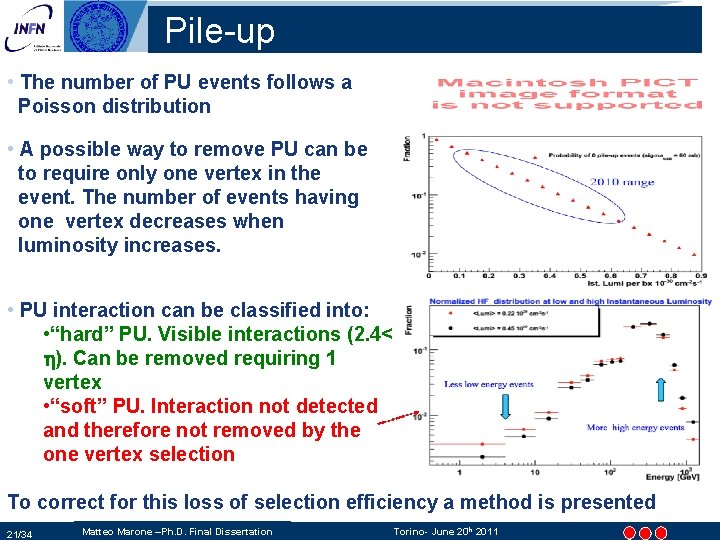
Pile-up • The number of PU events follows a Poisson distribution • A possible way to remove PU can be to require only one vertex in the event. The number of events having one vertex decreases when luminosity increases. • PU interaction can be classified into: • “hard” PU. Visible interactions (2. 4< h). Can be removed requiring 1 vertex • “soft” PU. Interaction not detected and therefore not removed by the one vertex selection To correct for this loss of selection efficiency a method is presented 21/34 Matteo Marone –Ph. D. Final Dissertation Torino- June 20 th 2011
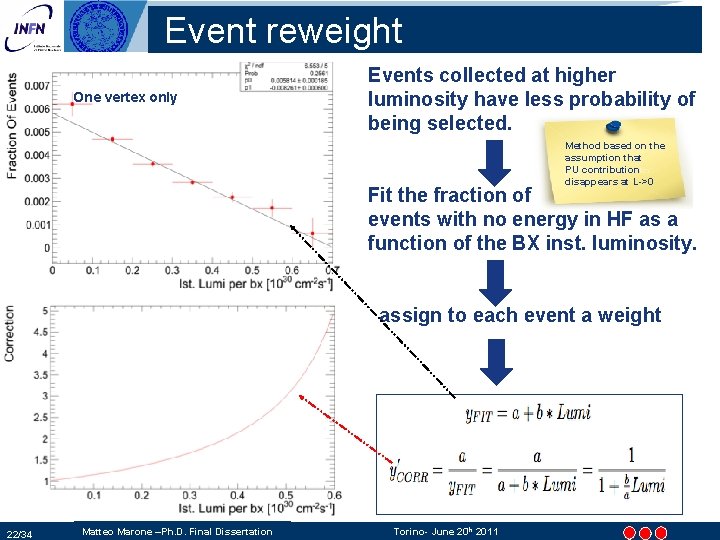
Event reweight The conventional way to recognize a diffractive event is to look for rapidity gap in its particle flow. Since gaps are exponentially suppressed in QCD fragmentation 5, the cut on rapidity gap increases the relative fraction of diffractive events. One vertex only Events collected at higher luminosity have less probability of being selected. Method based on the assumption that PU contribution disappears at L->0 Fit the fraction of events with no energy in HF as a function of the BX inst. luminosity. assign to each event a weight 22/34 Matteo Marone –Ph. D. Final Dissertation Torino- June 20 th 2011
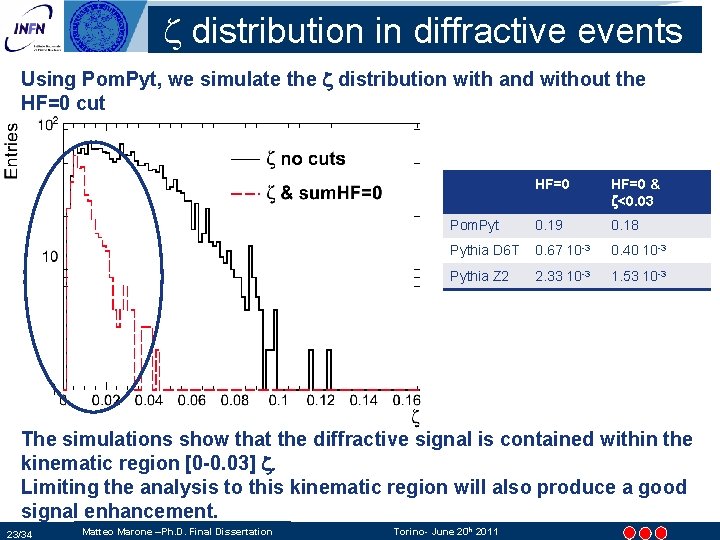
z distribution in diffractive events The conventional way to recognize a diffractive event is to look for rapidity gap in its particle flow. Since gaps are exponentially suppressed in QCD fragmentation 5, the cut on rapidity gap increases the relative fraction of diffractive events. Using Pom. Pyt, we simulate the z distribution with and without the HF=0 cut HF=0 & z<0. 03 Pom. Pyt 0. 19 0. 18 Pythia D 6 T 0. 67 10 -3 0. 40 10 -3 Pythia Z 2 2. 33 10 -3 1. 53 10 -3 The simulations show that the diffractive signal is contained within the kinematic region [0 -0. 03] z. Limiting the analysis to this kinematic region will also produce a good signal enhancement. 23/34 Matteo Marone –Ph. D. Final Dissertation Torino- June 20 th 2011
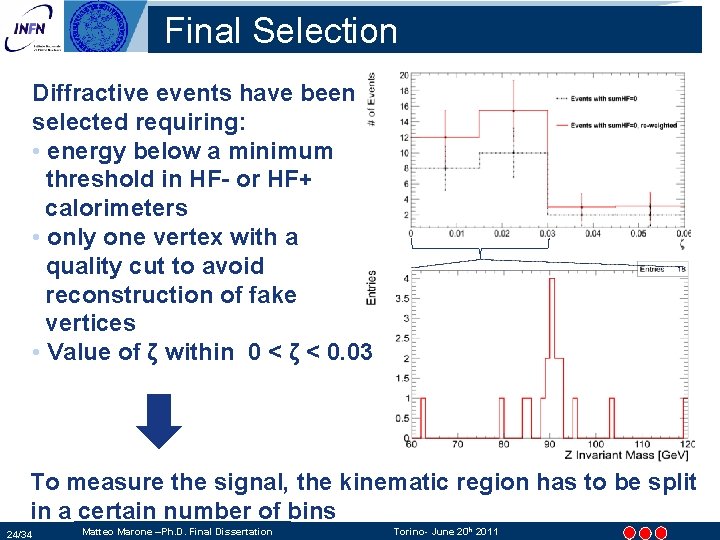
Final Selection Diffractive events have been selected requiring: • energy below a minimum threshold in HF- or HF+ calorimeters • only one vertex with a quality cut to avoid reconstruction of fake vertices • Value of ζ within 0 < ζ < 0. 03 To measure the signal, the kinematic region has to be split in a certain number of bins 24/34 Matteo Marone –Ph. D. Final Dissertation Torino- June 20 th 2011
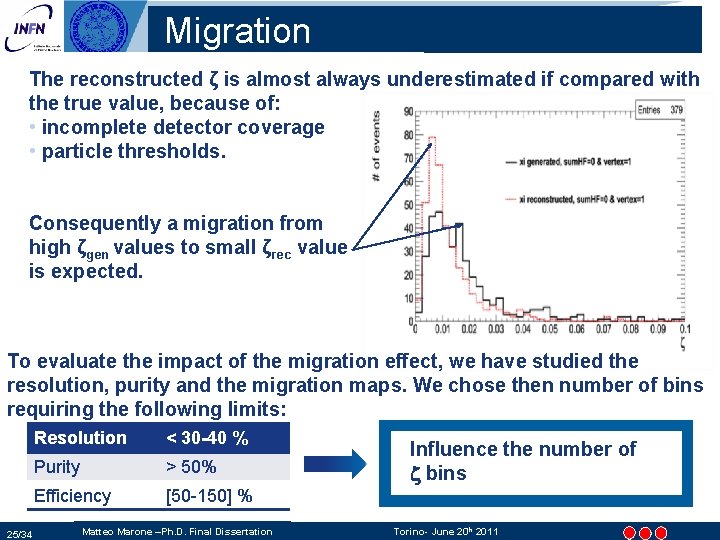
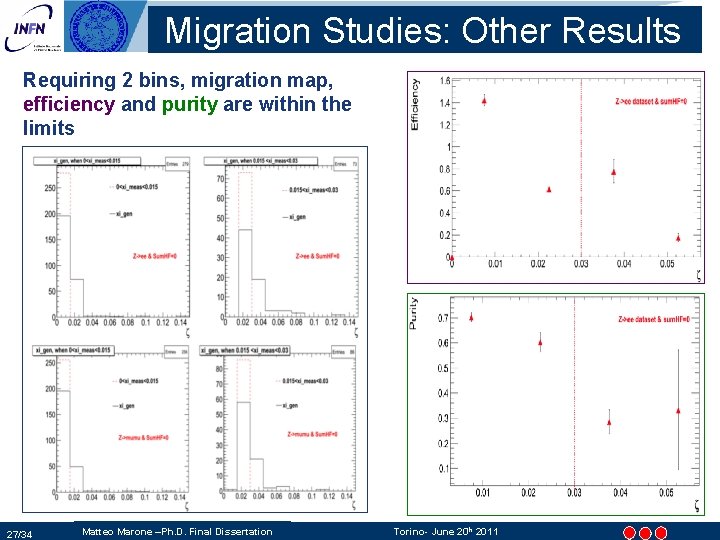
Migration The reconstructed ζ is almost always underestimated if compared with the true value, because of: • incomplete detector coverage • particle thresholds. Consequently a migration from high ζgen values to small ζrec value is expected. To evaluate the impact of the migration effect, we have studied the resolution, purity and the migration maps. We chose then number of bins requiring the following limits: 25/34 Resolution < 30 -40 % Purity > 50% Efficiency [50 -150] % Matteo Marone –Ph. D. Final Dissertation Influence the number of z bins Torino- June 20 th 2011
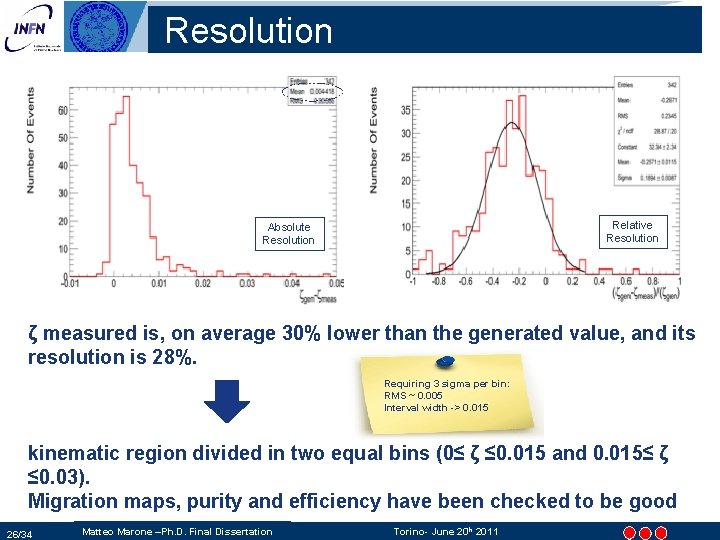
Resolution Relative Resolution Absolute Resolution ζ measured is, on average 30% lower than the generated value, and its resolution is 28%. Requiring 3 sigma per bin: RMS ~ 0. 005 Interval width -> 0. 015 kinematic region divided in two equal bins (0≤ ζ ≤ 0. 015 and 0. 015≤ ζ ≤ 0. 03). Migration maps, purity and efficiency have been checked to be good 26/34 Matteo Marone –Ph. D. Final Dissertation Torino- June 20 th 2011
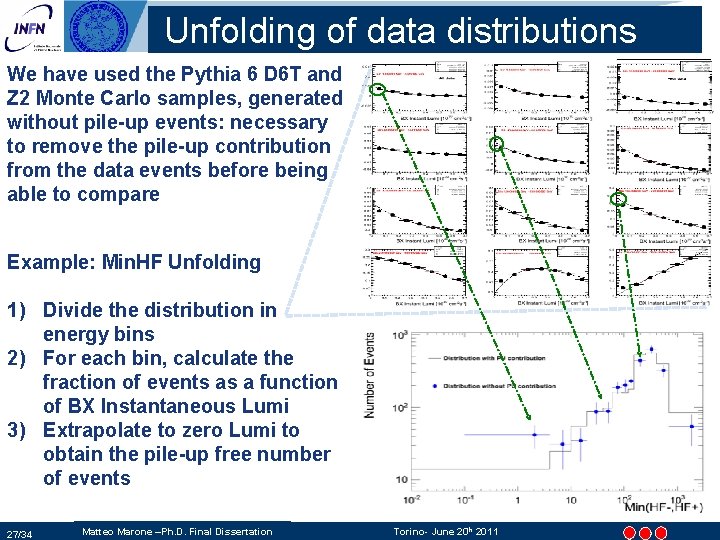
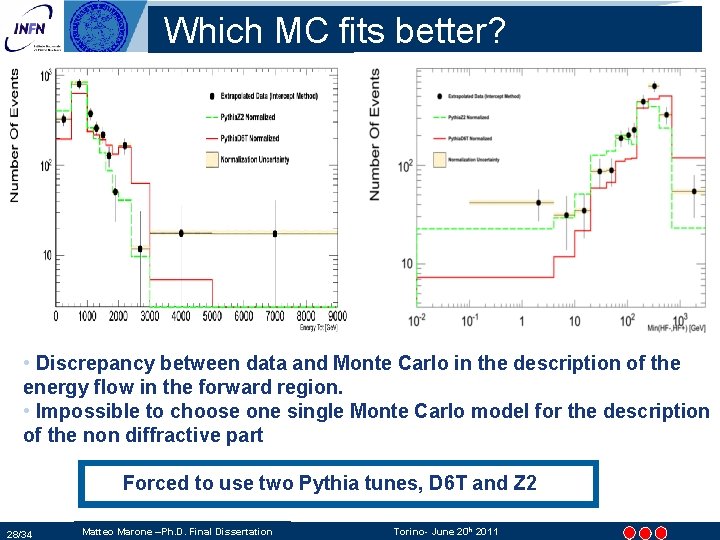
Unfolding of data distributions We have used the Pythia 6 D 6 T and Z 2 Monte Carlo samples, generated without pile-up events: necessary to remove the pile-up contribution from the data events before being able to compare Example: Min. HF Unfolding 1) Divide the distribution in energy bins 2) For each bin, calculate the fraction of events as a function of BX Instantaneous Lumi 3) Extrapolate to zero Lumi to obtain the pile-up free number of events 27/34 Matteo Marone –Ph. D. Final Dissertation Torino- June 20 th 2011
Which MC fits better? • Discrepancy between data and Monte Carlo in the description of the energy flow in the forward region. • Impossible to choose one single Monte Carlo model for the description of the non diffractive part Forced to use two Pythia tunes, D 6 T and Z 2 28/34 Matteo Marone –Ph. D. Final Dissertation Torino- June 20 th 2011
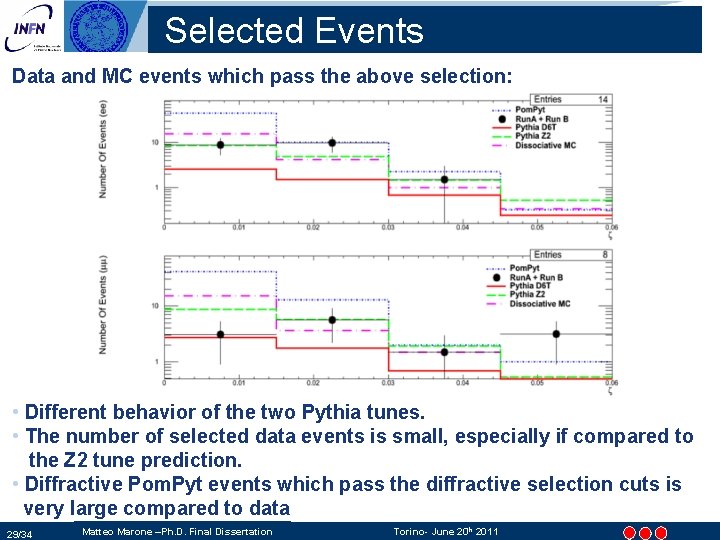
Selected Events Data and MC events which pass the above selection: • Different behavior of the two Pythia tunes. • The number of selected data events is small, especially if compared to the Z 2 tune prediction. • Diffractive Pom. Pyt events which pass the diffractive selection cuts is very large compared to data 29/34 Matteo Marone –Ph. D. Final Dissertation Torino- June 20 th 2011
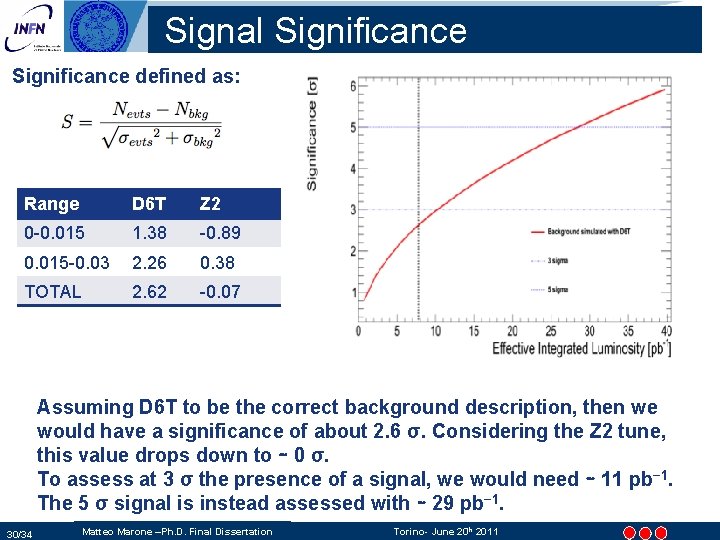
Signal Significance defined as: Range D 6 T Z 2 0 -0. 015 1. 38 -0. 89 0. 015 -0. 03 2. 26 0. 38 TOTAL 2. 62 -0. 07 ni Assuming D 6 T to be the correct background description, then we would have a significance of about 2. 6 σ. Considering the Z 2 tune, this value drops down to ∼ 0 σ. To assess at 3 σ the presence of a signal, we would need ∼ 11 pb− 1. The 5 σ signal is instead assessed with ∼ 29 pb− 1. 30/34 Matteo Marone –Ph. D. Final Dissertation Torino- June 20 th 2011
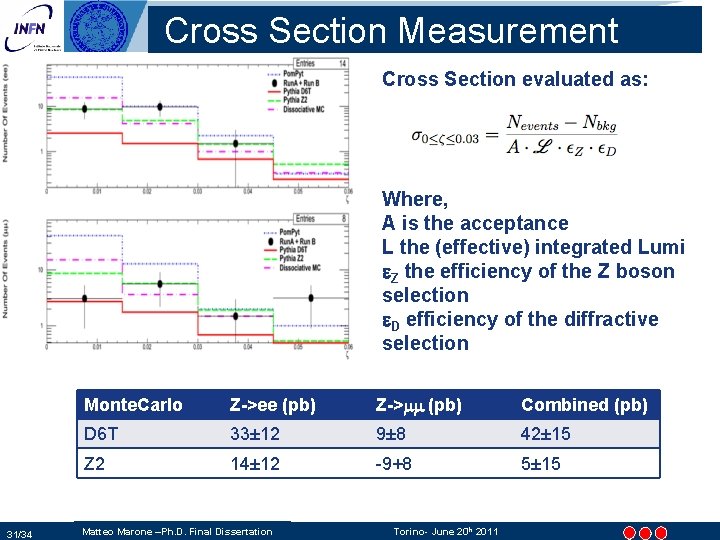
Cross Section Measurement Cross Section evaluated as: Where, A is the acceptance L the (effective) integrated Lumi e. Z the efficiency of the Z boson selection e. D efficiency of the diffractive selection 31/34 Monte. Carlo Z->ee (pb) Z->mm (pb) Combined (pb) D 6 T 33± 12 9± 8 42± 15 Z 2 14± 12 -9+8 5± 15 Matteo Marone –Ph. D. Final Dissertation Torino- June 20 th 2011
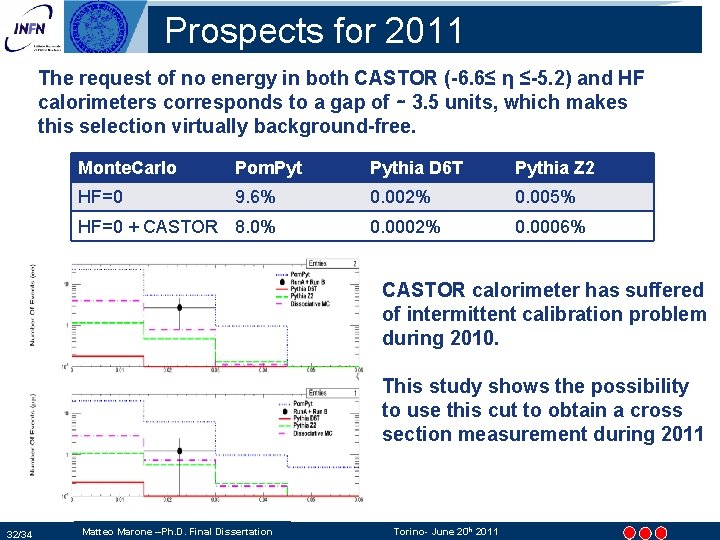
Prospects for 2011 The request of no energy in both CASTOR (-6. 6≤ η ≤-5. 2) and HF calorimeters corresponds to a gap of ∼ 3. 5 units, which makes this selection virtually background-free. Monte. Carlo Pom. Pythia D 6 T Pythia Z 2 HF=0 9. 6% 0. 002% 0. 005% 0. 0002% 0. 0006% HF=0 + CASTOR 8. 0% CASTOR calorimeter has suffered of intermittent calibration problem during 2010. This study shows the possibility to use this cut to obtain a cross section measurement during 2011 32/34 Matteo Marone –Ph. D. Final Dissertation Torino- June 20 th 2011
Conclusions • In this thesis we have proposed and employed a novel method to select diffractive events. • We have derived a weight function that weights diffractive events on the probability of having a rapidity gap at a given luminosity • The extraction of the diffractive signal from the events that pass our selection criteria is further complicated by the current discrepancy between data and Monte Carlo in the description of the energy flow in the forward region. • This mismatch, which is actually quite important, did not allow us to choose one single Monte Carlo model for the description of the non diffractive part but has forced us to use two Pythia tunes, D 6 T and Z 2, which bracket the range of uncertainties. 33/34 Matteo Marone –Ph. D. Final Dissertation Torino- June 20 th 2011
Conclusions (2) • Within these constrains, and due to the quite low luminosity, we were not able to establish the presence of diffractive Z production, but only to see a production excess over one of the two Pythia tunes prediction. • We are confident that the tools developed for this analysis can be applied to the much larger sample of the 2011 data, and we are looking forward to do the analysis in the next few months. 34/34 Matteo Marone –Ph. D. Final Dissertation Torino- June 20 th 2011
Spares Matteo Marone –Ph. D. Final Dissertation Torino- June 20 th 2011
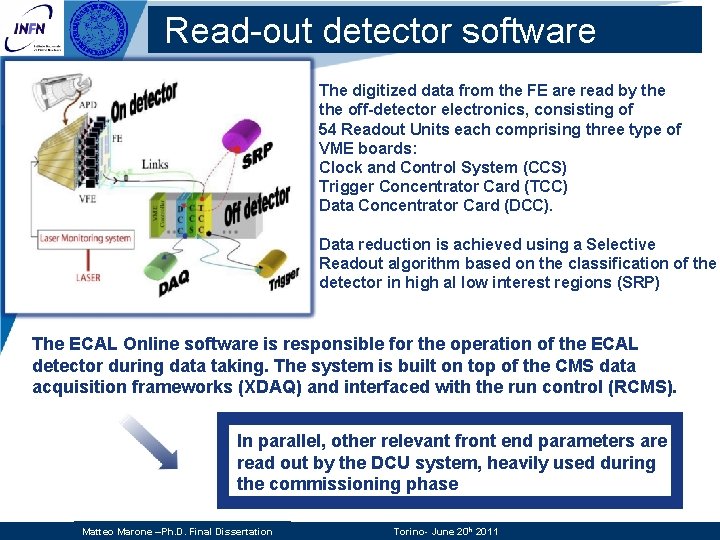
Read-out detector software The digitized data from the FE are read by the off-detector electronics, consisting of 54 Readout Units each comprising three type of VME boards: Clock and Control System (CCS) Trigger Concentrator Card (TCC) Data Concentrator Card (DCC). Data reduction is achieved using a Selective Readout algorithm based on the classification of the detector in high al low interest regions (SRP) The ECAL Online software is responsible for the operation of the ECAL detector during data taking. The system is built on top of the CMS data acquisition frameworks (XDAQ) and interfaced with the run control (RCMS). In parallel, other relevant front end parameters are read out by the DCU system, heavily used during the commissioning phase Matteo Marone –Ph. D. Final Dissertation Torino- June 20 th 2011
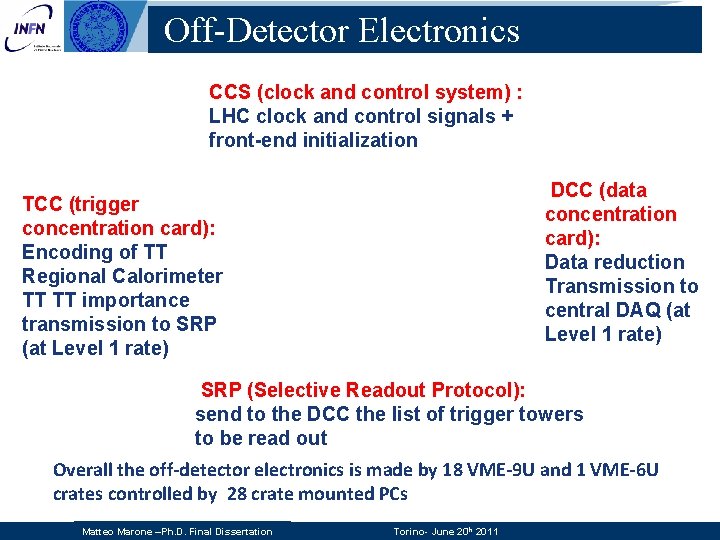
Off-Detector Electronics CCS (clock and control system) : LHC clock and control signals + front-end initialization DCC (data concentration card): Data reduction Transmission to central DAQ (at Level 1 rate) TCC (trigger concentration card): Encoding of TT Regional Calorimeter TT TT importance transmission to SRP (at Level 1 rate) SRP (Selective Readout Protocol): send to the DCC the list of trigger towers to be read out Overall the off-detector electronics is made by 18 VME-9 U and 1 VME-6 U crates controlled by 28 crate mounted PCs Matteo Marone –Ph. D. Final Dissertation Torino- June 20 th 2011
What is monitored APD: currents (1 DCU for xtal = 1700/SM) temperatures (1 DCU every 10 xtals = 170 values/SM): VFE & LVR: DCU internal temperatures (8 x 68 values /SM) MEM box: VDD_1, VDD_2, 2. 5 V, Vinj (4 X 2 values / SM) DCU internal temperatures (1 x 2 values /SM) LVR: 3 thermistors 2. 5 V (12 x 68 values / SM) 4. 3 V (2 X 68 values / SM) 0. 1 V – inhibit (1 X 68 values /SM) Matteo Marone –Ph. D. Final Dissertation Torino- June 20 th 2011
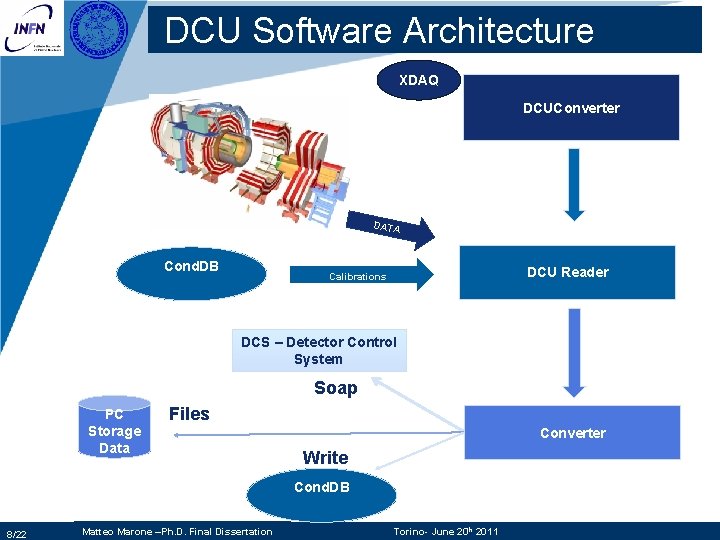
DCU Software Architecture XDAQ DCUConverter DATA Cond. DB DCU Reader Calibrations DCS – Detector Control System Soap PC Storage Data Files Converter Write Cond. DB 8/22 Matteo Marone –Ph. D. Final Dissertation Torino- June 20 th 2011
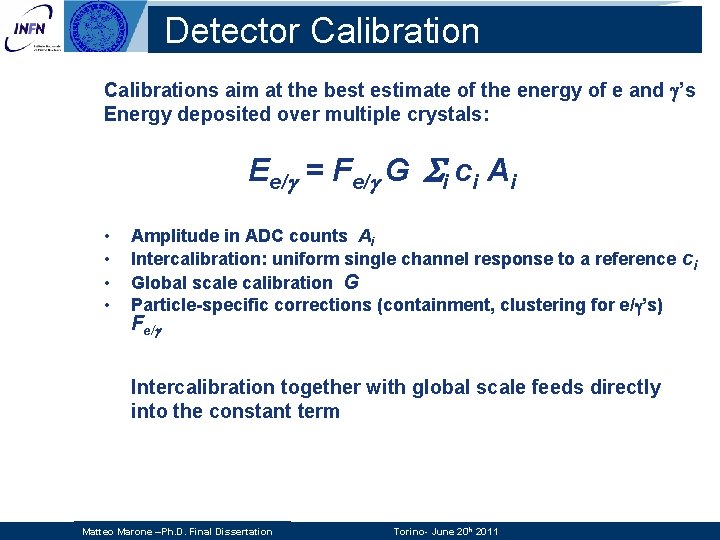
Detector Calibrations aim at the best estimate of the energy of e and ’s Energy deposited over multiple crystals: Ee/ = Fe/ G i ci Ai • • Amplitude in ADC counts Ai Intercalibration: uniform single channel response to a reference ci Global scale calibration G Particle-specific corrections (containment, clustering for e/ ’s) Fe/ Intercalibration together with global scale feeds directly into the constant term Matteo Marone –Ph. D. Final Dissertation Torino- June 20 th 2011
DCU graphical interface 14/28 Matteo Marone –Ph. D. Final Dissertation Torino- June 20 th 2011
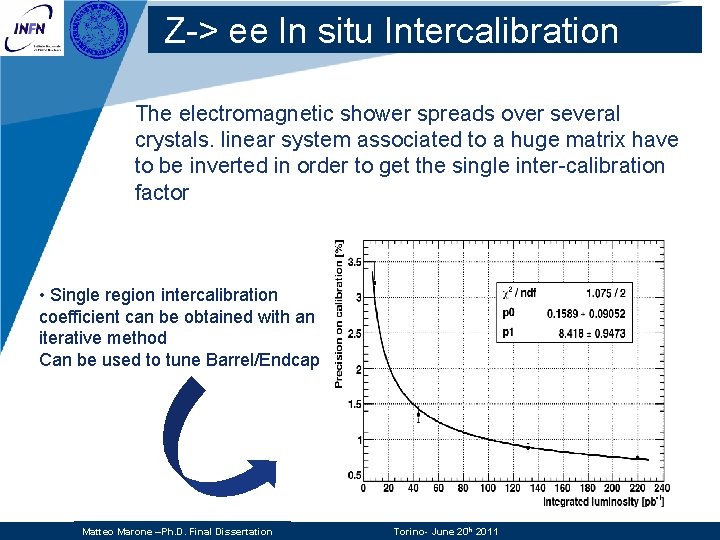
Z-> ee In situ Intercalibration The electromagnetic shower spreads over several crystals. linear system associated to a huge matrix have to be inverted in order to get the single inter-calibration factor • Single region intercalibration coefficient can be obtained with an iterative method Can be used to tune Barrel/Endcap Matteo Marone –Ph. D. Final Dissertation Torino- June 20 th 2011
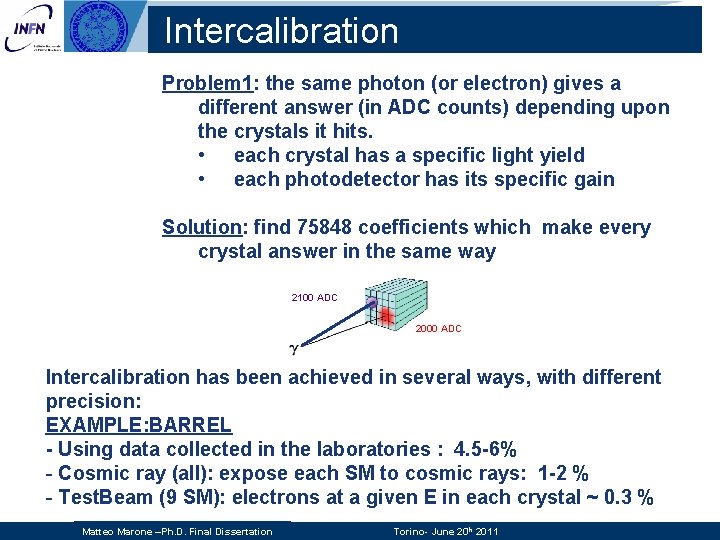
Intercalibration Problem 1: the same photon (or electron) gives a different answer (in ADC counts) depending upon the crystals it hits. • each crystal has a specific light yield • each photodetector has its specific gain Solution: find 75848 coefficients which make every crystal answer in the same way 2100 ADC 2000 ADC Intercalibration has been achieved in several ways, with different precision: EXAMPLE: BARREL - Using data collected in the laboratories : 4. 5 -6% - Cosmic ray (all): expose each SM to cosmic rays: 1 -2 % - Test. Beam (9 SM): electrons at a given E in each crystal ~ 0. 3 % Matteo Marone –Ph. D. Final Dissertation Torino- June 20 th 2011
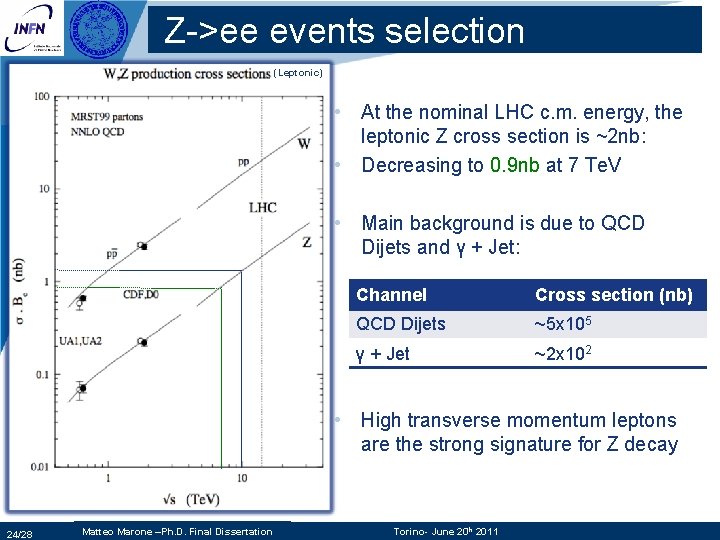
Z->ee events selection (Leptonic) • At the nominal LHC c. m. energy, the leptonic Z cross section is ~2 nb: • Decreasing to 0. 9 nb at 7 Te. V • Main background is due to QCD Dijets and γ + Jet: Channel Cross section (nb) QCD Dijets ~5 x 10⁵ γ + Jet ~2 x 10² • High transverse momentum leptons are the strong signature for Z decay 24/28 Matteo Marone –Ph. D. Final Dissertation Torino- June 20 th 2011
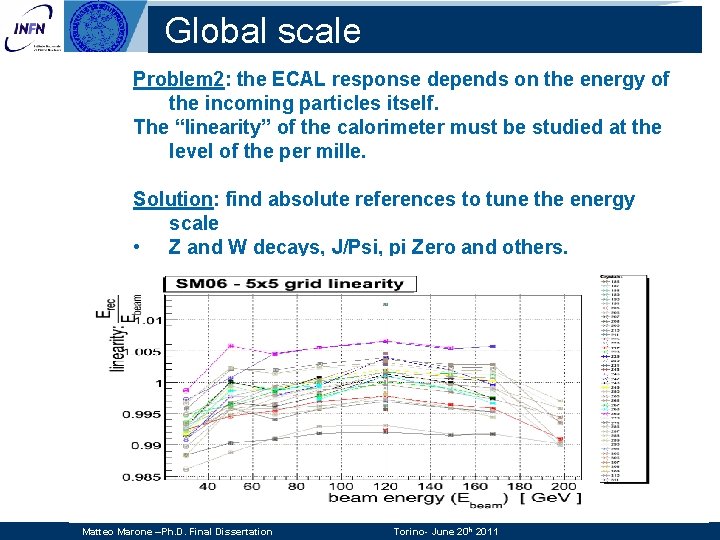
Global scale Problem 2: the ECAL response depends on the energy of the incoming particles itself. The “linearity” of the calorimeter must be studied at the level of the per mille. Solution: find absolute references to tune the energy scale • Z and W decays, J/Psi, pi Zero and others. Matteo Marone –Ph. D. Final Dissertation Torino- June 20 th 2011
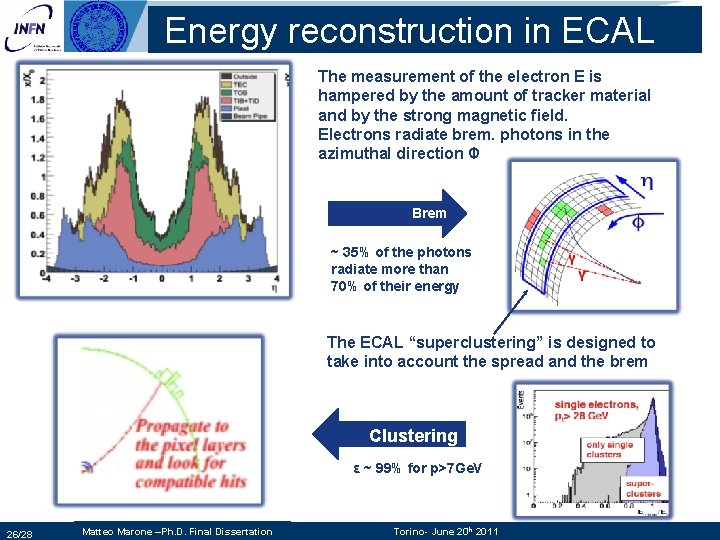
Energy reconstruction in ECAL The measurement of the electron E is hampered by the amount of tracker material and by the strong magnetic field. Electrons radiate brem. photons in the azimuthal direction Φ Brem ~ 35% of the photons radiate more than 70% of their energy The ECAL “superclustering” is designed to take into account the spread and the brem Clustering ε ~ 99% for p>7 Ge. V 26/28 Matteo Marone –Ph. D. Final Dissertation Torino- June 20 th 2011
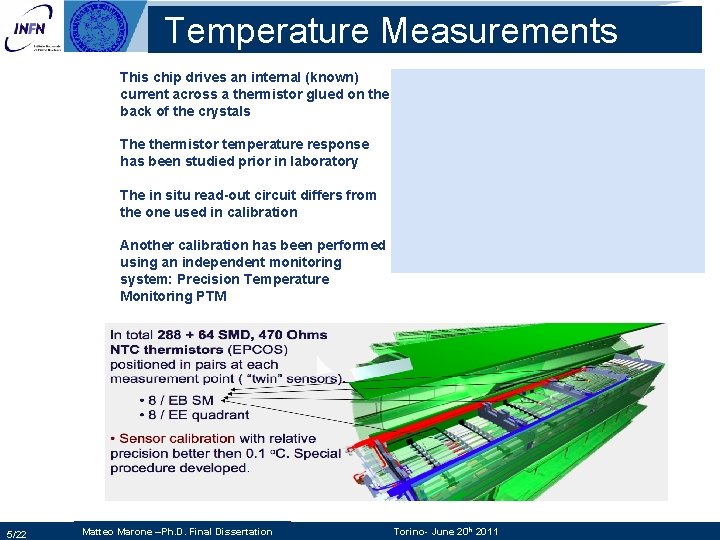
Temperature Measurements This chip drives an internal (known) current across a thermistor glued on the back of the crystals The thermistor temperature response has been studied prior in laboratory The in situ read-out circuit differs from the one used in calibration Another calibration has been performed using an independent monitoring system: Precision Temperature Monitoring PTM 5/22 Matteo Marone –Ph. D. Final Dissertation Torino- June 20 th 2011
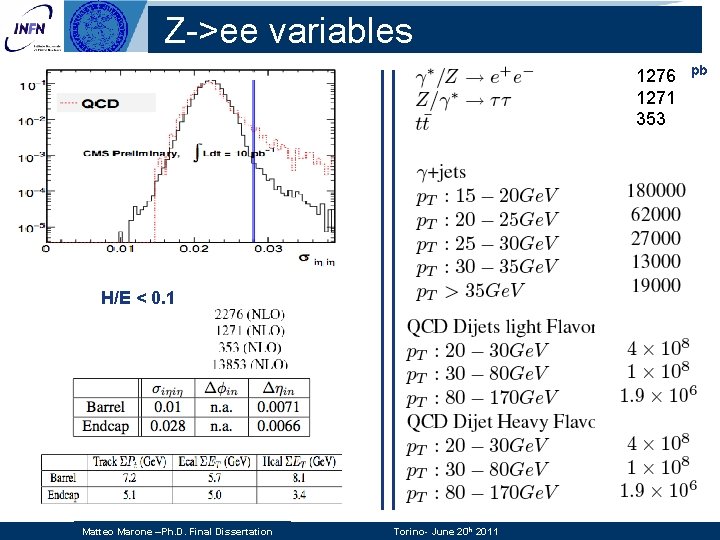
Z->ee variables 1276 1271 353 H/E < 0. 1 Matteo Marone –Ph. D. Final Dissertation Torino- June 20 th 2011 pb
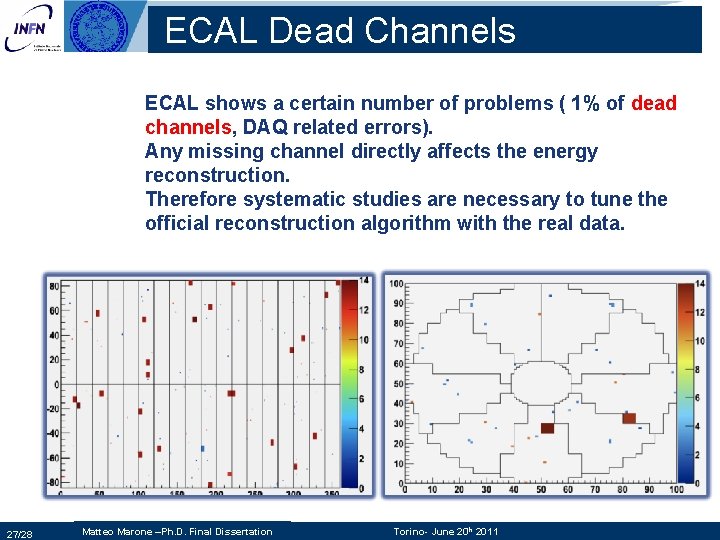
ECAL Dead Channels ECAL shows a certain number of problems ( 1% of dead channels, DAQ related errors). Any missing channel directly affects the energy reconstruction. Therefore systematic studies are necessary to tune the official reconstruction algorithm with the real data. 27/28 Matteo Marone –Ph. D. Final Dissertation Torino- June 20 th 2011
Cross Section Measurement • We measure the inelastic pp cross section using pile-up (PU) events: The probability of having npileup depends on the total s(pp) cross section. • The pile-up depends on the “Luminosity per bunch crossing (Lbx)”: max. during 2010 = ~0. 6 1030 cm-2 s-1 Cross checked using the number of triggers in each bunch (L * s = Nevents) • Pile up events are recorded by a high efficient stable trigger (e. g. Double ee, pt > 10 Ge. V) • The goal of the analysis is to count the number of vertices as a function of luminosity Matteo Marone –Ph. D. Final Dissertation Torino- June 20 th 2011
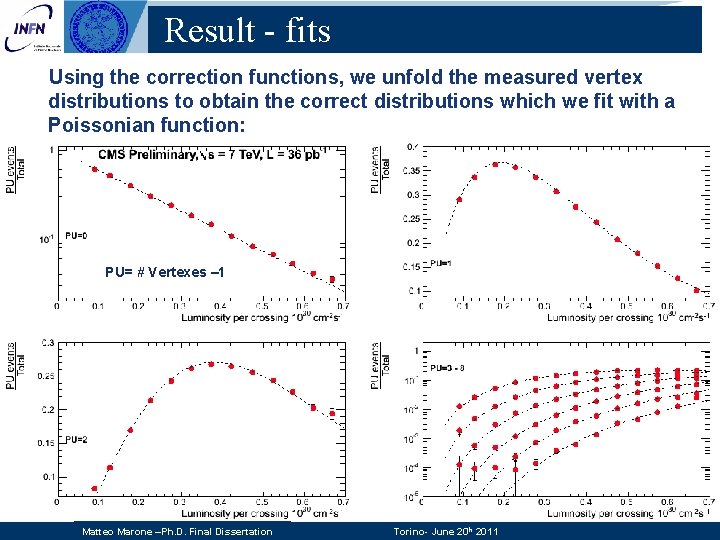
Result - fits Using the correction functions, we unfold the measured vertex distributions to obtain the correct distributions which we fit with a Poissonian function: PU= # Vertexes – 1 Matteo Marone –Ph. D. Final Dissertation Torino- June 20 th 2011
Results - Cross section For each of the PU distribution we obtain a value of the cross section and then these 9 values are averaged Matteo Marone –Ph. D. Final Dissertation Torino- June 20 th 2011
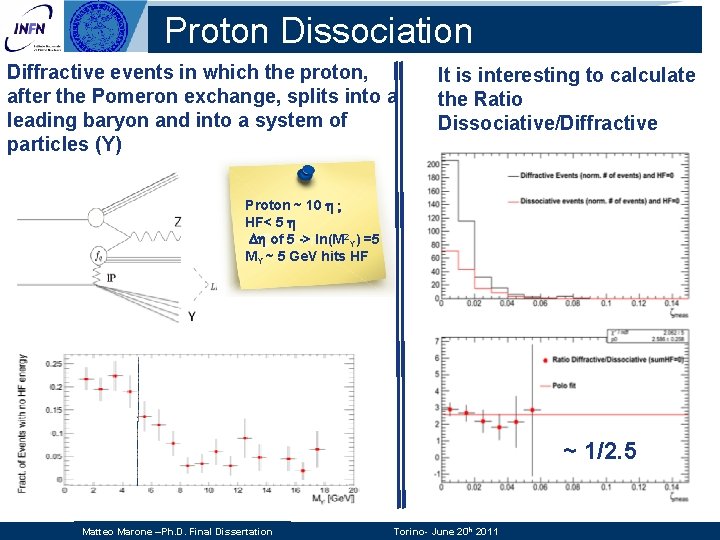
Proton Dissociation Diffractive events in which the proton, after the Pomeron exchange, splits into a leading baryon and into a system of particles (Y) It is interesting to calculate the Ratio Dissociative/Diffractive Proton ~ 10 h ; HF< 5 h Dh of 5 -> ln(M 2 Y) =5 MY ~ 5 Ge. V hits HF ~ 1/2. 5 Matteo Marone –Ph. D. Final Dissertation Torino- June 20 th 2011
Migration Studies: Other Results Requiring 2 bins, migration map, efficiency and purity are within the limits 27/34 Matteo Marone –Ph. D. Final Dissertation Torino- June 20 th 2011