STUDY DESIGNS OBSERVATIONAL STUDIES Dr KHADIJA N ABDULLAH

STUDY DESIGNS OBSERVATIONAL STUDIES Dr. KHADIJA N. ABDULLAH

What is a research design? It is the plan, structure, and strategy of research--the blueprint that will guide the research process.
")
CLASSIFICATION OF STUDY DESIGNS (cross-sectional)

Descriptive studies Ø Cross-sectional studies can be thought of as providing a snapshot of the frequency of a disease or other health related characteristics (e. g. exposure variables) in a population at a given point in time. Ø A cross-sectional survey may be purely descriptive and used to assess the burden of a particular condition in a defined population (Prevalence, frequency) and help in planning health services. Ø Descriptive/analytical cross-sectional studies are useful for establishing preliminary evidence for a causal relationship

No. of men of all ages who smoke in this village

Patients at a ward with lung cancer who smoke

Analytical studies A. Cross-sectional • The investigator measures the outcome and the exposure in the study participants at the same time. • These studies differ from solely descriptive cross-sectional studies in that they compare the proportion of exposed persons who are diseased with the proportion of non-exposed persons who are diseased.

lifestyle CHD

Common measures Ø Prevalence Ø Frequencies
 50 (a) 200")
Life style CHD present CHD absent Total Not active (P 1) 50 (a) 200 (b) 250 Active (P 2) 50 ( c) 700 (d) 750 Total (P) 100 900 1000 P = 100/1000* 100 = 10 % P 1= a/a+b * 100= 50/250 * 100 = 20 % (among subjects not active) P 2= c/c+d* 100= 50/750* 100 = 6. 7 % (among active subjects)

Analytical studies
 is used in case-control studies to estimate the")
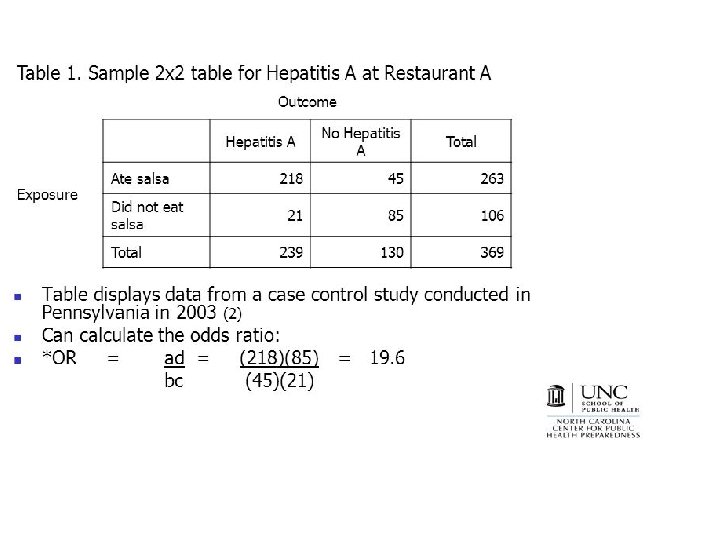
Measures Ø The odds ratio (OR) is used in case-control studies to estimate the strength of the association between exposure and outcome. Ø Case-control studies may prove an association but they do not demonstrate causation.
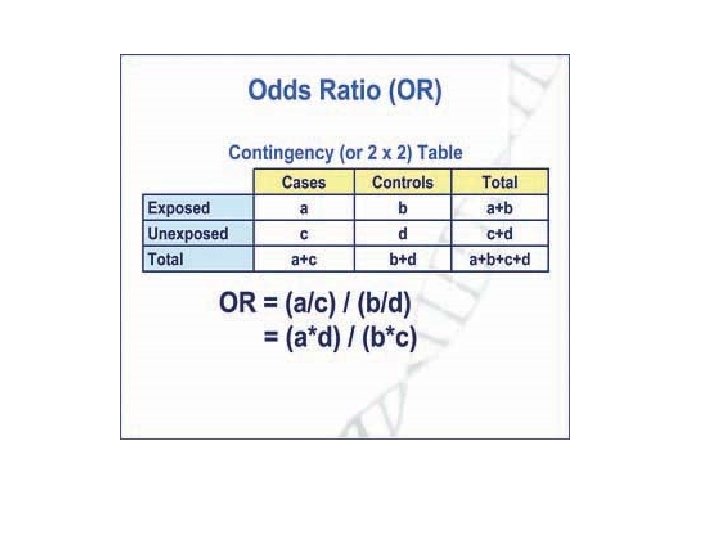
 indicates that the odds")
Ø OR of 1. 0 (or close to 1. 0) indicates that the odds of exposure among case-patients are the same as, or similar to, the odds of exposure among controls. The exposure is not associated with the disease. Ø Greater than 1. 0 indicates that the odds of exposure among casepatients are greater than the odds of exposure among controls. The exposure might be a risk factor for the disease. Ø Less than 1. 0 indicates that the odds of exposure among casepatients are lower than the odds of exposure among controls. The exposure might be a protective factor against the disease. Ø The magnitude of the odds ratio is called the “strength of the association. ” The further away an odds ratio is from 1. 0, the more likely it is that the relationship between the exposure and the disease is causal.
")
Analytical studies *Establishes cause –effect association (temporal association)

Measures: ØIncidence rates ØRelative risk ØAttributable risk
")
Cigarette smoking Developed lung Did not develop cancer lung cancer Total Yes 70 (a) 6930 (b) 7000 (a + b) No 3 (c ) 2997 (d) 3000 (c + d) Incidence rate among smokers = a/a+ b = 70/7000 = 10 per 1000 Incidence rate among non-smokers = c/c + d =3/3000 = 1 per 1000 Relative risk (RR) = Incidence of disease among exposed/ incidence of disease among non-exposed =10/1 = 10 (what does this mean ? ) Attributable risk = incidence among exposed- incidence among non-exposed/ incidence among exposed *100 = 10 -1/10 * 100 = 90 % (what does this mean ? )

LETS APPLY NOW: 1. Study on breast feeding and IQ 2. Study on vaccination 3. Study on fractures among children
- Slides: 19