Student Health and Human Services Pupil Services Teaching


- Slides: 42

Student Health and Human Services Pupil Services Teaching and Reinforcing Attendance & Enrollment Superintendent Update LOCAL DISTRICT SOUTH Pupil Services November 2016

Objectives • LAUSD 2016 -17 Attendance Goals • Attendance Data Overview • 2015 -16 Year-End Attendance • 2016 -17 Year-to-Date Attendance • Strategies, Tools and Resources to promote attendance • Next Steps

LCAP Attendance Goals 2016 -17 2015 -16 Goals: • • 71% (96% or higher) 10% (Chronic) The 2016 -17 District attendance goal is for: • 73% of students to maintain an attendance rate of 96% or higher throughout the school year • Less than 11% of students to be chronically absent (missing 9% or more of the school year)

Understanding the LCAP Attendance Goal For students who attend the entire 180 -day school year: • Students cannot miss more than 7 days all year to maintain Proficient/Advanced Attendance (96% or more) • Students who miss 15 days or more are considered chronically absent.

Understanding the LCAP Attendance Goal (continued) • To maintain Proficient/Advanced Attendance, students may miss no more than 1 day for every 25 days enrolled. See Tool #1 Handout How many days can a student miss to still be considered as having Prof/Adv attendance by the end of November? *Please note that these breakdowns apply to students who have been enrolled continuously since the first day of school. Students who enroll late will have fewer days of instruction, and must therefore miss fewer days of school to maintain a 96% attendance rate.

Importance of Attendance Submittal • Student attendance defaults to “Absent” if attendance is not submitted • We are reporting lower attendance because of this rule. • Schools are not changing absences to tardies: • Ensure students who are arrive late to class are changed from Absent Tardy • In order for attendance to be submitted, staff must click “Submit Attendance” and “OK” to certify

Attendance Data Attendance Tools and Resources

Attendance Submittal Rate by Local District, Cumulative through October 2016 100. 00% 99. 85% 99. 80% 99. 71% 99. 60% 99. 46% 99. 43% NE 99. 47% 99. 40% NW E C 99. 22% 99. 20% W 99. 11% S District YTD 99. 00% District 15 -16 98. 80% 98. 60% NE NW E C W S District YTD District 15 -16 GOAL: 100% submittal For additional information and resources regarding attendance submittal visit http: //achieve. lausd. net/Page/10104 - a the Pupil Services webpage Source: LAUSD Ad Hoc Report Monthly Data YTD thru October 31, 2016

LD South Monthly Attendance 2 -Year Comparison Year-to-Date 100. 0% 97. 9% 97. 3% 98. 0% 96. 7% 96. 5% 96. 3% 95. 7% 95. 9% 96. 0% 95. 6% 94. 8% 94. 6% 95. 5% 94. 8% 94. 0% 92. 0% 91. 0% 90. 0% 88. 0% N E JU M AY C H R IL AP U BR M AR Y Source: Mi. S Monthly Data YTD 2 -Yr Comparison thru October 31, 2016 FE N U JA BE D EC EM M VE O N AR R R BE TO C O PT SE AU G U EM BE ST R 86. 0% 2015 -2016 -2017

Attendance Bands by Local District Cumulative Year-End (2015 -16): 71% Prof/Adv Target Proficient/Advanced LCAP TARGET= 71% LD - CENTRAL 14. 0% LD - EAST 14. 2% LD - NORTHEAST 12. 5% LD - NORTHWEST 11. 4% 15. 6% 70. 4% 16. 6% 69. 2% 16. 6% 70. 9% 16. 9% 71. 7% LD - SOUTH 16. 1% 17. 5% 66. 5% LD - WEST 15. 4% 17. 7% 66. 9% LAUSD 14. 0% 16. 8% 91% and Below (Chronic) Source: My. Data Cumulative Data Year-End 2015 -16 69. 3% 92 - 95% (Basic) 96 -100% (Proficient and Advanced)

Attendance Bands by Local District Cumulative Year-End (2015 -16): 10% Chronic Abs Target Chronic Absences LCAP TARGET= 10%% LD - CENTRAL 14. 0% LD - EAST 14. 2% LD - NORTHEAST 12. 5% LD - NORTHWEST 11. 4% 15. 6% 70. 4% 16. 6% 69. 2% 16. 6% 70. 9% 16. 9% 71. 7% LD - SOUTH 16. 1% 17. 5% 66. 5% LD - WEST 15. 4% 17. 7% 66. 9% LAUSD 14. 0% 16. 8% 91% and Below (Chronic) Source: My. Data Cumulative Data Year-End 2015 -16 69. 3% 92 - 95% (Basic) 96 -100% (Proficient and Advanced)

Attendance Bands by Local District Cumulative YTD thru October 2016 Chronic Absences LCAP TARGET= 11%% Proficient/Advanced LCAP TARGET= 73% LD - NORTHEAST 9. 3% 11. 5% 79. 1% LD - NORTHWEST 8. 9% 11. 3% 79. 9% LD - EAST 10. 4% LD - CENTRAL 11. 3% LD - WEST 12. 2% 12. 4% 75. 4% LD - SOUTH 12. 1% 12. 6% 75. 3% LAUSD 10. 7% 11. 6% 77. 1% 11. 9% 91% and Below (Chronic) Source: My. Data Cumulative Data YTD 2016 -17 78. 0% 77. 4% 92 - 95% (Basic) 96 - 100% (Proficient & Advanced)

District-Wide Attendance Bands by Grade Level Cumulative YTD (2016 -17) Chronic Absence Goal: Prof/Adv Goal: No more than 11% At least 73% TK EXTENDED 18. 9% TRANSITIONAL KINDERGARTEN 19. 3% KINDERGARTEN FIRST GRADE SECOND GRADE 18. 5% 62. 6% 16. 8% 15. 2% 63. 9% 16. 0% 11. 6% 68. 8% 13. 9% 9. 9% 74. 5% 12. 7% 77. 4% THIRD GRADE 8. 9% 12. 0% 79. 1% FOURTH GRADE 8. 5% 11. 7% 79. 8% FIFTH GRADE 8. 6% 11. 6% 79. 9% SIXTH GRADE 7. 6% 10. 0% 82. 4% SEVENTH GRADE 8. 2% 9. 9% 81. 9% EIGHTH GRADE 8. 3% 9. 5% 82. 1% NINTH GRADE 12. 5% 9. 9% 77. 6% TENTH GRADE 12. 8% 11. 2% 75. 9% ELEVENTH GRADE 12. 6% 10. 9% 76. 5% TWELFTH GRADE 12. 3% 11. 2% 76. 5% Grand Total 10. 7% 11. 9% 91% and Below (Chronic) Source: My. Data Cumulative Data YTD 2016 -17 Thru October 31, 2016 92 - 95% (Basic) 77. 4% 96 - 100% (Proficient & Advanced)

Local District South Attendance Bands by Grade Level Cumulative YTD (2016 -17) Chronic Absence Goal: Prof/Adv Goal: No more than 11% At least 73% TK EXTENDED 18. 7% TRANSITIONAL KINDERGARTEN 21. 1% KINDERGARTEN FIRST GRADE SECOND GRADE 17. 0% 17. 7% 17. 6% FOURTH GRADE 10. 1% FIFTH GRADE 10. 0% SIXTH GRADE 8. 7% 65. 3% 14. 9% 11. 7% 10. 5% 61. 2% 17. 1% 13. 8% THIRD GRADE 64. 3% 71. 3% 13. 2% 75. 1% 13. 7% 75. 9% 12. 9% 77. 0% 12. 2% 77. 8% 11. 3% 79. 9% SEVENTH GRADE 10. 5% 10. 3% 79. 2% EIGHTH GRADE 10. 6% 10. 8% 78. 7% NINTH GRADE TENTH GRADE ELEVENTH GRADE 12. 9% 9. 7% 13. 9% 11. 1% TWELFTH GRADE 12. 4% Grand Total 12. 1% 11. 1% 75. 1% 9. 8% 79. 0% 10. 3% 77. 2% 91% and Below (Chronic) Source: My. Data Cumulative Data YTD 2016 -17 Thru October 31, 2016 77. 5% 12. 6% 92 - 95% (Basic) 75. 3% 96 - 100% (Proficient & Advanced)

Local District South Attendance Bands by Language Classification Cumulative YTD (2016 -17) Chronic Absence Goal: No more than 11% Prof/Adv Goal: At least 73% ENGLISH ONLY 14. 5% 14. 3% 71. 2% N = 43, 422 INITIALLY FLUENT ENGLISH PROFICIENCY 7. 6% 9. 0% 83. 4% N = 6, 483 LIMITED ENGLISH PROFICIENCY 11. 9% 13. 3% 74. 8% N = 22, 804 RECLASSIFIED FLUENT ENGLISH PROFICIENCY 7. 6% 8. 8% 83. 6% N = 18, 083 91% and Below (Chronic) Source: My. Data Cumulative Data YTD 2016 -17 Thru October 31, 2016 92 - 95% (Basic) 96 - 100% (Proficient & Advanced)

Local District South Attendance Bands Comparison by Poverty Indicator YTD (2016 -17) Chronic Absence Goal: Prof/Adv Goal: No more than 11% At least 73% YES 12. 9% 13. 1% 74. 0% N= 59, 601 NO 10. 2% 11. 6% 78. 2% N= 31, 298 91% and Below (Chronic) Source: My. Data Cumulative Data YTD 2016 -17 Thru October 31, 2016 92 - 95% (Basic) 96 - 100% (Proficient & Advanced)

Local District South Attendance Bands Comparison by Foster Youth Population YTD (2016 -17) Chronic Absence Goal: Prof/Adv Goal: No more than 11% At least 73% LD South 12. 0% 12. 5% 75. 5% N = 90, 899 Foster Youth 25. 4% 18. 3% 56. 3% N = 1, 638 91% and Below (Chronic) Source: My. Data (LAUSD count includes Foster youth) Cumulative Data YTD 2016 -17 Thru October 31, 2016 92 - 95% (Basic) 96 - 100% (Proficient & Advanced)

LOOKING AHEAD: DISTRICT-WIDE NOVEMBER 2015 FULL DAY ABSENCE COUNTS Week of Mon Tues Wed Thurs Fri Weekly Totals Nov 2 -6 23, 170 19, 195 18, 049 18, 954 23, 665 103, 033 Nov 9 -13 24, 882 20, 544 20, 454 24, 391 90, 271 Nov 16 -20 29, 345 21, 664 20, 021 20, 225 26, 823 118, 078 Nov 23 -27 24 27 30 Totals 77, 421 61, 430 38, 100 81 59, 633 Estimated Revenue Loss = Source: My. Data Daily Absences 2015 -16 74, 879 311, 463 $10, 172, 072 Full Day Absences multiplied by $29. 70/day per student

LOOKING AHEAD: DISTRICT-WIDE DECEMBER 2015 FULL DAY ABSENCE COUNTS Week of Mon Tues Wed Thurs Fri Weekly Totals Nov 30 -Dec 4 31, 031 23, 841 21, 514 22, 197 26, 064 124, 647 Dec 7 -11 28, 938 24, 030 22, 546 22, 903 26, 926 125, 343 Dec 14 -18 29, 393 37, 395 28, 503 54, 605 149, 896 Totals 89, 362 81, 455 73, 603 107, 595 399, 886 47, 871 Estimated Revenue Loss = Source: My. Data Daily Absences 2015 -16 $10, 954, 994 Full Day Absences multiplied by $29. 70/day per student

Attendance Strategies (Teach and Reinforce) Ensure Accurate Attendance-taking. Prevent Absenteeism. Promote Attendance during the Holiday months with Incentives.

Plan for Attendance & Dropout Prevention Plan Safe School Plan: Chapters 5 b and 7 § Ensure procedures are in place for all categories § Communicate your clear attendance and tardy policy regularly with staff, students, parents using a variety of methods (phone, assemblies, meetings, bulletin boards, newsletters, etc. ) § Promote staff and student attendance with incentives § Intervene with students and staff as necessary to minimize absences

Attendance Improvement Tools and Resources Attendance Tools and Resources

Communicate Attendance Expectations § See Tool #2 “Parent/Guardian Sample Letter” and Tool #3 “Sample Newsletter”:

Ensure Accurate Attendance-Taking § § Ensure 100% attendance submittal by all teachers. Run ANS reports twice daily (e. g. , 9: 30 am and 3 pm). Remind staff by PA, phone, memo from administrator (on Mi. S from ANS Report) See Tool #4 “Attendance Strategies” Tool for teacher memo: MISIS TEACHER MEMO RE: ANS Memo reads: “The system is showing that attendance records below are incomplete or have not been submitted on the specified dates…” Choose YES on “Print Teacher Memo”

Ensure Accurate Attendance-Taking (continued) § Run Discrepancy report twice daily (secondary schools) § Ensure records are updated § Tardies (change absences to tardies) § L-out on last date of attendance § Enter appropriate absence codes, clear absences § SAA reviews Student Monthly Attendance Summary Report (SMASR) at least monthly for errors § See Tool #5 “Attendance Submittal Memo Sample” Tool for teacher memo: SAMPLE TEACHER MEMO

Prevent Absenteeism § Remind staff and students that attendance is mandatory, especially on dates with high absenteeism: § Friday, November 18 and Monday, November 28 (Day before and after the Thanksgiving break) § Friday, December 16 and Monday, January 9 (Day before and after the Winter break) § Friday, January 13 and Tuesday, January 17 (Day before and after MLK Holiday) § Friday, February 17 and Tuesday, February 21 (Day before and after President’s Day) § Friday, April 7 and Monday, April 17 (Day before and after Spring Recess)

Prevent Absenteeism (continued) § Use PA announcements, letters and/or Blackboard Connect messages to all parents and staff during holidays § See Tool #6 “Sample Blackboard Connect & PA Messages”:

Prevent Absenteeism (continued) § Ensure teachers schedule rigorous lesson plans and activities for students every day, but particularly on dates adjacent to days off. § Ensure teachers promote class attendance every day, even during the days before and after the holidays. § Schedule exams and finals through the last day before the break. § Prevent tardies with engaging, or required activities early in the day or period § See Tool #7 “Sample Teacher Memo for Importance of Attendance DURING HOLIDAYS”:

Promote Attendance through Incentives § Schedule special events and attendance incentive activities on the last day before a break or first day after a break. § Promote attendance for all students with 100% during November and/or December with an incentive. § See Tools 8, 9, 10 “Examples of Holiday flyers and incentives” Tool for students and parents:

Additional Resources • Local District Pupil Services field office • http: //www. pupilservices. lausd. net • Attendance Works: http: //www. attendanceworks. org/ • Absencesaddup. org: https: //youtu. be/M 8 SIX 2 o 2 N 1 c

Local District Data Reports Attendance Tools and Resources

Attendance High & Low Flyers: Month of October • High Flyers and Low Flyers include: • Attendance Submittal rates • Attendance • Chronic Absence High Flyers Low Flyers Attendance Submittal 100% Attendance Submittal Lowest submittal rates 96% Attendance Highest rate of students at or above 96% Lowest rate of students at or above 96% Chronic Absence Lowest rate of chronic absence (91% or lower) Highest rate of chronic absence (91% or lower)

Data Report A: Student Attendance Submittal Rates and LCAP Attendance Metrics • Shows Attendance Submittal rates, Chronic Absence, 96% Attendance • Schools in RED: • Schools without 100% Submittal • Schools not meeting the LCAP goals • Report can be sorted by Director and by Operations Coordinator Attendance Submittal Calculation: Actual Attendance Submittal Possible Attendance Submittal

Data Report B: ATTENDANCE BY LOCATION BY MONTH, 2 YEAR COMPARISON • Compares Attendance by Month & Cumulative Attendance through October (2015 -16 vs. 2016 -17) • Identifies the Difference in Attendance rates for the month

Data Report C: 96% Attendance • Shows Cumulative Attendance Goal Rates (96% and above) • 2016 -17 • 2015 -16 • Difference 2015 -16 vs. 2016 -17 • Identifies the difference from the LCAP Goal of 73% • Includes the # of students and total Enrollment

Data Report D: 91% (Chronic Absence) • Shows Cumulative Attendance Goal Rates (11% or lower) • 2016 -17 • 2015 -16 • Difference 2015 -16 vs. 2016 -17 • Identifies the difference from the LCAP Goal of 11% • Includes the # of students and total Enrollment

Data Report E: 5 Attendance Bands • Shows the Percentage AND Number of students in each of the 5 Attendance Bands

Data Report F: Estimated ADA Revenue Loss • Shows Revenue Lost by month with comparison between 2015 -16 vs. 2016 -17

Data Report G: Revenue Lost by Location by Month (2 -Year Comparison) • Shows Revenue Lost by School for each month and cumulative • Compares Revenue Lost from 2015 -16 vs. 2016 -17

Next Steps Attendance Tools and Resources

Next Steps: Supporting Local Disticts • An email will be sent with a link to the November Local District reports, Power. Point, and tools/resources by today • Data reports will be available on a monthly basis • Meetings with each Local District Superintendent will be scheduled with Pupil Services to discuss LD specific data

“To ensure that all LAUSD students are enrolled, attending, engaged, and on-track to graduate” Pupil Services (213) 241 -3844 www. pupilservices. lausd. net
 The link between pupil health and wellbeing and attainment
 Health and human services milwaukee
 Iowa department of health and human services
 Siskiyou county ihss
 Milwaukee county human services
 Maine department of health and human services
 Barnstable county human services
 Definition of micro teaching
 Wake county human services community services center
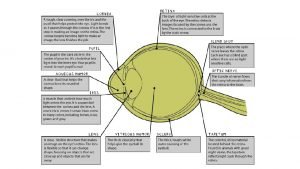
 Transparent layer that protects iris and pupil
 Clear fluid that helps the cornea keep its rounded shape
 Cover letter for student teaching placement
 Student teaching binder
 Student teaching
 Student teaching
 Student teaching
 Hhd vcaa
 Extended metaphor poem examples
 Fun unit
 Non allowable pupil decimal
 Southeastern states pupil transportation conference
 Pupil path password reset
 Pupil assessment
 Gcs
Gcs Dilatace pupil
 Construction of human eye
 Seclusio pupillae diagram
 Od os ou
 Doll's eye
 Pupil plane
 Pupil normal size
 Innate wisdom vs. educated stupidity
 Pinpoint pupil acilci
 Pupil path down
 Eleicited
 Pupilq
 Haemotympanium
 Cow eye choroid
 Clever cleverest
 Mentor pupil relationship archetype examples
 Pupil equity fund examples
 Radial and sphincter muscles
 Wernickes hemianopic pupil


