student evaluations Please go to husky CT and


 ln (2 N) generations (also true")
 • A new allele (mutant) confers some increase in the fitness")


 • A new allele (mutant) confers some decrease in the fitness")
 Frequency")


 ratio)")
 the basic model")
 have been shown to work great in few instances. The most celebrated")


 GTAs smaller capsids pack more often host DNA than their")


 they have the same level")
 Gene transfer is beneficial to")
 Gene transfer agents are ineffective")
 to detect positive selection Selective sweeps")


 BLAST The NCBI page described PSI blast as follows: “Position-Specific Iterated")


 and the Acquisition of New Capabilities • Most important process")


 Photosynthesis through Recurrent Lateral Gene Transfer. Curr Biol. 2012 Mar")


 BLAST The NCBI page described PSI blast as follows: “Position-Specific Iterated")


 link to sequence here, check BLink")
")


- Slides: 75
student evaluations Please go to husky CT and complete student evaluations !
Neutral theory: The vast majority of observed sequence differences between members of a population are neutral (or close to neutral). These differences can be fixed in the population through random genetic drift. Some mutations are strongly counter selected (this is why there are patterns of conserved residues). Only very seldom is a mutation under positive selection. The neutral theory does not say that all evolution is neutral and everything is only due to to genetic drift.
N=50 s=0 50 replicates
N=5000 s=0 5 replicates
s=0 Probability of fixation, P, is equal to frequency of allele in population. Mutation rate (per gene/per unit of time) = u ; freq. with which allele is generated in diploid population size N =u*2 N Probability of fixation for each allele = 1/(2 N) Substitution rate = frequency with which new alleles are generated * Probability of fixation= u*2 N *1/(2 N) = u = Mutation rate Therefore: If f s=0, the substitution rate is independent of population size, and equal to the mutation rate !!!! (NOTE: Mutation unequal Substitution! ) This is the reason that there is hope that the molecular clock might sometimes work. Fixation time due to drift alone: tav=4*Ne generations (Ne=effective population size; For n discrete generations Ne= n/(1/N 1+1/N 2+…. . 1/Nn)
s>0 Time till fixation on average: tav= (2/s) ln (2 N) generations (also true for mutations with negative “s” ! discuss among yourselves) E. g. : N=106, s=0: average time to fixation: 4*106 generations s=0. 01: average time to fixation: 2900 generations N=104, s=0: average time to fixation: 40. 000 generations s=0. 01: average time to fixation: 1. 900 generations N=1011 (100 billion – size of the Prochlorococcus population), s=0: average time to fixation: 4*1011 generations (about 1 billion years) s=0. 01: average time to fixation: 5200 generations (about 14 years) Test question: What is the probability of fixation? => substitution rate of mutation under positive selection is larger than the rate with which neutral mutations are fixed.
Positive selection (s>0) • A new allele (mutant) confers some increase in the fitness of the organism • Selection acts to favour this allele • Also called adaptive selection or Darwinian selection. NOTE: Fitness = ability to survive and reproduce Modified from www. tcd. ie/Genetics/staff/Aoife/GE 3026_1+2. ppt
Random Genetic Drift Selection 100 Allele frequency advantageous disadvantageous 0 Modified from www. tcd. ie/Genetics/staff/Aoife/GE 3026_1+2. ppt
For advantageous mutations: Probability of fixation, P, is approximately equal to 2 s; e. g. , if selective advantage s = 5% then P = 10% tav=2/s*log 2 N generations = 40*log 100= 80
selection versus drift The larger the population the longer it takes for an allele to become fixed. Note: Even though an allele conveys a strong selective advantage of 10%, the allele has a rather large chance to go extinct. Note#2: Fixation is faster under selection than under drift. Questions: Can you think of genes that have a higher fixation probability? (Hint: HGT) Why might a gene that conveys a selective disadvantage be fixed on average in the same time as an advantageous gene? tav= (2/s) ln (2 N) generations
Negative selection (s<0) • A new allele (mutant) confers some decrease in the fitness of the organism • Selection acts to remove this allele • Also called purifying selection Modified from www. tcd. ie/Genetics/staff/Aoife/GE 3026_1+2. ppt
Neutral mutations • • Neither advantageous nor disadvantageous Invisible to selection (no selection) Frequency subject to ‘drift’ in the population Random drift – random changes in small populations
Genetic Code – Note degeneracy of 1 st vs 2 nd vs 3 rd position sites
Measuring Selection on Genes • Null hypothesis = neutral evolution • Under neutral evolution, synonymous changes should accumulate at a rate equal to mutation rate • Under neutral evolution, amino acid substitutions should also accumulate at a rate equal to the mutation rate From: mentor. lscf. ucsb. edu/course/spring/eemb 102/lecture/Lecture 7. ppt
Testing for selection using d. N/d. S ratio (aka Ka/Ks or ω (omega) ratio) where d. N = number of non-synonymous substitutions / number of all possible non-synonymous substitutions d. S =number of synonymous substitutions / number of all possible non-synonymous substitutions d. N/d. S >1 positive, Darwinian selection d. N/d. S =1 neutral evolution d. N/d. S <1 negative, purifying selection
PAML (codeml) the basic model
Sites model(s) have been shown to work great in few instances. The most celebrated case is the influenza virus HA gene. A talk by Walter Fitch (slides and sound) on the evolution of this molecule is here. This article by Yang et al, 2000 gives more background on ml aproaches to measure omega. The dataset used by Yang et al is here: flu_data. paup.
sites model in Mr. Bayes The Mr. Bayes block in a nexus file might look something like this: begin mrbayes; set autoclose=yes; lset nst=2 rates=gamma nucmodel=codon omegavar=Ny 98; mcmcp samplefreq=500 printfreq=500; mcmc ngen=500000; sump burnin=50; sumt burnin=50; end;
for each codon calculate the average probability copy paste formula enter formula plot row
Vote: What to do next Friday? d. N/d. S or PSI-Blast Does purifying selection mean a gene is expressed for an important function?
Gene Transfer Agents (GTAs) GTAs smaller capsids pack more often host DNA than their own genes GTA Phage Lang AS, Zhaxybayeva O, Beatty JT. Nat Rev Microbiol. 2012 Jun 11; 10(7): 472 -82 Bruhn J B et al. Appl. Environ. Microbiol. 2005; 71: 7263 -7270 Copyright © 2005, American Society for Microbiology Lang AS, Zhaxybayeva O, Beatty JT. Nat Rev Microbiol. 2012 Jun 11; 10(7): 472 -82
Purifying selection in GTA genes d. N/d. S <1 for GTA genes has been used to infer selection for function GTA genes Lang AS, Zhaxybayeva O, Beatty JT. Nat Rev Microbiol. 2012 Jun 11; 10(7): 472 -82 Lang, A. S. & Beatty, J. T. Trends in Microbiology , Vol. 15, No. 2 , 2006
Purifying selection in E. coli ORFans d. N-d. S < 0 for some ORFan E. coli clusters seems to suggest they are functional genes. Gene groups Number d. N-d. S>0 d. N-d. S<0 d. N-d. S=0 E. coli ORFan clusters 3773 944 (25%) 1953 (52%) 876 (23%) Clusters of E. coli sequences found in Salmonella sp. , Citrobacter sp. 610 104 (17%) 423(69%) 83 (14%) Clusters of E. coli sequences found in some Enterobacteriaceae only 373 8 (2%) 365 (98%) 0 (0%) Adapted after Yu, G. and Stoltzfus, A. Genome Biol Evol (2012) Vol. 4 1176 -1187
Vincent Daubin and Howard Ochman: Bacterial Genomes as New Gene Homes: The Genealogy of ORFans in E. coli. Genome Research 14: 1036 -1042, 2004 The ratio of nonsynonymous to synonymous substitutions for genes found only in the E. coli Salmonella clade is lower than 1, but larger than for more widely distributed genes. Increasing phylogenetic depth Fig. 3 from Vincent Daubin and Howard Ochman, Genome Research 14: 1036 -1042, 2004
Trunk-of-my-car analogy: Hardly anything in there is the result of providing a selective advantage. Some items are removed quickly (purifying selection), some are useful under some conditions, but most things do not alter the fitness. See here for a published version. Could some of the inferred purifying selection be due to the acquisition of novel detrimental characteristics (e. g. , protein toxicity, HOPELESS MONSTERS)?
Vertically Inherited Genes Not Expressed for Function
Evolution of Coding DNA Sequences Under a Neutral Model E. coli Prophage Genes Count distribution from simulations Probability distribution n=90 Non-synonymous n= 90 k= 24 p=0. 763 P(≤ 24)=3. 63 E-23 Observed=24 P(≤ 24) < 10 -6 n=90 Synonymous Observed=66 P(≥ 66) < 10 -6 n= 90 k= 66 p=0. 2365 P(≥ 66)=3. 22 E-23
Evolution of Coding DNA Sequences Under a Neutral Model E. coli Prophage Genes OBSERVED Dnapars Simulated Codeml p-value Minimum Alignment Substitution Synonymous synonymou number of Gene Length (bp) s changes* Substitutions s (given *) substitutions d. N/d. S 1023 Major capsid 90 66 90 3. 23 E-23 94 0. 113 0. 13142 1329 Minor capsid C 81 59 81 1. 98 E-19 84 0. 124 0. 17704 Large terminase subunit 1923 Small terminase subunit Portal Protease Minor tail H Minor tail L Host specificity J Tail fiber K Tail assembly I 543 Tail tape measure protein 1599 1329 2565 696 3480 741 669 SIMULATED 75 67 75 7. 10 E-35 82 0. 035 0. 03773 100 55 55 260 30 66 46 37 168 26 100 55 55 260 30 1. 07 E-19 1. 36 E-21 4. 64 E-11 1. 81 E-44 1. 30 E-13 101 *64 55 260 30 0. 156 0. 057 0. 162 0. 17 0. 044 0. 25147 0. 08081 0. 24421 0. 30928 0. 05004 723 41 39 498 28 33 723 41 39 6. 42 E-149 1. 06 E-09 3. 82 E-15 *773 44 40 0. 137 0. 14 0. 064 0. 17103 0. 18354 0. 07987 375 243 375 7. 92 E-64 378 0. 169 0. 27957 2577 Values well under the p=0. 01 threshold, suggesting rejection of the null hypothesis of neutral evolution of prophage sequences.
Why could GTAs be under purifying selection? • A) they have the same level of purifying selection as genes that do not make any functional contribution to the host’s fitness. (but why are they found in many organisms? Other genes that do not make any functional contribution frequently turn into pseudogenes)
Why could GTAs be under purifying selection? • B) Gene transfer is beneficial to the population (faster evolution through combining beneficial mutations, getting rid of slightly delirious mutations). And the fitter population will outcompete less fit populations. Problem: This is not an evolutionary stable strategy. Organisms that no longer produce GTAs still receive the benefit of HGT, but do not pay the cost of sometimes producing GTAs
Why could GTAs be under purifying selection? • C) Gene transfer agents are ineffective selfish genes. Transfer occurs so frequently that organisms with defective GTAs are converted back to functional GTAs (note, this is a one way street, because the organisms with defective GTAs do not produce GTAs, and therefore their genes will not spread though HGT. Problem: This requires a HUGE amount of GTA infecting every cell. (size of the genome/size of the DNA packed into a GTA=about 500 – 1000 GTAs
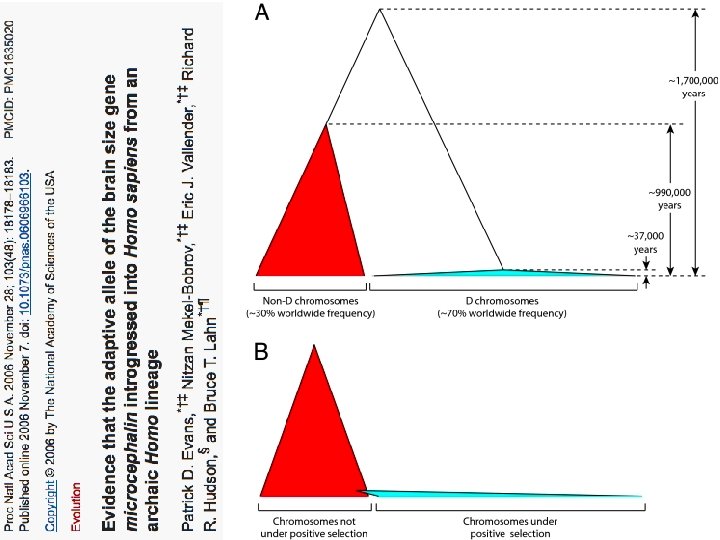
Other ways (in addition to d. N/d. S>0) to detect positive selection Selective sweeps -> fewer alleles present in population (see contributions from archaic Humans for example) Repeated episodes of positive selection -> high d. N (works well for repeated positive – aka diversifying – selection; e. g. virus interaction with the imunesystem)
Other ways to detect positive selection Selective sweeps -> fewer alleles present in population (allele shows little within allele divergence - see contributions from archaic Humans for example), SNP or neighboring SNPs are at higher frequency within a population. Repeated episodes of positive selection -> high d. N
Manhattan plot of results of selection tests in Rroma, Romanians, and Indians using Tree. Select statistic (A) and XP-CLR statistic (B). SNP frequencies within and between populations selective sweeps detected through linkage disequilibrium Laayouni H et al. PNAS 2014; 111: 2668 -2673 Convergent evolution in European and Rroma populations reveals pressure exerted by plague on Toll-like receptors. © 2014 by National Academy of Sciences
The age of haplogroup D was found to be ~37, 000 years
Archaic human admixture with modern Homo sapiens From: http: //en. wikipedia. org/wiki/Archaic_human_admixture_with_modern_Homo_sapiens
Did the Denisovans Cross Wallace's Line? Science 18 October 2013: vol. 342 no. 6156 321 -323 Ancient migrations. The proportions of Denisovan DNA in modern human populations are shown as red in pie charts, relative to New Guinea and Australian Aborigines (3). Wallace's Line (8) is formed by the powerful Indonesian flow-through current (blue arrows) and marks the limit of the Sunda shelf and Eurasian placental mammals.
Figure 3 A Model of Population Separation and Admixture that Fits the Data The admixture graph suggests Denisova-related gene flow into a common ancestral population of Mamanwa, New Guineans, and Australians, followed by admixture of New Guinean. . . David Reich , Nick Patterson , Martin Kircher , Frederick Delfin , Madhusudan R. Nandineni , Irina Pugach , Albert. . . Denisova Admixture and the First Modern Human Dispersals into Southeast Asia and Oceania The American Journal of Human Genetics Volume 89, Issue 4 2011 516 - 528 http: //dx. doi. org/10. 1016/j. ajhg. 2011. 09. 005
“Genotyping of a DNA sample that was submitted to a commercial genetic-testing facility demonstrated that the Y chromosome of this African American individual carried the ancestral state of all known Y chromosome SNPs. ” Mendez , et al. 2013 An African American Paternal Lineage Adds an Extremely Ancient Root to the Human Y Chromosome Phylogenetic Tree The American Journal of Human Genetics Volume 92, Issue 3 2013 454 - 459 http: //dx. doi. org/10. 1016/j. ajhg. 2013. 02. 002
Y chromosome Adam Mitochondrial Eve Lived approximately 40, 000 years ago Lived 166, 000 -249, 000 years ago Thomson, R. et al. (2000) Proc Natl Acad Sci U S A 97, 7360 -5 Cann, R. L. et al. (1987) Nature 325, 31 -6 Vigilant, L. et al. (1991) Science 253, 1503 -7 Underhill, P. A. et al. (2000) Nat Genet 26, 358 -61 Mendez et al. (2013) American Journal of Human Genetics 92 (3): 454. Albrecht Dürer, The Fall of Man, 1504 Adam and Eve never met The same is true for ancestral r. RNAs, EF, ATPases!
“Genotyping of a DNA sample that was submitted to a commercial genetic-testing facility demonstrated that the Y chromosome of this African American individual carried the ancestral state of all known Y chromosome SNPs. To further characterize this lineage, which we dubbed A 00. . . ” Am J Hum Genet. 2013 Mar 7; 92(3): 454– 459. doi: 10. 1016/j. ajhg. 2013. 02. 002 PMCID: PMC 3591855 An African American Paternal Lineage Adds an Extremely Ancient Root to the Human Y Chromosome Phylogenetic Tree Fernando L. Mendez, 1 Thomas Krahn, 2 Bonnie Schrack, 2 Astrid-Maria Krahn, 2 Krishna R. Veeramah, 1 August E. Woerner, 1 Forka Leypey Mathew Fomine, 3 Neil Bradman, 4 Mark G. Thomas, 5 Tatiana M. Karafet, 1 and Michael F.
PSI (position-specific iterated) BLAST The NCBI page described PSI blast as follows: “Position-Specific Iterated BLAST (PSI-BLAST) provides an automated, easy-to-use version of a "profile" search, which is a sensitive way to look for sequence homologues. The program first performs a gapped BLAST database search. The PSI-BLAST program uses the information from any significant alignments returned to construct a position-specific score matrix, which replaces the query sequence for the next round of database searching. PSI-BLAST may be iterated until no new significant alignments are found. At this time PSI-BLAST may be used only for comparing protein queries with protein databases. ”
Figure 1 Genealogy of A 00, A 0, and the Reference Sequence Lineages on which mutations were identified and lineages that were used for placing those mutations on the genealogy are indicated with thick and thin lines, respectively. The numbers of. . . Mendez , et al. 2013 An African American Paternal Lineage Adds an Extremely Ancient Root to the Human Y Chromosome Phylogenetic Tree The American Journal of Human Genetics Volume 92, Issue 3 2013 454 - 459 http: //dx. doi. org/10. 1016/j. ajhg. 2013. 02. 002
Figure 2 Map Showing Cameroon and the Approximate Location where Mbo Speakers Live Fernando L. Mendez , Thomas Krahn , Bonnie Schrack , Astrid-Maria Krahn , Krishna R. Veeramah , August E. Woerner. . . An African American Paternal Lineage Adds an Extremely Ancient Root to the Human Y Chromosome Phylogenetic Tree The American Journal of Human Genetics Volume 92, Issue 3 2013 454 - 459 http: //dx. doi. org/10. 1016/j. ajhg. 2013. 02. 002
For more discussion on archaic and early humans see: http: //en. wikipedia. org/wiki/Denisova_hominin http: //www. nytimes. com/2012/01/31/science/gains-in-dna-arespeeding-research-into-human-origins. html http: //www. nytimes. com/2014/10/23/science/research-humansinterbred-with-neanderthals. html? http: //www. sciencedirect. com/science/article/pii/S 000292971100 3958 http: //www. abc. net. au/science/articles/2012/08/31/3580500. htm http: //www. sciencemag. org/content/334/6052/94. full http: //www. sciencemag. org/content/334/6052/94/F 2. expansion. html http: //haplogroup-a. com/Ancient-Root-AJHG 2013. pdf
How do you define evolution? Richard Goldschmidt 1940 hopeful monsters Mutationism HGT/WGD! Punctuated Equilibrium Few genes / large effect Vilified by Mayr, celebrated 1977 Gould & Evo-devo Ernst Mayr 1942 Neo. Darwinian Synthesis Natural Selection Gradualism Many genes/small effect Motoo Kimura 1968 Neutral Theory Genetic Drift is main force for changing allele frequencies Slide from Chris Pires
Duplications and Evolution Ohno postulated that gene duplication plays a major role in evolution Small scale duplications (SSD) Whole genome duplications (WGD) • Polyploid: nucleus contains three or more copies of each chromosome Susumu Ohno 1970 Evolution by gene duplication 1 R and 2 R hypothesis • Autopolyploid: formed within a single species Diploids AA and A’A’ Polyploid AAA’A’ • Allopolyploid: formed from more than one species Diploids AA and BB Polyploid AABB “Junk DNA” 1972 Slide from Chris Pires
e. g. gene duplications in yeast from Benner et al. , 2002 Figure 1. The number of duplicated The chemical pathway that converts glucose to alcohol in gene pairs (vertical axis) in the genome yeast arose ~80 Ma, near the time that fermentable fruits of the yeast Saccharomyces cerevisiae became dominant. Gene families that suffered duplication versus f 2, a metric that models divergence near this time, captured in the episode of gene duplication of silent positions in twofold redundant codon systems via an approach-to- 2 represented in the histogram in Fig. 1 by bars at f equilibrium kinetic process and therefore 0. 84, are named in red. According to the hypothesis, this acts as a logarithmic scale of the time pathway became useful to yeast when angiosperms since the duplications occurred. Recent (flowering, fruiting plants) began to provide abundant duplications are represented by bars at the sources of fermentable sugar in their fruits. right. Duplications that diverged so long ago that equilibrium at the silent sites has been reached are represented by bars where f 2 0. 55. Noticeable are episodes of gene duplication between the two extremes, including a duplication at f 2 0. 84. This represents the duplication, at ~80 Ma, whereby yeast gained its ability to ferment sugars found in fruits created by angiosperms. Also noticeable are recent duplications of genes that enable yeast to speed DNA synthesis, protein synthesis, and malt degradation, presumably representing yeast's recent interaction with humans.
Gene Transfer, Sex, and Recombination: • Inventions do not need to be made sequentially • Gene transfer, followed by homologous or non-homologous recombination, allows inventions to be shared across the tree of life
Aside: Gene and genome duplication versus Horizontal Gene Transfer Autochtonous gene/genome duplication are rare in prokaryotes Gene family expansion through horizontal gene transfer – the most common process in prokaryotes
Horizontal Gene Transfer (HGT) and the Acquisition of New Capabilities • Most important process to adapt microorganisms to new environments. E. g. : Antibiotic and heavy metal resistance, pathways that allow acquisition and breakdown of new substrates. • Creation of new metabolic pathways. • HGT not autochthonous gene duplication is the main process of gene family expansion in prokaryotes. • Also important in the recent evolution of multicellular eukaryotes (HGT between fish species and between grasses). Selection acts on the Holobiont (= Host + Symbionts) • To adapt to new conditions, new symbionts can be acquired, or existing symbionts can acquire new genes through HGT.
Gene Transfer in Eukaryotes Bacterial parasites on red algae HGT Human gut symbiont
Gene Transfer in Eukaryotes – Example 2 Highlights • Key genes for C 4 photosynthesis were transmitted between distantly related grasses • These genes contributed to the adaptation of the primary metabolism • Their transmission was independent from most of the genome Curr Biol. 2012 Mar 6; 22(5): 445 -9. Epub 2012 Feb 16. Adaptive Evolution of C(4) Photosynthesis through Recurrent Lateral Gene Transfer. Christin PA, Edwards EJ, Besnard G, Boxall SF, Gregory R, Kellogg EA, Hartwell J, Osborne CP. Eric H. Roalson Current Biology Vol 22 No 5 R 162
Adaptive Evolution of C(4) Photosynthesis through Recurrent Lateral Gene Transfer. Curr Biol. 2012 Mar 6; 22(5): 445 -9. Epub 2012 Feb 16. From: Christin PA, Edwards EJ, Besnard G, Boxall SF, Gregory R, Kellogg EA, Hartwell J, Osborne CP. Gene Transfer in Eukaryotes – Example 2
Gene Transfer in Eukaryotes – Example 3
HGT as a force creating new pathways
HGT as a force creating new pathways – Example I Acetoclastic Methanogenesis § Unique to subset of Archaea § Energy production via reduction of multiple carbon substrates to CH 4 § 900 Million metric tons of biogenic methane produced annually. § Over 66% of biogenic methane is produced from acetate, mostly by Methanosarcina genera. From: Galagan et al. , 2002 Fournier and Gogarten (2008) Evolution of Acetoclastic Methanogenesis in Methanosarcina via Horizontal Gene Transfer from Cellulolytic Clostridia. J. Bacteriol. 190(3): 1124 -7
Clostridia acetigenic pathway Methanosarcina acetoclastic pathway Ack. A Pta. A Ack. A HGT Figures drawn with Metacyc (www. metacyc. org) Pta. A
Maximum likelihood phylogenetic trees of Pta and Ack. A homologs. Homologs found in Methanosarcina are red and in both cases are found in a monophyletic group corresponding to the Clostridia (blue). .
Consensus trees of Pta and Ack. A homologs within the Clostridia. Branches in which there were postulated horizontal gene transfers to Methanosarcina are indicated by an asterisk. Homologs from the firmicute F. nucleatum were used as outgroups to root the trees. The numbers associated with each clade indicate bootstrap values for maximum likelihood and neighbor joining and the posterior probability from Bayesian inference, respectively. Sequence alignment was. . .
HGT as a force creating new pathways – Example 2 Oxygen producing photosynthesis
A heterologous fusion model for the evolution of oxygenic photosynthesis based on phylogenetic analysis. Xiong J et al. PNAS 1998; 95: 14851 -14856 © 1998 by National Academy of Sciences
HGT as a force creating new pathways – Example 3 Acetyl-Co. A Assimilation: Methylaspartate Cycle Acetate Fatty acids Alcohols Polyhydroxybutyrate acetyl-Co. A oxaloacetate Lysine, leucine citrate malate isocitrate CO 2 fumarate acetyl-Co. A 2 -oxoglutarate glutamate succinate glyoxylate succinyl-Co. A CO 2 propionyl-Co. A Poly-γ -glutamate Proteins γ-Glutamylcystein methylaspartate Osmoadaptation mesaconate 3 -methylmalyl-Co. A mesaconyl-Co. A Khomyakova, Bükmez, Thomas, Erb, Berg, Science, 2011
Comparison of different anaplerotic pathways acetyl-Co. A oxaloacetate crotonyl-Co. A CO 2 citrate oxaloacetate acetyl-Co. A citrate malate isocitrate ethylmalonyl-Co. A acetyl-Co. A CO 2 acetyl-Co. A fumarate isocitrate malate glyoxylate CO 2 2 -oxoglutarate mesaconyl-Co. A 3 -methylmalyl-Co. A succinate succinyl-Co. A Citric acid cycle and Glyoxylate cycle Bacteria, Eukarya and some Archaea propionyl-Co. A CO 2 succinyl-Co. A glutamate succinate glyoxylate succinyl-Co. A fumarate CO 2 2 -oxoglutarate methylsuccinyl-Co. A glyoxylate acetyl-Co. A methylaspartate CO 2 propionyl-Co. A mesaconate 3 -methylmalyl-Co. A mesaconyl-Co. A malate Ethylmalonyl-Co. A pathway α-Proteobacteria, streptomycetes Methylaspartate cycle haloarchaea
HGT as a force creating new pathways – Example 3 Acetyl-Co. A Assimilation: methylaspartate cycle Haloarchaea Haloarcula marismortui, Natrialba magadii Glutamate fermentation, Bacteria Propionate assimilation Acetate assimilation, Bacteria Khomyakova, Bükmez, Thomas, Erb, Berg, Science, 2011
PSI (position-specific iterated) BLAST The NCBI page described PSI blast as follows: “Position-Specific Iterated BLAST (PSI-BLAST) provides an automated, easy-to-use version of a "profile" search, which is a sensitive way to look for sequence homologues. The program first performs a gapped BLAST database search. The PSI-BLAST program uses the information from any significant alignments returned to construct a position-specific score matrix, which replaces the query sequence for the next round of database searching. PSI-BLAST may be iterated until no new significant alignments are found. At this time PSI-BLAST may be used only for comparing protein queries with protein databases. ”
The Psi-Blast Approach 1. Use results of Blast. P query to construct a multiple sequence alignment 2. Construct a position-specific scoring matrix from the alignment 3. Search database with alignment instead of query sequence 4. Add matches to alignment and repeat Psi-Blast can use existing multiple alignment, or use RPS-Blast to search a database of PSSMs
PSI BLAST scheme
by Bob Friedman Position-specific Matrix M Gribskov, A D Mc. Lachlan, and D Eisenberg (1987) Profile analysis: detection of distantly related proteins. PNAS 84: 4355 -8.
Psi-Blast Results Query: 55670331 (intein) link to sequence here, check BLink
PSI BLAST and E-values! Psi-Blast is for finding matches among divergent sequences (positionspecific information) WARNING: For the nth iteration of a PSI BLAST search, the E-value gives the expected number of matches to the profile NOT to the initial query sequence! The danger is that the profile was corrupted in an earlier iteration.
PSI Blast from the command line Often you want to run a PSIBLAST search with two different databanks - one to create the PSSM, the other to get sequences: To create the PSSM: blastpgp -d nr -i sub. I -j 5 -C sub. I. ckp -a 2 -o sub. I. out -h 0. 00001 -F f blastpgp -d swissprot -i gamma -j 5 -C gamma. ckp -a 2 -o gamma. out -h 0. 00001 -F f Runs 4 iterations of a PSIblast the -h option tells the program to use matches with E <10^-5 for the next iteration, (the default is 10 -3 ) -C creates a checkpoint (called sub. I. ckp), -o writes the output to sub. I. out, -i option specifies input as using sub. I as input (a fasta formated aa sequence). The nr databank used is stored in /common/data/ -a 2 use two processors -h e-value threshold for inclusion in multipass model [Real] default = 0. 002 THIS IS A RATHER HIGH NUMBER!!! (It might help to use the node with more memory (017) (command is ssh node 017)
To use the PSSM: blastpgp -d /Users/jpgogarten/genomes/msb 8. faa -i sub. I -a 2 -R sub. I. ckp -o sub. I. out 3 -F f blastpgp -d /Users/jpgogarten/genomes/msb 8. faa -i gamma -a 2 -R gamma. ckp -o gamma. out 3 -F f Runs another iteration of the same blast search, but uses the databank /Users/jpgogarten/genomes/msb 8. faa -R tells the program where to resume -d specifies a different databank -i input file - same sequence as before -o output_filename -a 2 use two processors -h e-value threshold for inclusion in multipass model [Real] default = 0. 002. This is a rather high number, but might be ok for the last iteration.
PSI Blast and finding gene families within genomes 2 nd step: use PSSM to search genome: A) Use protein sequences encoded in genome as target: blastpgp -d target_genome. faa -i query. name -a 2 -R query. ckp -o query. out 3 -F f B) Use nucleotide sequence and tblastn. This is an advantage if you are also interested in pseudogenes, and/or if you don’t trust the genome annotation: blastall -i query. name -d target_genome_nucl. ffn -p psitblastn -R query. ckp