student evaluations Please go to husky CT and


")


 Generate 100 datasets using Evolver with certain amount of HGTs A) Template tree")

 The impact of HGT on")


")
 – a division of a phylogenetic")
 13 gammaproteobacterial genomes (258 putative")

 • Anabaena • Trichodesmium • Synechocystis")
 N=5(1) N=4(0) C 0. 01 B")
 and (CD) Maximum Bootstrap")


 from quartets in the plurality topology.")
 Plurality neighbor-net calculated as supertree (from")


- Slides: 48
student evaluations Please go to husky CT and complete student evaluations !
Finding transferred genes Screening in the wet-lab and in the computer
Finding transferred genes
Taxplot at NCBI
Taxplot at NCBI
Other approaches to find transferred genes • Gene presence absence data for closely related genomes (for additional genes) • Phylogenetic conflict (for homologous replacement (e. g. quartet decompositon spectra see Figs. 1 and 2) • Composition based analyses (for very recent transfers).
Example for a parametric bootstrap analysis
16 S r. RNA phylogeny colored according to tyr. RS type Under the assumption that both types were present in the bacterial ancestor and explaining the observed distribution only through gene loss: 133 taxa and 58 gene loss events, 34 losses of type A, 23 of type B Green - Type A tyr. RS Red - Type B tyr. RS Blue - Both types of tyr. RS Andam, Williams, Gogarten 2010 PNAS
LGT 3 State Method Simulated under "loss-only" model; likelihood under HGT model 100 80 60 40 20 Likelihood values -8 1 -8 6 -9 1 -9 6 01 -1 06 -1 nd e r 0 U Frequency • Generated 1000 bootstrap trees under loss-only model Real data under HGT model 120
Discussion of HGT from Bacteria to Tardigrades We estimate that approximately one-sixth of tardigrade genes entered by HGT, nearly double the fraction found in the most extreme cases of HGT into animals known to date. Foreign genes have supplemented, expanded, and even replaced some metazoan gene families within the tardigrade genome. Our results demonstrate that an unexpectedly large fraction of an animal genome can be derived from foreign sources.
Source of genes in the H. dujardini genome as determined by HGT index calculations
Discussion of HGT from Bacteria to Tardigrades
BIOARCHIVES doi: http: //dx. doi. org/10. 1101/033464 http: //biorxiv. org/content/early/2015/12/01/033464
• “While the raw data indicated extensive contamination with bacteria, presumably from the gut or surface of the animals, careful cleaning generated a clean tardigrade dataset for assembly. ”
Our assembly, and inferences from it, conflict with a recently published draft genome (UNC) 6 for what is essentially the same strain of H. dujardini. Our assembly, despite having superior assembly statistics, is ~120 Mb shorter than the UNC assembly. Our genome size estimate from sequence assembly is congruent with the values we obtained by direct measurement. We find 15, 000 fewer protein-coding genes, and a hugely reduced impact of predicted HGT on gene content in H. dujardini. These HGT candidates await detailed validation. While resolution of the conflict between these assemblies awaits detailed examination based on close scrutiny of the raw UNC data, our analyses suggest that the UNC assembly is compromised by sequences that derive from bacterial contaminants, and that the expanded genome span, additional genes, and HGT candidates are likely to be artefactual.
Figure 4: Mapping of read data to UNC assembly identifies non-shared contaminants and no expression from bacterial scaffolds A Blobplot showing the UNC assembly contigs distributed by GC proportion and coverage derived from the UNC raw genomic sequence data (data file TG-300). Scaffold points are scaled by length, and coloured based on taxonomic assignment of the sum of the best BLAST and Diamond matches for all the genes on the scaffold. Taxonomic assignments are summed by phylum. B Blobplot showing the UNC assembly contigs distributed by GC proportion and coverage derived from the Edinburgh raw genomic sequence data. Scaffold points are scaled by length, and coloured based on taxonomic assignment of the sum of the best BLAST and Diamond matches for all the genes on the scaffold. Taxonomic assignments are summed by phylum.
UNC reads Edinburgh reads both mapped on the UNC assembly
From: Delsuc F, Brinkmann H, Philippe H. Phylogenomics and the reconstruction of the tree of life. Nat Rev Genet. 2005 May; 6(5): 361 -75.
Supertree vs. Supermatrix From: Alan de Queiroz John Gatesy: The supermatrix approach to systematics Trends Ecol Evol. 2007 Jan; 22(1): 34 -41 Schematic of MRP supertree (left) and parsimony supermatrix (right) approaches to the analysis of three data sets. Clade C+D is supported by all three separate data sets, but not by the supermatrix. Synapomorphies for clade C+D are highlighted in pink. Clade A+B+C is not supported by separate analyses of the three data sets, but is supported by the supermatrix. Synapomorphies for clade A+B+C are highlighted in blue. E is the outgroup used to root the tree.
Johann Heinrich Füssli Odysseus vor Scilla und Charybdis From: http: //en. wikipedia. org/wiki/Fil e: Johann_Heinrich_F%C 3%BCssl i_054. jpg
B) Generate 100 datasets using Evolver with certain amount of HGTs A) Template tree C) Calculate 1 tree using the concatenated dataset or 100 individual trees D) Calculate Quartet based tree using Quartet Suite Repeated 100 times…
Supermatrix versus Quartet based Supertree inset: simulated phylogeny
From: Lapierre P, Lasek-Nesselquist E, and Gogarten JP (2012) The impact of HGT on phylogenomic reconstruction methods Brief Bioinform [first published online August 20, 2012] doi: 10. 1093/bib/bbs 050 Note : Using same genome seed random number will reproduce same genome history
HGT Evol. Simulator Results
• See http: //bib. oxfordjournals. org/content/15/1/79. full for more information.
Decomposition of Phylogenetic Data Phylogenetic information present in genomes Break information into small quanta of information Analyze spectra to detect transferred genes and plurality consensus.
TOOLS TO ANALYZE PHYLOGENETIC INFORMATION FROM MULTIPLE GENES IN GENOMES: Bipartition Spectra (Lento Plots)
BIPARTITION OF A PHYLOGENETIC TREE Bipartition (or split) – a division of a phylogenetic tree into two parts that are connected by a single branch. It divides a dataset into two groups, but it does not consider the relationships within each of the two groups. 95 ***. . . Yellow vs Rest ***. . . ** compatible to illustrated bipartition Orange vs Rest. . * incompatible to illustrated bipartition
“Lento”-plot of 34 supported bipartitions (out of 4082 possible) 13 gammaproteobacterial genomes (258 putative orthologs): • E. coli • Buchnera • Haemophilus • Pasteurella • Salmonella • Yersinia pestis (2 strains) • Vibrio • Xanthomonas (2 sp. ) • Pseudomonas • Wigglesworthia There are 13, 749, 310, 575 possible unrooted tree topologies for 13 genomes
Consensus clusters of eight significantly supported bipartitions only 258 genes analyzed Phylogeny of putatively transferred gene (virulence factor homologs (mvi. N))
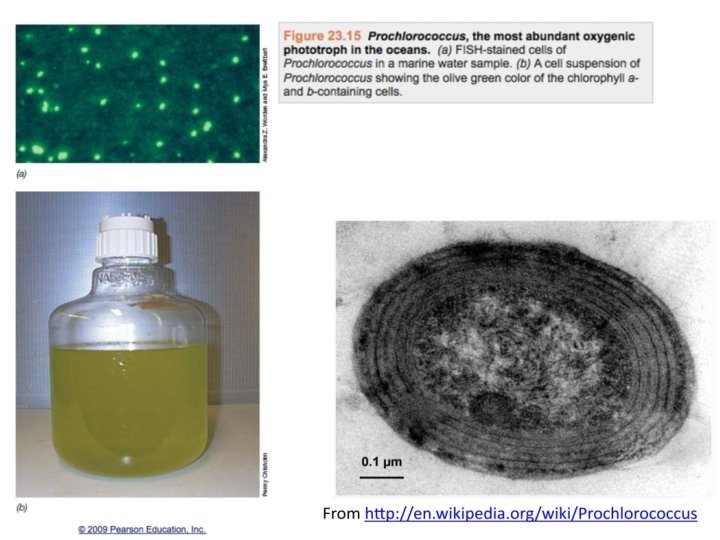
“Lento”-plot of supported bipartitions (out of 501 possible) • Anabaena • Trichodesmium • Synechocystis sp. • Prochlorococcus marinus (3 strains) • Marine Synechococcus • Thermosynechococcus elongatus • Gloeobacter • Nostoc punctioforme Based on 678 sets of orthologous genes Number of datasets 10 cyanobacteria: Zhaxybayeva, Lapierre and Gogarten, Trends in Genetics, 2004, 20(5): 254 -260.
C C D 0. 01 D D N=8(4) N=5(1) N=4(0) C 0. 01 B 0. 01 A B A C N=13(9) D C D A A B B N=23(19) C D A B N=53(49) From: Mao F, Williams D, Zhaxybayeva O, Poptsova M, Lapierre P, Gogarten JP, Xu Y (2012) BMC Bioinformatics 13: 123, doi: 10. 1186/1471 -2105 -13 -123
Results : Maximum Bootstrap Support value for Bipartition separating (AB) and (CD) Maximum Bootstrap Support value for embedded Quartet (AB), (CD) 120 100 80 200 60 500 1000 40 20 0 0 10 20 30 40 Number of Interior Branches 50 Average Supported Embedded Quartets Average Maximum Bootstrap Support 120 100 80 200 60 500 1000 40 20 0 0 10 20 30 40 Number of interior branches 50
Bipartition Paradox: • The more sequences are added, the lower the support for bipartitions that include all sequences. The more data one uses, the lower the bootstrap support values become. • This paradox disappears when only embedded splits for 4 sequences are considered.
Bootstrap support values for embedded quartets + : tree calculated from one pseudosample generated by bootstraping from an alignment of one gene family present in 11 genomes 1 4 9 10 Quartet spectral analyses of genomes iterates over three loops: ØRepeat for all bootstrap samples. ØRepeat for all possible embedded quartets. ØRepeat for all gene families. 1 10 9 4 1 9 10 4 Zhaxybayeva et al. 2006, Genome Research, 16(9): 1099 -108 : embedded quartet for genomes 1, 4, 9, and 10. This bootstrap sample supports the topology ((1, 4), 9, 10).
Illustration of one component of a quartet spectral analyses Summary of phylogenetic information for one genome quartet for all gene families Total number of gene families containing the species quartet Number of gene families supporting the same topology as the plurality (colored according to bootstrap support level) Number of gene families supporting one of the two alternative quartet topologies
Quartet decomposition analysis of 19 Prochlorococcus and marine Synechococcus genomes. Quartets with a very short internal branch or very long external branches as well those resolved by less than 30% of gene families were excluded from the analyses to minimize artifacts of phylogenetic reconstruction.
Plurality consensus calculated as supertree (MRP) from quartets in the plurality topology.
Neighbor. Net (calculated with Splits. Tree 4. 0) Plurality neighbor-net calculated as supertree (from the MRP matrix using Splits. Tree 4. 0) from all quartets significantly supported by all individual gene families (1812) without in-paralogs.
Phylogeny of delta subunit of ATP synthase.
Other approaches to find transferred genes • Gene presence absence data for closely related genomes (for additional genes) • Phylogenetic conflict (for homologous replacement (e. g. quartet decompositon spectra see Figs. 1 and 2) • Composition based analyses (for very recent transfers).
How do you define evolution? Richard Goldschmidt 1940 hopeful monsters Mutationism HGT/WGD! Punctuated Equilibrium Few genes / large effect Vilified by Mayr, celebrated 1977 Gould & Evo-devo Ernst Mayr 1942 Neo. Darwinian Synthesis Natural Selection Gradualism Many genes/small effect Motoo Kimura 1968 Neutral Theory Genetic Drift is main force for changing allele frequencies Modified from Chris Pires
Duplications and Evolution Ohno postulated that gene duplication plays a major role in evolution Small scale duplications (SSD) or HGT Whole genome duplications (WGD) • Polyploid: nucleus contains three or more copies of each chromosome Susumu Ohno 1970 Evolution by gene duplication 1 R and 2 R hypothesis • Autopolyploid: formed within a single species Diploids AA and A’A’ Polyploid AAA’A’ • Allopolyploid: formed from more than one species Diploids AA and BB Polyploid AABB “Junk DNA” 1972 Slide from Chris Pires
e. g. gene duplications in yeast from Benner et al. , 2002 The chemical pathway that converts glucose to Figure 1. The number of duplicated alcohol in yeast arose ~80 Ma, near the time gene pairs (vertical axis) in the genome that fermentable fruits became dominant. Gene of the yeast Saccharomyces cerevisiae families that suffered duplication near this versus f 2, a metric that models divergence time, captured in the episode of gene of silent positions in twofold redundant codon systems via an approach-toduplication represented in the histogram in Fig. equilibrium kinetic process and therefore 1 by bars at f 2 0. 84, are named in red. acts as a logarithmic scale of the time According to the hypothesis, this pathway since the duplications occurred. Recent became useful to yeast when angiosperms duplications are represented by bars at the (flowering, fruiting plants) began to provide right. Duplications that diverged so long abundant sources of fermentable sugar in their ago that equilibrium at the silent sites has fruits. been reached are represented by bars where f 2 0. 55. Noticeable are episodes of gene duplication between the two extremes, including a duplication at f 2 0. 84. This represents the duplication, at ~80 Ma, whereby yeast gained its ability to ferment sugars found in fruits created by angiosperms. Also noticeable are recent duplications of genes that enable yeast to speed DNA synthesis, protein synthesis, and malt degradation, presumably representing yeast's recent interaction with humans.
2 7 4 5 6 3 8 1 1 2 3 4 5 6 7 8
5 4 6 3 7 2 8 1 ori