Stubbs Lab Bioinformatics 5 Review tophat alignment summary

Stubbs Lab Bioinformatics – 5 Review tophat, alignment summary and htseq-count exercises: MDS plots and Differential expression Dec 06, 2016 Joe Troy

Agenda • Review key points of the alignment process • Review the alignment summary report • Review the count files from htseq-count • Explain how choosing an annotation file (. gtf or. gff file) is important. • MDS plot exercise • Differential Gene Expression exercise (edge. R)

Review Alignment Process Notes on tophat 2 alignments per the tophat 2 command we use in our scripts [ tophat 2 -p 12 --library-type fr-firststrand -G file. gtf -o output-folder genome file. fastq ] By default: Final read alignments having more than TWO mismatches are discarded. (this can be changed with the -N/--read-mismatches option) By default: Any given read will only have 20 different alignments reported in the tophat 2 output (accepted_hits. bam). This can be changed with the -g/--max-multihits option “Top. Hat will report the alignments with the best alignment score. If there are more alignments with the same score than this number, Top. Hat will randomly report only this many alignments. ” IMPORTANT NOTE: The htseq-count script DOES NOT COUNT reads that map to multiple locations in the genome.

Review Alignment Summary Report

Review Alignment Summary Report • input – the number of reads in the sample’s. fastq file • mapped – the number of reads mapped to the genome – Note that TWO mismatches are allowed by default • multiple_alignments – reads mapped to more than one location • greater_than_20 – reads mapping to more than 20 locations. – Note that only 20 alignments are kept in the accepted_hits. bam file • overall – proportion of mapped reads to input reads • mapped - multiple_alignments = uniquely mapped reads

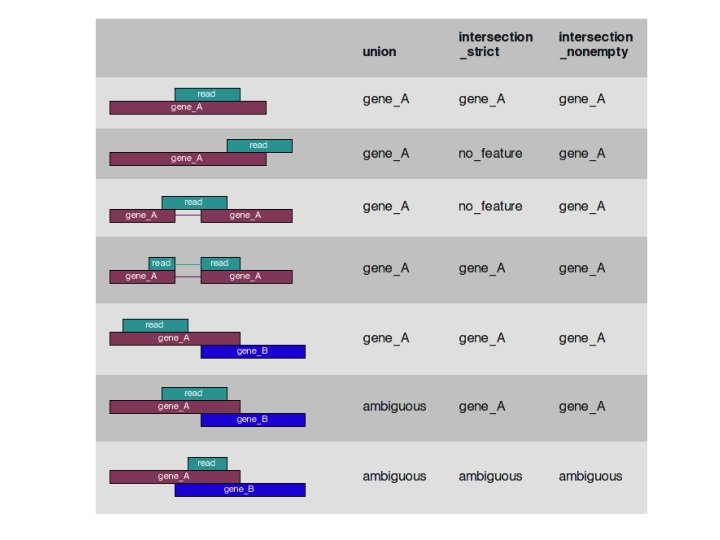
Review htseq-count files Notes on count files created by htseq-count [ htseq-count -f bam -a 0 -t exon -i gene_id -s reverse -m union accepted_hits. bam file. gtf ] -f bam : the input file is a. bam file -a 0 : minimum alignment quality in order to count. (alignment quality not checked) -t exon : count if read aligns to an exon as specified in the. gtf file -s reverse : For stranded=reverse and single-end reads, the read has to be mapped to the opposite strand as the feature. -m union : A read that overlaps an exon (totally or partially) for one gene (and only one gene) is counted (see next slide) more info at: http: //www-huber. embl. de/HTSeq/doc/count. html

htseq-count output 0610005 C 13 Rik 0 0610007 C 21 Rik 1318 0610007 L 01 Rik 957 0610007 P 08 Rik 0. . m. CG_21548 0 m. CG_55969 0 mir 694 0 rp 9 0 rpf 2 0 __no_feature 364413 __ambiguous 3169 __too_low_a. Qual 0 __not_aligned 0 __alignment_not_unique read alignments not hitting an exon in any gene – not counted reads alignments hitting more than one gene – not counted 239889 read alignments mapped to multiple locations – not counted. 1 read is counted multiple times in this figure

htseq-count – special counters documentation http: //www-huber. embl. de/HTSeq/doc/count. html __no_feature: reads (or read pairs) which could not be assigned to any feature (set S as described above was empty). __ambiguous: reads (or read pairs) which could have been assigned to more than one feature and hence were not counted for any of these (set S had mroe than one element). __too_low_a. Qual: reads (or read pairs) which were skipped due to the -a option, see below __not_aligned: reads (or read pairs) in the SAM file without alignment __alignment_not_unique: reads (or read pairs) with more than one reported alignment. These reads are recognized from the NH optional SAM field tag. (If the aligner does not set this field, multiply aligned reads will be counted multiple times, unless they get filtered out by due to the -a option. )
 from ftp. biotec. illinois. edu INPUT: . fastq short read")
INPUT: . tgz file(s) from ftp. biotec. illinois. edu INPUT: . fastq short read files INPUT: align_summary. txt files from tophat 2 OUTPUT: . fastq short read files “accepted_hits. bam” for each sample OUTPUT: “align_summary. txt” Retrieve and uncompress short read files Align Reads to genome sftp command Tophat 2 script tar command OUTPUT: alignment_summary. txt (can be opened in excel) Alignment Summary Report to review alignment stats main_script_alignment_su mmary_16 Gso. sh & create_alignment_summary. R

INPUT: . count files from htseq-count INPUT: TARGET file OUTPUT: . count files OUTPUT: MDS_plot_in_color. pdf OUTPUT: Differential Gene Expression files Create Count Files (un-normalized counts by gene) Create MDS plots edge. R Differential Gene Expression main_script_MDS_ plot_16 Gso. sh main_script_de_w_ edge. R_16 Gso. sh INPUT: “accepted_hits. bam” file from each sample main_script_htseq _count_16 Gso. sh note: this script uses htseq-count http: //wwwhuber. embl. de/HTSeq/doc/count. html

What is a TARGET file? • The target files provides data for each sample to the MDS plot and edge. R DE scripts. • MDS plot script uses the File, Report_Group 2 & MDS_plot columns • edge. R script uses the File, Label & Group column • /home/share/example_rna_seq_project_16 Gso/project_input_data/TARGET. txt

Instructions to create an MDS plot INSTRUCTION SLIDE 1 of 2 – no need to use ‘screen’ as it runs quick! Josephs-Mac. Book-Pro: ~ josephtroy$ ssh jmtroy 2@stubbslab. igb. illinois. edu's password: Last login: Mon Nov 21 20: 15: 51 2016 from c-73 -73 -226 -74. hsd 1. il. comcast. net [jmtroy 2@stubbslab ~]$ df -h Filesystem Size Used Avail Use% Mounted on /dev/sda 1 4. 6 T 4. 2 T 150 G 97% / /dev/sda 2 95 G 14 G 77 G 16% /var /dev/sdb 1 289 M 246 M 11% /boot tmpfs 32 G 0% /dev/shm /dev/sdb 2 275 G 116 G 145 G 45% /var/lib/mysql [jmtroy 2@stubbslab ~]$ cd /home/share/example_rna_seq_project_16 Gso/ [jmtroy 2@stubbslab example_rna_seq_project_16 Gso]$ cd code_030_MDS_plots/ [jmtroy 2@stubbslab code_030_MDS_plots]$ sh main_script_MDS_plot_16 Gso. sh Loading required package: methods [1] "end reading arguments" The output folder is: /home/share/example_rna_seq_project_16 Gso/output_030_MDS_plots_RUN_20161205_174635 end script main_script_MDS_plot_16 Gso. sh at Mon Dec 5 17: 46: 43 CST 2016 [jmtroy 2@stubbslab code_030_MDS_plots]$

Instructions to view the MDS plot INSTRUCTION SLIDE 2 of 2 v In cyberduck find the “MDS_plot_in_color. pdf” file in the output folder and move it (drag and drop) to a local folder on your PC or laptop. v Open the “MDS_plot_in_color. pdf” file with adobe reader (or any other. pdf reader) on your PC or laptop. v -OR- in cyberduck, select the “MDS_plot_in_color. pdf” file and hit the space bar to view.

Instructions to run edge. R Differential Gene Expression INSTRUCTION SLIDE 1 of 2 – no need to use ‘screen’ as it runs quick! Josephs-Mac. Book-Pro: ~ josephtroy$ ssh jmtroy 2@stubbslab. igb. illinois. edu's password: Last login: Tue Dec 6 10: 12: 14 2016 from nat-relay. igb. illinois. edu [jmtroy 2@stubbslab ~]$ cd /home/share/example_rna_seq_project_16 Gso/ [jmtroy 2@stubbslab example_rna_seq_project_16 Gso]$ cd code_060_differential_expression_w_edge. R/ [jmtroy 2@stubbslab code_060_differential_expression_w_edge. R]$ sh main_script_de_w_edge. R_16 Gso. sh Loading required package: limma Loading required package: methods Loading required package: edge. R Running estimate. Common. Disp() on DGEList object before proceeding with estimate. Trended. Disp(). Running estimate. Common. Disp() on DGEList object before proceeding with estimate. Tagwise. Disp(). The output folder is: /home/share/example_rna_seq_project_16 Gso/output_060_differential_expression_w_edge. R_RUN_20161206_1055 05 end script main_script_de_w_edge. R_16 Gso. sh at Tue Dec 6 10: 55: 18 CST 2016 [jmtroy 2@stubbslab code_060_differential_expression_w_edge. R]$

Instructions to run edge. R Differential Gene Expression INSTRUCTION SLIDE 2 of 2 v In cyberduck find the “… pairwise_DGE. txt” files in the output folder and move it (drag and drop) to a local folder on your PC or laptop. v These are tab delimited text files and can be opened with Excel. v The header information at the top of the file explains the meaning of the columns
- Slides: 16