Strumentazione e caratterizzazione dei materiali e dei dispositivi
")

")


")
")


")
")
 • Cathodoluminescence microscopy is the analysis of luminescence from a material when")
 ADVANTAGES: • Gives a full description of a sample with direct correlation")
: electron microscope set-up")
: several images CL images Ga. N on sapphire scanning electron microscope and")
: several images Zn. O nanobelt scanning electron microscope image and CL images")
 (bremsstrahlung) interazione tra fascio di elettroni e target metallico")
")
")
: Legge di Bragg")
: metodi - Metodo di Laue (q costante, l variabile)")
: diffrattometro (solidale con la fenditura)")
: diffrattometro alla Bragg-Brentano")
: q-2 q scan")
: texture e mosaicità (w-scan) Si fissa l’angolo 2 q")
: w-scan q-2 q-scan w-scan (rocking curve)")
: goniometro a 4 cerchi (f-scan)")
: f-scan Figura dei poli")
: legge di Scherrer: Deformazioni reticolari legge di Scherrer allargamento")
- Slides: 33
Strumentazione e caratterizzazione dei materiali e dei dispositivi Mauro Mosca (www. dieet. unipa. it/tfl/) last release: 08/10/2017 Università di Palermo – DEIM
Contents • L-I-V measurements set-up • Misura resistenza di contatto • Catodoluminescenza • Diffrattometro a raggi X
L-I-V measurements set-up source meter semiconductor parameter analyzer of large area (~1 cm 2)
L-I-V measurements set-up: Popt and hext RPD = IPD /Popt
Resistenza di contatto
Resistività di contatto Typical values:
Resistenza di contatto. Geometria laterale
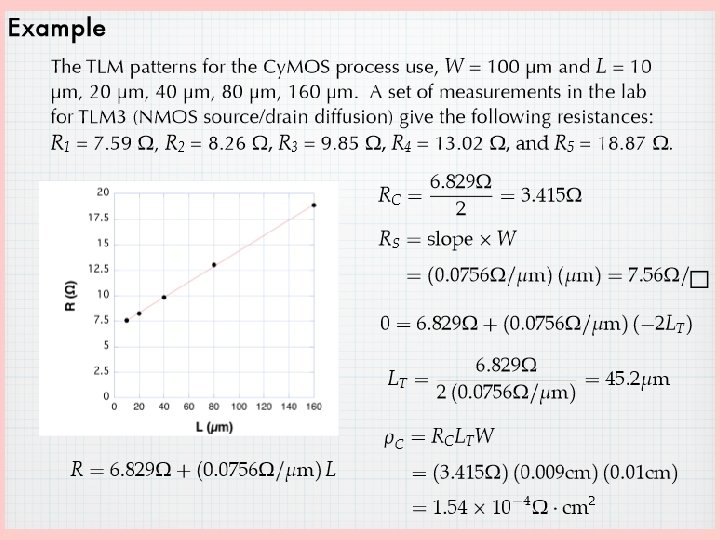
Transmission Line Method (TLM)
Transmission Line Method (TLM)
TLM: current crowding
TLM: transfer length • The transfer length is the average distance that an electron (or hole) travels in the semiconductor beneath the contact before it flows up into the contact. • So the effective area of the contact can be treated as LT W
TLM: transfer length
Transmission Line Method (TLM)
Transmission Line Method (TLM)
Cathodoluminescence (CL) • Cathodoluminescence microscopy is the analysis of luminescence from a material when stimulated by the electron beam of an electron microscope • Cathodoluminescence occurs because the impingement of a high energy electron beam elevates the sample to an excited state, which can then induce it to emit a photon when the sample returns to the ground state • The photon energy (color) and the probability that a photon (not a phonon) will be emitted depends on the material, its purity, and the defects it contains • The emitted signals reveal morphological information, such as size and shape, as well as composition, chemistry, crystallography, electronic properties, plus much more
Cathodoluminescence (CL) ADVANTAGES: • Gives a full description of a sample with direct correlation of a sample’s shape, size, crystallinity or composition with its optical properties • Allows investigation of optical properties at a spatial resolution better than the diffraction limit of light • Allows measurement of dislocation density • Maps defects in integrated circuits. • Well suited to examine low-dimensional semiconductor structures, such a quantum wells or quantum dots.
Cathodoluminescence (CL): electron microscope set-up
Cathodoluminescence (CL): several images CL images Ga. N on sapphire scanning electron microscope and image The CL image shows threading dislocation defects in Ga. N
Cathodoluminescence (CL): several images Zn. O nanobelt scanning electron microscope image and CL images The CL image illustrates defects in the fine structure not observed in the SE image
Diffrazione a raggi X (XRD) (bremsstrahlung) interazione tra fascio di elettroni e target metallico
Diffrazione a raggi X (XRD)
Diffrazione a raggi X (XRD)
Diffrazione a raggi X (XRD): Legge di Bragg
Diffrazione a raggi X (XRD): metodi - Metodo di Laue (q costante, l variabile) - Metodo delle polveri (l costante, q variabile) anche per film policristallini
Diffrazione a raggi X (XRD): diffrattometro (solidale con la fenditura)
Diffrazione a raggi X (XRD): diffrattometro alla Bragg-Brentano
Diffrazione a raggi X (XRD): q-2 q scan
Diffrazione a raggi X (XRD): texture e mosaicità (w-scan) Si fissa l’angolo 2 q e si effettua una scansione in w rocking curve larga in caso di forte Si può così conoscere la ripartizione dei piani angolari disorientazione dei piani cristallini così osservati (bassa texture) grani ad orientazione parallela al frazione volumetrica del cristallo substrato risultano disorientati l’uno orientazione che presentapreferenziale orientazione non-random rispetto all’altro (o texture) FWHM La mosaicità NON è rivelabile con la rocking curve!
Diffrazione a raggi X (XRD): w-scan q-2 q-scan w-scan (rocking curve)
Diffrazione a raggi X (XRD): goniometro a 4 cerchi (f-scan)
Diffrazione a raggi X (XRD): f-scan Figura dei poli
Diffrazione a raggi X (XRD): legge di Scherrer: Deformazioni reticolari legge di Scherrer allargamento dovuto alla dimensione dei grani cristalliti