Structure determination of organic compounds Determination of organic


 §Column (flash) chromatography §Gas or liquid")


![TLC – RF (distribution coefficient) b a Distance moved by the substance [a] Rf](https://slidetodoc.com/presentation_image_h2/8af4e95f433068af9284afe264019265/image-12.jpg "TLC – RF (distribution coefficient) b a Distance moved by the substance [a] Rf")


 What is molecular formula? Infrared")


 What functional groups are present?")


 Intensity Assignment Bending Vibrations")


 Mass spectroscopy - size of molecule (molecular weight and formula)")


 Most proton chemical shifts range 0 -10 ppm If the")


 Violet: 400 - 420 nm Indigo: 420 -")


- Slides: 97
Structure determination of organic compounds
Determination of organic structures Product
Product purification Distillation Crystallization Chromatography §Thin-layer chromatography (TLC) §Column (flash) chromatography §Gas or liquid chromatography
Distillation works by exploiting the different boiling points of liquids. The more volatile liquid (lower b. p. ) will simply evaporate first and the vapor will pass into a condenser where it reverts into liquid. Further heating will force the less volatile liquids (higher b. p. ) to evaporate and distill at higher temperature.
Crystallization is a method for purifying solids. Crystallization works by taking advantage of the different solubility of compounds, and allows impurities to be removed from crude solids. First, you add a small amount of solvent to the crude compound in a flask, and heat to boiling until the solid has dissolved. Then, you cool the solution, allowing crystals to precipitate, while impurities stay dissolved in the solvent. Then you separate crystals by vacuum filtration, and discard the waste solution.
Chromatography Methods of compounds mixture separation based on the different distribution of its components between two phases: stationary phase and mobile phase The mobile phase can be a liquid or a gas and the stationary phase is usually a solid or nonvolatile liquid. Combinations of these two components result in different chromatographic techniques.
Column chromatography Solvent – mobile phase Stationary phase (Si. O 2 or Al 2 O 3) Glass wool The glass tube is filled with adsorbent material, and solution containing the mixture to be separated is allowed to drip through the column
Column chromatography
Thin Layer Chromatography Here the mobile phase is a liquid Stationary phase is a thin layer of a solid on a flat surface (glass plate). Substances that are weakly adsorbed onto the solid or are more soluble in the liquid move faster. And so move further up the plate by the time that the process has been stopped by taking the plate out of the liquid.
Thin Layer Chromatography
TLC – Thin Layer Chromatography Spots visualization is attained by spraying the plate with reagent forming coloured compounds with analyzed substances Method used for determining the purity of materials and also for preliminary identification purposes Adsorbent is supported as a thin coating on a flat surface (glass; aluminum plate)
TLC – RF (distribution coefficient) b a Distance moved by the substance [a] Rf = Distance moved by the solvent [b]
Controlling the reaction progress by TLC Reaction finished by-products present 1 st line – substrate standard 2 nd line – reaction mixture 3 rd line – product standard Reaction finished - OK
Gas Chromatography Filters/Traps Data system H RESET Regulators Syringe/Sampler Inlets Detectors Gas Carrier Hydrogen Air Column • gas system • inlet • column • detector • data system
Gas Chromatography
Gas Chromatography Stationary solid phase column Capillary column
Gas Chromatography
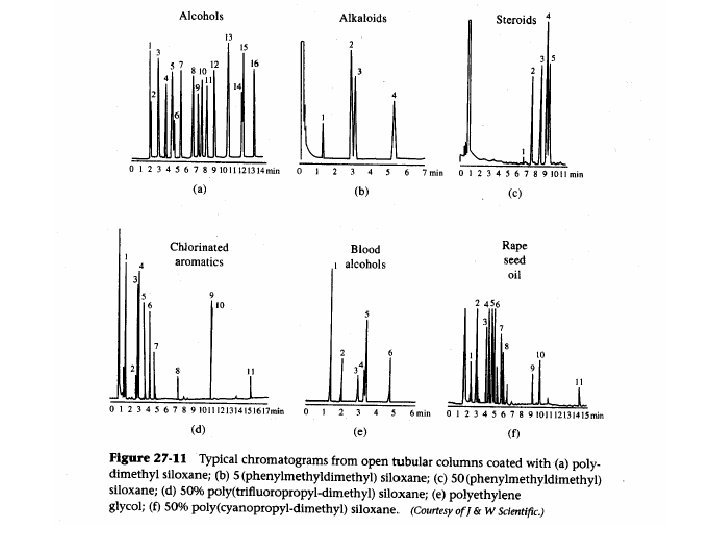
Gas Chromatography Applications QUALITATIVE AND QUANTITATIVE ANALYSIS OF COMPLEX MIXTURES
Gas Chromatography Applications TENTATIVE IDENTIFICATION OF UNKNOWN COMPOUNDS
Gas chromatography advantages 1. Very good separation 2. Time of analysis is short 3. Small sample is needed - l or g 4. Good detection systems 5. Qualitative and quantitative analysis
Gas Chromatography drawbacks 1. Sample has to be volatilized at 250°C without decomposition 2. Nonvolatile compounds can be transformed into stable derivatives but it is: time consuming side reaction can accompany loss of sample
High Performance Liquid Chromatography Once called High Pressure Liquid Chromatography
What is HPLC? • The widely used analytical separations technique • Utilizes a liquid mobile phase to separate components of mixture • Uses high pressure to push solvent through the stationary phase in the column
HPLC is…. • sensitive method • ready adaptable to accurate quantitative analysis • suitable for separating nonvolatile species or thermally unstable ones • ideally suited for separation and identification of biomolecules - amino acids, proteins, nucleic acids, carbohydrates, as well as hydrocarbons, pharmaceuticals, pesticides, pigments, antibiotics, steroids, and a variety of other substances
Scheme of HPLC apparatus
HPLC apparatus
Parts of HPLC apparatus HPLC column HPLC injector
HPLC Chromatogram of 30 amino acids mixture
Advantages of HPLC • High resolution and short time of analysis • HPLC columns can be reused without repacking or regeneration • Greater reproducibility due to close control of the parameters affecting the efficiency of separation • Easy automation of instrument operation and data analysis • Adaptability to large-scale, preparative procedures
What is spectroscopy? ? Spectroscopy is the use of the absorption, emission, or scattering of electromagnetic radiation by matter to qualitatively or quantitatively study the matter or to study physical processes. The matter can be atoms, molecules, atomic or molecular ions, or solids. The interaction of radiation with matter can cause redirection of the radiation and/or transitions between the energy levels of the atoms or molecules. Absorption: A transition from a lower level to a higher level with transfer of energy from the radiation field to an absorber, atom, molecule, or solid. Emission: A transition from a higher level to a lower level with transfer of energy from the emitter to the radiation field. If no radiation is emitted, the transition from higher to lower energy levels is called nonradiative decay. Scattering: Redirection of light due to its interaction with matter.
The full range of electromagnetic radiation
Spectroscopic methods used for structure determination Mass spectrometry (MS) What is molecular formula? Infrared spectroscopy (IR) What functional groups are present? Ultraviolet spectroscopy (UV-VIS) Is a conjugated π-electron system present? Nuclear magnetic resonance spectroscopy (NMR) What carbon-hydrogen (1 H-NMR); carbon-carbon (13 C-NMR) framework is present? X-ray spectroscopy What are bond lenghts and bond angles? Usually, no one single spectroscopic method is reliable by itself for determining the structure of an unknown. A combination of two or more methods is almost always required
Mass spectrometry A mass spectometer has three basic components: ØSomething to volatilize and ionize the molecule into a beam of charged particles ØSomething to focus the beam of particles of the same mass ØSomething to detect the particles Two methods are used to convert molecules into ions (usually positive – cations) electron impact chemical ionization Other methods for ionization -Plasma and glow discharge - Electrospray ionization - Fast atom bombardment (FAB) - Field ionization – uses high energy field - Laser ionization - Matrix assisted lasser desorption ionization - Plasma desorption ionization - Resonance ionization - Secondary ionization - Thermal ionization
Mass spectroscopy by electron impact
In electron impact MS the molecule is bombarded with high energy electrons that knock a weakly bound electron out of molecule. Losing a single electron leaves behind a radical cation: an unpaired electron and a positive charge. Some of these rather unstable radical cations will survive the focusing operation and get to the detector. Molecule first forms the radical cation M+, which then breaks up (fragments) to give radical X* and a cation Y+. Only charged particles can be focused by the magnetic field and do the detector records only ion M+, and positively charged fragments Y+. Uncharged radicals are not recorded.
A mass spectrum will usually be presented as a vertical bar graph, in which each bar represents an ion having a specific mass-to-charge ratio (m/z) and the length of the bar indicates the relative abundance of the ion. The most intense ion is assigned an abundance of 100%, and it is referred to as the base peak. Most of the ions formed in a mass spectrometer have a single charge, so the m/z value is equivalent to mass itself. Modern mass spectrometers easily distinguish (resolve) ions differing by only a single atomic mass unit (amu), and thus provide completely accurate values for the molecular mass of a compound. The highest-mass ion in a spectrum is normally considered to be the molecular ion, and lower-mass ions are fragments from the molecular ion, assuming the sample is a single pure compound. m/z n-hexane 15. 0 26. 0 27. 0 28. 0 29. 0 39. 0 40. 0 41. 0 42. 0 43. 0 44. 0 55. 0 56. 0 57. 0 58. 0 69. 0 70. 0 71. 0 84. 0 86. 0 peak intensity 1. 3 1. 7 22. 7 42. 5 14. 8 3. 1 72. 5 42. 4 80. 9 2. 8 12. 1 70. 5 100. 0 4. 7 8. 5 2. 6 11. 0 3. 2 10. 0
High Resolution Mass Spectroscopy By designing mass spectrometers that can measure m/z values accurately to four decimal places, it is possible to distinguish different molecular formulas of the same nominal mass. Formula C 6 H 12 Mass C 5 H 8 O C 4 H 8 N 2 84. 0939 84. 0575 84. 0688
Hexane shows the same fragmentation pattern as other unbranched alkanes. Thus, alkyl carbocations at m/z=15, 29, 43 and 57 amu provide the dominant peaks in the spectrum. The m/z=57 butyl cation (M-29) is the base peak, and the m/z=43 and 29 ions are also abundant Chain branching clearly influences the fragmentation of this isomeric hexane. The molecular ion at m/z=86 is weaker than that for hexane itself and the M-15 ion at m/z=71 is stronger. The m/z=57 ion is almost absent (try to find a simple cleavage that gives a butyl group). An isopropyl cation (m/z=43) is very strong, and the corresponding propene radical-cation at m/z=42 (colored orange), produced by loss of propane, gives the base peak. By having the six carbons of hexane closed to a ring, the fragmentation is profoundly changed. To begin with, the molecular ion at m/z=84 is much stronger than the corresponding ions in the previous acyclic compounds. The base peak at m/z=56 is produced by loss of ethene, so it is an odd-electron ion (colored orange). The alkenyl cations at m/z=41 & 27 are stronger than the corresponding alkyl cations (m/z=43 & 29). The loss of methyl (m/z=69), and a corresponding small m/z=15 ion obviously require some hydrogen rearrangements.
GC+MS LC+MS + computer libraries of spectra enable qualitative and quantitative analysis of complex mixtures even when very small samples are accessible
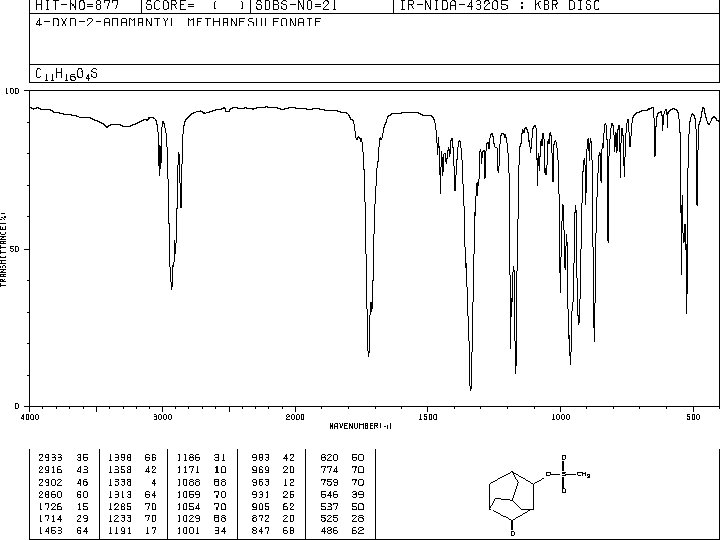
Infrared spectroscopy (IR) What functional groups are present?
INFRARED SPECTROSCOPY IR range λ=2. 5 x 10 -4 cm - 2. 5 x 10 -3 cm /// 2. 5 - 25μm ν = 4000 - 400 [cm-1] (wavewnumber) FUNCTIONAL GROUP FINDER
Infrared spectroscopy detects the stretching and bending of bonds Photon energies associated with this part of the infrared (from 1 to 15 kcal/mole) induce vibrational excitation of covalently bonded atoms and groups. The covalent bonds in molecules are not rigid sticks or rods, such as found in molecular model kits, but are more like stiff springs that can be stretched and bent
symmetric stretching antisymmetric stretching In-plane bending Out-of-plane bending The amount of energy needed for stretching and bending of bonds corresponds infrared weavelenghts IR spectra are simple absorption spectra Wavelength energy corresponding to a specific wavelength is absorbed, the intensity of the radiation reaching a detector decreases, and this is recorded in the spectrum.
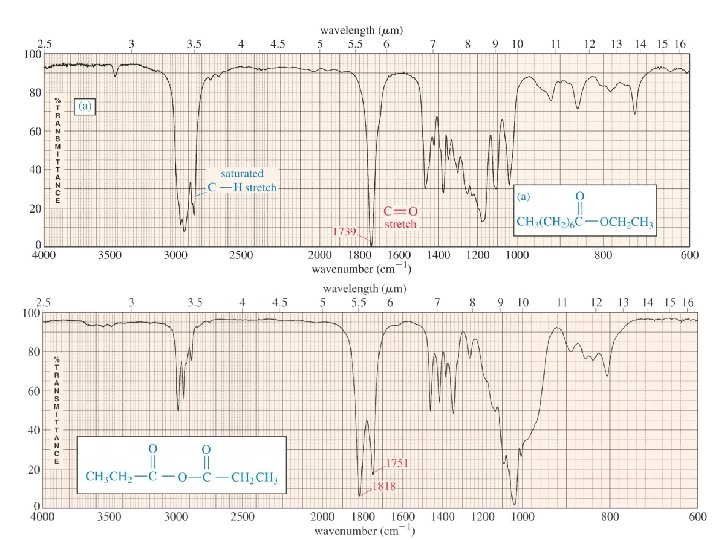
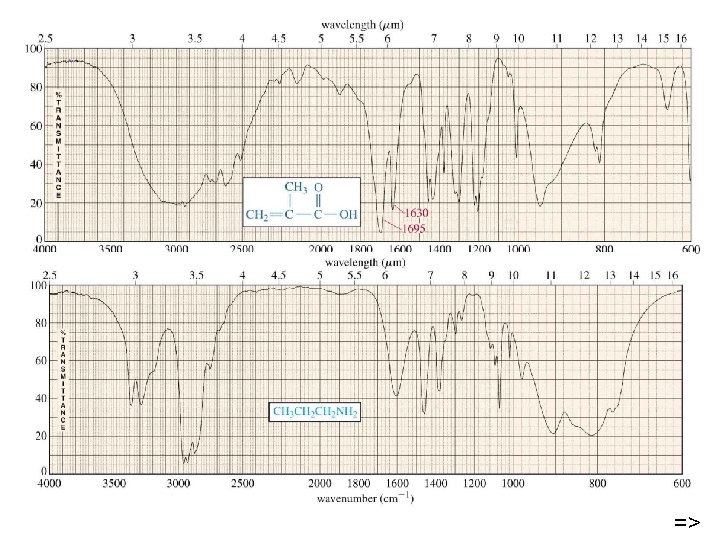
Regions of IR spectra 600 -1500 cm-1 fingerprint region 1500 - 2000 cm-1 streching of C=C, C=O, C=N bonds 2000 -2500 cm-1 streching of C≡C, C≡N bonds 2500 -4000 cm-1 streching of C-H, N-H, O-H bonds
Typical Infrared Absorption Frequencies Stretching Vibrations Functional Class Range (cm-1) Intensity Assignment Bending Vibrations Range (cm-1) Intensity Assignment Alkanes 2850 -3000 str CH 3, CH 2 & CH 2 or 3 bands 1350 -1470 1370 -1390 med CH 2 & CH 3 deformation Alkenes 3020 -3100 1630 -1680 Med. var 880 -995 780 -850 Str Med. med =C-H & =CH 2 (out-of-plane bending) cis-RCH=CHR 1900 -2000 str =C-H & =CH 2 (sharp) C=C (symmetry reduces intensity) C=C asymmetric stretch Alkynes 3300 2100 -2250 Str var C-H (usually sharp) C≡C (symmetry reduces intensity) 600 -700 str C-H deformation Arenes 3030 1600 & 1500 Var med-wk C-H C=C (in ring) (2 bands) (3 if conjugated) 690 -900 str-med C-H bending & ring puckering Var Str str O-H (free), usually sharp O-H (H-bonded), C-O 1330 -1430 650 -770 Med. var-wk Alcohol & Phenols 3580 -3650 3200 -3550 970 -1250 675 -730 O-H bending (in-plane) O-H bend (out-of-plane)
Typical Infrared Absorption Frequencies Stretching Vibrations Functional Class Amines Aldehydes & Ketones Carboxylic Acids & Derivatives Nitriles Range (cm-1) Intensity Bending Vibrations Assignment Range (cm-1) 3400 -3500 (dil. soln. ) 3300 -3400 (dil. soln. ) 1000 -1250 Wk Wk med N-H (1°-amines) N-H (2°-amines) C-N 1550 -1650 660 -900 2690 -2840(2 bands) 1720 -1740 1710 -1720 1690 1675 1745 1780 Med Str Str Str C-H (aldehyde C-H) C=O (sat. aldehyde) 1350 -1360 C=O (sat, ketone) 1400 -1450 aryl ketone 1100 α, β-unsaturation Cyclopentanone cyclobutanone 2500 -3300 (acids) overlap C-H 1705 -1720 (acids) 1210 -1320 (acids) 1785 -1815 ( acyl halides) 1750 & 1820 (anhydrides) 1040 -1100 1735 -1750 (esters) 1000 -1300 1630 -1695(amides) 2240 -2260 Str O-H (very broad) Str med-str Str Str Str str med C=O (H-bonded) O-C (2 -peaks) C=O (2 -bands) O-C C=O O-C (2 -bands) C=O (amide I band) C≡N (sharp) Intensity Med. var Assignment NH 2 sciss 1°amines) NH 2 & N-H wagging (shifts on H-bonding) str med. α-CH 3 bending α-CH 2 bending C-C-C bending 1395 -1440 med C-O-H bending 1590 -1650 1500 -1560 Med med N-H (1¡-amide) II band N-H (2¡-amide) II band
cyclohexane 2850 -3000 cm-1 C-H stretching 1350 -1470 cm-1 C-H bending cyclohexene 1630 -1680 cm-1 C=C stretching 3020 -3100 cm-1 C=C-H stretching 2850 -3000 cm-1 C-H stretching 1350 -1470 cm-1 C-H bending benzene 3020 -3100 cm-1 C=C-H stretching 1500 cm-1 C=C in ring stretching 690 -900 cm-1 C-H bending
Nuclear Magnetic Resonance (NMR) Mass spectroscopy - size of molecule (molecular weight and formula) IR spectroscopy – functional groups Nuclear magnetic resonance NMR Map of carbon hydrogen framework
Earth’s magnetic field has a field strength of 2 x 10 -5 tesla Magnet used in an NMR machine has a field strength of between 2 -10 tesla Atomic nuclei act like tiny compass needles and have different energy when placed in magnetic field. The compass needle can rotate through 360º so have infinite number of different energy levels.
In absence of any external field the spins of magnetic nuclei are oriented randomly. When a sample containing these nuclei is placed between the poles of strong magnet, nuclei adopt specific orientation so that their tiny magnetic field is aligned parallel or antiparallel to external field. If we irradiate such oriented nuclei energy absorption will occur and lower energy state will flip to higher energy. When this flip occurs we say that nuclei is in a resonance with the applied radiation So the name nuclear magnetic resonance
Three types of nuclei Carbon 12 C; Oxygen 16 O (Even atomic number, even mass number) Not spinning, not possible to detect via NMR Odd atomic number or odd atomic mass the nucleus is spinning Spherical shape nuclei – spin number ½ - 1 H; 13 C; 15 N; 19 F; 29 Si; 31 P Quadrupolar nuclei – spin number I > ½ - 2 H; 11 B; 14 N; 17 O; 33 S; 35 Cl
Dissolve in a suitable solvent Put in a very strong magnetic field Irradiate with a short pulse of radiofrequency energy
Schematic operation of an NMR spectrometer The exact frequency required for nuclei resonance depends on: The molecule (identity of the nuclei) Strength of the external magnetic field
NMR – is using a radiofrquency radiation
The difference in energy between the two spin states is dependent on the external magnetic field strength, and is always very small. The following diagram illustrates that the two spin states have the same energy when the external field is zero, but diverge as the field increases. At a field equal to Bx a formula for the energy difference is given (remember I = 1/2 and μ is the magnetic moment of the nucleus in the field). 1. 41 -4. 7 T 1. 4 T – 60 MHz - 1 H-NMR 15 MHz- 13 C-NMR Stronger magnetic field – energy difference larger – higher frequency needed
Resonance of protons in water molecule As an example, consider a sample of water in a 2. 3487 T external magnetic field, irradiated by 100 MHz radiation. If the magnetic field is smoothly increased to 2. 3488 T, the hydrogen nuclei of the water molecules will at some point absorb rf energy and a resonance signal will appear
Why protons in organic molecule show absorption at different frequencies? When external field is applied the moving electrons set up tiny local magnetic fields so effective magnetic field is changed by local fields. Shielding or deshielding effect may be different for each nuclei So we can distinct NMR signal for each chemically different hydrogen or carbon nuclei
Methyl acetate intensity 1 H-NMR Chemical shift 13 C-NMR intensity 13 C-NMR and 1 H-NMR cannot be observed at one time – they require different amounts of energy to „flip” spins of nuclei Chemical shift
General features of 1 H-NMR spectra 1. Chemical shifts 2. Number of NMR absorptions 3. Integration of NMR absorptions 4. Spin – spin splitting pattern
Chemical shift Increasing field Lowfield Downfield Nuclei deshielded Upfield Highfield Nuclei shielded TMS signal By convention set to 0 Chemical Shift (d) = frequency observed (Hz)/oscillator frequency (MHz) = ppm 8 ppm 7 ppm 6 ppm 5 ppm 4 ppm 3 ppm 1 ppm = 60 Hz for apparatus working at 60 MHz 1 ppm = 250 Hz for apparatus working at 250 MHz 2 ppm 1 ppm 0 ppm
Chemical shifts ! (important) Most proton chemical shifts range 0 -10 ppm If the electron density about a proton nucleus is relatively high, the induced field due to electron motions will be stronger than if the electron density is relatively low. The shielding effect in such high electron density cases will therefore be larger, and a higher external field (Bo) will be needed for the rf energy to excite the nuclear spin. Since silicon is less electronegative than carbon, the electron density about the methyl hydrogens in Tetra. Methyl. Silane is expected to be greater than the electron density about the methyl hydrogens in neopentane (2, 2 -dimethylpropane), and the characteristic resonance signal from the silane derivative does indeed lie at a higher magnetic field. Such nuclei are said to be shielded. Elements that are more electronegative than carbon should exert an opposite effect (reduce the electron density); and, as the data in the following tables show, methyl groups bonded to such elements display lower field signals (they are deshielded). The deshielding effect of electron withdrawing groups is roughly proportional to their electronegativity.
Chemical shifts for different protons
Proton equivalence Chemically distinct hydrogen has its own unique absorption – so we need to find how many different hydrogens are present in a structure Definition of proton equivalence: If the protons are chemically equivalent, the same product will be formed regardless on which proton is replaced. If protons are not chemically equivalent, different products will be formed on substitution. δ = 1. 71 ppm 2, 3 -dimethylbut-2 -ene
Dipropyl ether
Proton Chemical Shift Ranges Low field region High field region
Regions of the 1 H-NMR spectrum Chemical shift 0 -1. 5 ppm Proton type Comments Protons on carbon next to saturated centers absorb in this region. Thus, the alkane portions of most organic molecules show complex absorption here 1. 5 -2. 5 ppm Protons on carbon next to unsaturated centers (allylic, benzylic, next to carbonyl) show characteristic absorptions in this region, just downfield from other alkane resonance. 2. 5 -4. 5 ppm Protons on carbon linked to electronegative atoms (halogen, O, N) are deshielded because of the electron-withdrawing ability in this midfield region. 4. 5 -6. 5 ppm Protons on double-bond carbons (vinylic protons) are strongly deshielded by neighbouring π-bond and therefore absorb in this characteristic downfield region 6. 5 -8. 0 ppm Protons on aromatic rings (aryl protons) are strongly deshielded by the π orbital of the ring and absorb in this characteristic low-field range.
δ = 0. 23 ppm CH 4 methane δ = 3. 06 ppm CH 3 Cl chloromethane δ = 5. 47 ppm CH 2 Cl 2 methylene chloride δ = 7. 26 ppm CHCl 3 chloroform
Integration of 1 H-NMR – proton counting The area of signal is proportional to the number of protons creating that signal. By integrating this area it is possible to measure the relative number of each kind of proton in molecule The magnitude or intensity of NMR resonance signals is displayed along the vertical axis of a spectrum, and is proportional to the molar concentration of the sample. Thus, a small or dilute sample will give a weak signal, and doubling or tripling the sample concentration increases the signal strength proportionally. If we take the NMR spectrum of equal molar amounts of benzene and cyclohexane in CDCl 3 solution, the resonance signal from cyclohexane will be twice as intense as that from benzene because cyclohexane has twice as many hydrogens per molecule. This is an important relationship when compounds with two or more different sets of hydrogen atoms are examined, since it allows the ratio of hydrogen atoms in each distinct set to be determined
Diethyl ether 1: 1. 5 4: 6 1 1. 5
2 -chloro-1 -ethoxy-5 -hexen-3 -one Integration 1: 2: 1: 1: 1: 2: 2: 3
Spin-Spin Interactions The splitting patterns found in various spectra are easily recognized, provided the chemical shifts of the different sets of hydrogen that generate the signals differ by two or more ppm. The patterns are symmetrically distributed on both sides of the proton chemical shift, and the central lines are always stronger than the outer lines. The most commonly observed patterns have been given descriptive names, such as doublet (two equal intensity signals), triplet (three signals with an intensity ratio of 1: 2: 1) and quartet (a set of four signals with intensities of 1: 3: 3: 1). The line separation is always constant within a given multiplet, and is called the coupling constant (J). The magnitude of J, usually given in units of Hz, is magnetic field independent.
What causes this signal splitting, and what useful information can be obtained from it ? If an atom under examination is perturbed or influenced by a nearby nuclear spin (or set of spins), the observed nucleus responds to such influences, and its response is manifested in its resonance signal. This spin-coupling is transmitted through the connecting bonds, and it functions in both directions. Thus, when the perturbing nucleus becomes the observed nucleus, it also exhibits signal splitting with the same J. For spin-coupling to be observed, the sets of interacting nuclei must be bonded in relatively close proximity (e. g. vicinal and geminal locations), or be oriented in certain optimal and rigid configurations. Using this terminology, a vicinal coupling constant is 3 J and a geminal constant is 2 J.
Protons chemically equivalent do not exhibit spin-spin splitting No splitting occurs Protons having n equivalent neighboring proton gives signal splitted into n+1 lines Splitting observed Splitting not observed
Splitting of 1 H-NMR signals Ho Hproton
Splitting of 1 H-NMR signals
Splitting of 1 H-NMR signals If a given nucleus is spin-coupled to two or more sets of neighboring nuclei by different J values, the n+1 rule does not predict the entire splitting pattern. Instead, the splitting due to one J set is added to that expected from the other J sets. Bear in mind that there may be fortuitous coincidence of some lines if a smaller J is a factor of a larger J.
Summary of 1 H-NMR spectra 1. Chemical shifts – kind of hydrocarbon framework 2. Number of NMR absorptions – groups of chemically equivalent protons 3. Integration of NMR absorptions – relative number of different protons 4. Spin – spin splitting pattern – groups of neighbouring protons
Carbon framework – 13 C-NMR 1. 1% of elemental carbon is the 13 C isotope, which has a spin I = 1/2, so it is possible to conduct a carbon NMR experiment 1. The abundance of 13 C in a sample is very low (1. 1%), so higher sample concentrations are needed. 2. The 13 C nucleus is over fifty times less sensitive than a proton in the NMR experiment. 3. Hydrogen atoms bonded to a 13 C atom split its NMR signal by 130 to 270 Hz, further complicating the NMR spectrum
1 H-NMR spectrum of camphor.
13 C-NMR spectrum of camphor.
13 C-NMR spectrum of camphor Decoupling of carbon-hydrogen splitting When spectrum acquired in this manner, the carbon NMR spectrum of a compound displays a single sharp signal for each structurally distinct carbon atom in a molecule.
Part of 13 C-NMR spectrum of camphor
Identifying the molecule by 13 CNMR Low field region High field region
UV-VIS SPECTROSCOPY
UV-vis spectroscopy uses ultraviolet and visible light
UV-vis spectroscopy (200 - 800 nm) Violet: 400 - 420 nm Indigo: 420 - 440 nm Blue: 440 - 490 nm Green: 490 - 570 nm Yellow: 570 - 585 nm Orange: 585 - 620 nm Red: 620 - 780 nm
UV-vis spectroscopy Most spectrometers display absorbance on the vertical axis, and the commonly observed range is from 0 (100% transmittance) to 2 (1% transmittance). The wavelength of maximum absorbance is a characteristic value, designated as λmax. Absorption may be presented as: transmittance (T = I/I 0) or absorbance (A= log I 0/I).
UV-vis spectroscopy Absorbance of a sample is proportional to the number of absorbing molecules in the spectrometer light beam (e. g. their molar concentration in the sample tube), it is necessary to correct the absorbance value for this and other operational factors if the spectra of different compounds are to be compared in a meaningful way. The corrected absorption value is called "molar absorptivity, (or extinction), and is useful when comparing the spectra of different compounds and determining the relative strength of light absorbing functions (chromophores). Molar absorptivity (ε) is defined as: Molar Extinction ε = A / c×l (where A= absorbance, c = sample concentration in moles/liter & l = length of light path through the sample in cm. )
Electronic transitions in unsaturated molecules
UV-vis spectroscopy Chromophore Example Excitation λmax, nm ε Solvent C=C Ethylene π __> π* 171 15, 000 hexane C≡C 1 -Hexyne π __> π* 180 10, 000 hexane C=O Acetaldehyde n π __> π* π* 290 180 15 10, 000 hexane N=O Nitromethane n π __> π* π* 275 200 17 5, 000 ethanol C-X X=Br X=I Methyl bromide Methyl Iodide n n __> σ* σ* 205 255 200 360 hexane __> __>
UV-vis spectroscopy Molecular moieties likely to absorb light in the 200 to 800 nm region are π-electron functions and heteroatoms having non-bonding valence-shell electron pairs. Such light absorbing groups are referred to as chromophores orange β-carotene
Empirical Rules for Absorption Wavelengths of Conjugated Systems Woodward-Fieser Rules for Calculating the λmax of Conjugated Dienes and Polyenes Core Chromophore Transoid Diene 215 nm Substituent and Influence R- (Alkyl Group). . +5 nm RO- (Alkoxy Group). . +6 X- (Cl- or Br-). . +10 RCO- (Acyl Group). . 0 RS- (Sulfide Group). . +30 R 2 N- (Amino Group). . +60 Further π -Conjugation C=C (Double Bond). . . +30 C 6 H 5 (Phenyl Group). . . +60 Cyclohexadiene* 260 nm (i) Each exocyclic double bond adds 5 nm. In the example on the right, there are two exo-double bond components: one to ring A and the other to ring B. (ii) Solvent effects are minor. * When a homoannular (same ring) cyclohexadiene chromophore is present, a base value of 260 nm should be chosen. This includes the ring substituents. Rings of other size have a lesser influence.
Woodward-Fieser Rules for Calculating the π __> π* λmax of Conjugated Carbonyl Compounds Core Chromophore R = Alkyl 215 nm R = H 210 nm R = OR' 195 nm Cyclopentenone 202 nm Substituent and Influence α- Substituent R- (Alkyl Group) +10 nm Cl- (Chloro Group) +15 Br- (Chloro Group) +25 HO- (Hydroxyl Group) +35 RO- (Alkoxyl Group) +35 RCO 2 - (Acyl Group) +6 β- Substituent R- (Alkyl Group) +12 nm Cl- (Chloro Group) +12 Br- (Chloro Group) +30 HO- (Hydroxyl Group) +30 RO- (Alkoxyl Group) +30 RCO- (Acyl Group) +6 RS- (Sulfide Group) +85 R 2 N- (Amino Group) +95 γ & δ- Substituents R- (Alkyl Group) +18 nm (both γ & δ) HO- (Hydroxyl Group) +50 nm (γ) RO- (Alkoxyl Group) +30 nm (γ) Further π -Conjugation C=C (Double Bond). . . +30 C 6 H 5 (Phenyl Group). . . +60 (i) Each exocyclic double bond adds 5 nm. In the example on the right, there are two exodouble bond components: one to ring A and the other to ring B. (ii) Homoannular cyclohexadiene component adds +35 nm (ring atoms must be counted separately as substituents) (iii) Solvent Correction: water = – 8; methanol/ethanol = 0; ether = +7; hexane/cyclohexane = +11 λmax (calculated) = Base + Substituent Contributions and Corrections