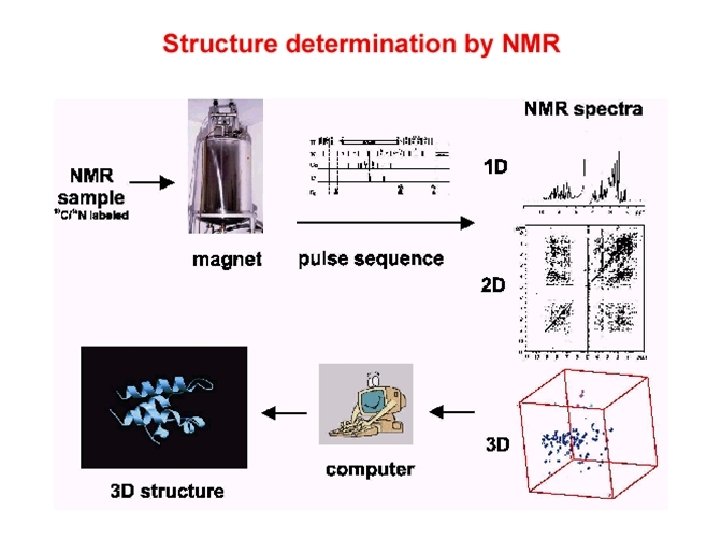
Structure determination by NMR NMR principles Data acquisition

Structure determination by NMR Ø NMR principles Ø Data acquisition Ø Spectra process Øxwinnmr、nmrpipe、nmrview、Topspin Ø Assignment Øsparky Ø Data Analysis Ø Structure determination ØInsight. II、Xplor、CNS Ø Structural analysis ØProcheck、Molmol、Pymol

~~NMR Experiments studies~~

Sample prepare • High concentrated protein – 10 mg-30 mg • Proton labeling – H 1 -N 15 -C 13 • Limitation – Protein molecular size <25 Kda

Modern Fourier transform NMR spectrometer Coil and superconductor LN 2 and LHe 2 tank

Spectra process and Assignment Ø Chemical shifts in proteins

Spectra process and Assignment Ø Chemical shifts in proteins the a-proton is always around 4 ppm; the aromatic protons are around 7 ppm ; the backbone amides at 8 ppm.

Well-dispersed 1 D Spectrum Hα, H 2 O HN, aromatic CH, CH 2, CH 3

Why do we go beyond one dimension? • To resolve the crowded signals in 1 D spectrum by spreading them into other dimensions. • To elucidate the “through-bond” and “through-space” relationships between the spins in the molecules.

General scheme for two-dimensional NMR spectroscopy.

Dependence of the NMR signal on the evolution period, t 1.

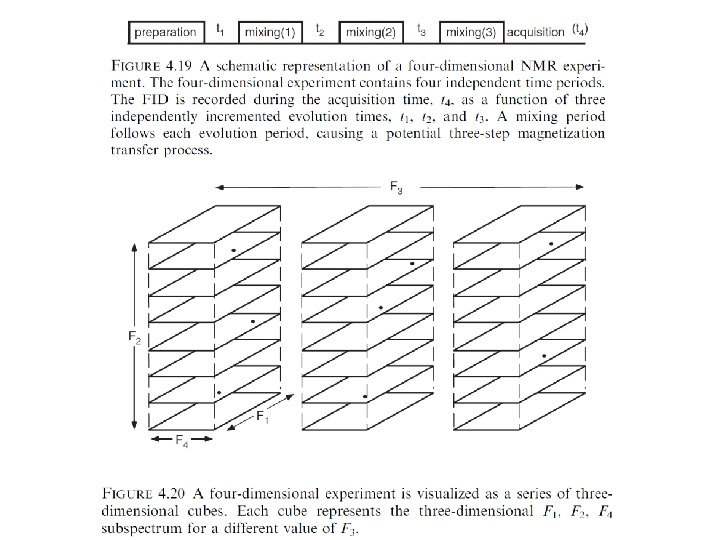
The functions of the different periods of a two-dimensional NMR experiment are summarized as follows: • • Preparation: The desired nonequilibrium state of the spin system is prepared from the initial (equilibrium) state of the spin system. The preparation period in its simplest form consists of a single pulse that generates transverse magnetization, but more complex sequences of pulses can be used to prepare other coherences, such as multiple quantum coherences, and to perform solvent suppression. Evolution: The off-diagonal components of the density operator prepared in step (1) evolve under the Hamiltonian, He. During the course of the experiment, the incrementable time t 1 normally begins at an initial value and increases in discrete steps to a maximum value, t 1 max. The Hamiltonian, He , may be the free-precession Hamiltonian or may include applied rf fields. The frequencies with which the detected coherence evolves during t 1 results in signals appearing at those frequencies in the F 1 dimension of the final two-dimensional spectrum. This process is known as F 1 frequency labeling of the coherence. Mixing: During the mixing period, coherence is transferred from one spin to another. The mixing period is the key to establishing the type of correlation between the two dimensions and consequently dictates the information content of the spectrum. Depending on the type of experiment, the mixing period consists of one or more pulses and delays. Acquisition: The FID is recorded in the conventional fashion. As discussed in Section 4. 3, if more than one coherence transfer pathway is feasible, phase cycling or field gradient pulses are used to determine which coherence transfer processes contribute to the final spectrum.

Schematic generation of a three-dimensional NMR experiment from the combination of two-dimensional NMR experiments.

The development of a three-dimensional data set from a two-dimensional data set.

Two-dimensional Fourier Transform NMR
 – The original 2 D experiment. Used to identify")
• COSY (correlation spectroscopy) – The original 2 D experiment. Used to identify nuclei that share a scalar (J) coupling. The presence of off-diagonal peaks (crosspeaks) in the spectrum directly correlates the coupled partners. • NOESY (Nuclear Overhauser Effect Spectroscopy) – A 2 D method used to map NOE correlations between protons within a molecule. The spectra have a layout similar to COSY but cross peaks now indicate NOEs between the correlated protons.

Two-dimensional Fourier Transform NMR

2 D COSY: thru bond

Spin system identification 2 D COSY of isoleucine

Spin system identification

The five regions of the COSY spectrum containing the fingerprint cross-peaks.
 spectroscopy")
TOCSY Total Correlation Spectroscopy HOHAHA(homonuclear Hartmann– Hahn) spectroscopy

Pulse sequence and coherence level diagram for the TOCSY experiment.
,")
Sections of H 2 O TOCSY spectra acquired with mixing times of 48 (left), 83 (center), and 102 ms (right).
")
Cross-Relaxation NMR Experiments NOESY (Nuclear Overhauser Effect Spectroscopy)

Pulse sequence and coherence level diagram for the NOESY experiment.

2 D NOESY: thru space

Secondary structure elements have characteristic NOE patterns

Assignment Sequential assignment Side chain assignment

Sequential assignment

Spectra process and Assignment Ø 2 D NMR spectroscopy

Spectra process and Assignment Ø 2 D NMR spectroscopy Ø 2 D TOCSY

Spectra process and Assignment Ø 2 D NMR spectroscopy Ø 2 D NOESY and TOCSY

Spectra process and Assignment Ø Assignment

Spectra process and Assignment Ø Assignment – TOCSY : identify spin system HN 91 HN 92 HN 93 0 g b b b 4 0 a a a Ha 91 Ha 93 Ha 92 10 6 10 0 10 7

Spectra process and Assignment Ø Assignment - sequential assignment

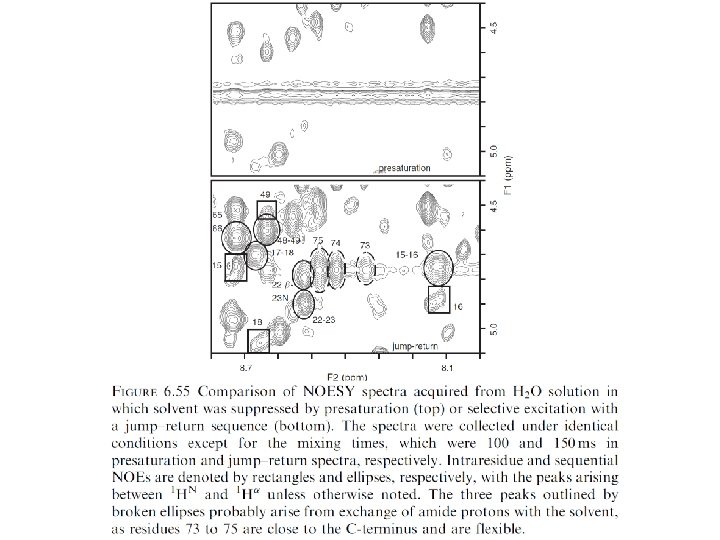
Spectra process and Assignment Ø Assignment – NOESY : sequential assignment

Spectra process and Assignment Ø Assignment - sequential assignment

TOCSY : Amide to Aliphatic Region N’-ACGSC RKKCK GSGKC INGRC KCY-C’

NOESY and TOCSY : Amide to a Region H O H H N C C N C H H O

KWRRWVRWI

Chemical Shift Table for 20 Common Amino Acids

Chemical Shift Table for 20 Common Amino Acids
 Heteronuclear single-quantum coherence (HSQC) TROSY")
heteronuclear multiple-quantum coherence (HMQC) Heteronuclear single-quantum coherence (HSQC) TROSY
 15 N labeling • Grow proteins on minimal media (M")
Isotope-labeling of proteins (I) 15 N labeling • Grow proteins on minimal media (M 9) with 15 NH 4 Cl as the sole nitrogen source. • $100 -$1000 for m. M sample. • Structure elucidation of medium-sized proteins (50100 a. a. )
 15 N, 13 C labeling • Grow proteins on minimal")
Isotope-labeling of proteins (II) 15 N, 13 C labeling • Grow proteins on minimal media (M 9) with 15 NH Cl as the sole nitrogen source and 13 C 4 glucose as the sole carbon source. • $1000 -$10000 for m. M sample. • Structure elucidation of larger proteins (100250 a. a. )
 15 N, 13 C, 2 H labeling • Grow proteins")
Isotope-labeling of proteins (III) 15 N, 13 C, 2 H labeling • Grow proteins on minimal media (M 9) with 15 N 2 H 4 Cl as the sole nitrogen source and 13 C, 2 H-glucose as the sole carbon source in deuterated water. • Re-exchange deuterium on amide nitrogen to protons. • Strain must be adapted to grow on D 2 O. • > $10000 for m. M sample. • Structure elucidation of larger proteins (> 200 a. a. )
 Site-specific labeling • Add labeled amino acids to non-labeled media.")
Isotope-labeling of proteins (IV) Site-specific labeling • Add labeled amino acids to non-labeled media. • Assuming that the amino acid is not metabolized, all residues corresponding to that amino acid will be labeled in the protein. • Technique is interesting when structural or dynamic information is only required for specific residues. Thereby, the complete assignment of the protein may be circumvented.

H 1 -N 15 label HSQC

Assigned HSQC

2 D 1 H-13 C HSQC

2 D 1 H-13 C HSQC

2 D 1 H-13 C HSQC
CA 2. HNCO &")
Triple Resonance Experiment Use for Sequence Assignment 1. HNCA & HN(CO)CA 2. HNCO & HN(CA)CO 3. NHCBCA & CBCA(CO)NH
CO Regions generated from Tyr 56 to Glu 63 are shown here.")
HNCO and HN(CA)CO Regions generated from Tyr 56 to Glu 63 are shown here. Red contours :former residues Black contours :intra-residues. Black and Red contours :intra- and inter-residue cross peaks are overlapping
CA Regions generated from Tyr 56 to Glu 63 are shown here.")
HNCA and HN(CO)CA Regions generated from Tyr 56 to Glu 63 are shown here. Red contours :former residues Black contours :intra-residues. Black and Red contours :intra- and inter-residue cross peaks are overlapping
NH Regions generated from Tyr 56 to Glu 63 are shown here.")
HNCACB + CBCA(CO)NH Regions generated from Tyr 56 to Glu 63 are shown here. The black lines show the scalar connectivities by Cα atoms and the blue lines show the scalar connectivities by Cβ atoms.

HCCH-TOCSY for side-chain proton assignments Strip plot extracted from a 3 D HCCH-TOCSY spectrum obtained with uniformly 13 C-labeled HP 0495 in D 2 O

Sparky - NMR Assignment and Integration Software • http: //www. cgl. ucsf. edu/home/sparky/

Structure determination by NMR Ø NMR principles Ø Data acquisition Ø Spectra process Øxwinnmr、nmrpipe、nmrview、Topspin Ø Assignment Øsparky Ø Data Analysis Ø Structure determination ØInsight. II、Xplor、CNS Ø Structural analysis ØProcheck、Molmol、Pymol

Data Analysis and Structure determination Ø Data Analysis Ø NOESY – distance restrain Ø CSI – chemical shift index Ø Structure determination Ø principles

Data Analysis Ø NOESY

Data Analysis Ø NOESY medium range NOEs : i to i+2, i+3, i+4 long range NOEs : i to i+5……. filled circles < 6. 0 Hz, open circles > 7. 0 Hz filled diamonds k. NH < 0. 02 min-1

Data Analysis Ø NOESY H : Slowly exchanging (k. NH < 0. 02 min-1 ) amide protons the observed crosspeaks Hydrogen bonds NOE restrain : 20 -30/per residues

Data Analysis Ø CSI, chemical shift index

Data Analysis Ø CSI

Structure determination Ø Calculation u There is no method for a "direct" or ab initio calculation of a structure from NMR data. We have to include assumptions to make up the lack of experimental data. We therefore have to provide e. g. bond distances and angles for amino acids. u NMR structure calculation cannot result in the structure. Instead structure calculation is repeated many times, producing a large number of structural models. All the models that satisfy the experimental constraints are assumed as being representative of the protein.

Data Analysis Ø Calculation

Data Analysis Ø Calculation • Start: The temperature is set to 1000 -3000 Kelvin which is very hot. At this extreme temperature different conformations of the polypeptide convert into each other very fast. In a completely random manner a large number of conformations are sampled. • We let the protein hop and shake around under these unnatural conditions to allow it to sample as many conformations as possible. The NOE distances are always switched on to force the protein to preferentially choose conformations that agree with the NOESY distances. • After a while the temperature is slowly reduced over quite some time to room temperature. While the system cools down we slowly reintroduce a correct description of the protein. • In the end, we simulate the protein as correct as it is possible on a computer. • The structure at the very end of the protocol is saved.

Data Analysis Ø Calculation

Protein NMR Structure Determination Protein in solution ~0. 5 ml, 2 m. M concentration NMR spectroscopy 1 D, 2 D, 3 D, … Sequence-specific Resonance assignment Extraction of Structural information Sample preparation: cloning, Distances between protein expression Secondary protons (NOE), purification, structureangles(J of Dihedral characterization, protein coupling), H-bond isotopic labeling. (Amide-proton exchange rate ), Structure calculation RDC restraints Structure refinement Final 3 D structures

The Completeness of Assignment is an Determinant for NOESY Assignment residue N C C C other Q 1 124. 279 (8. 379) 175. 880 60. 337 (4. 111) 27. 906 (2. 834, 2. 302) C , 31. 404 (2. 644, 2. 644) D 2 114. 136 (7. 959) 174. 728 52. 070 (4. 746) 42. 126 (3. 154, 3. 154) W 3 124. 678 (9. 602) 178. 494 58. 251 (5. 635) 32. 468 (3. 526, 3. 317) C 1, 128. 925 (7. 384); C 3, 124. 926 (8. 290); C 2, 123. 330 (7. 286); C 2, 114. 589 (7. 308); C 3, 120. 036 (6. 811); N 1, 129. 962 (10. 193) E 4 120. 757 (8. 707) 178. 990 59. 771 (3. 782) 27. 665 (2. 021, 2. 021) C , 34. 591 (2. 422, 2. 200) T 5 118. 196 (8. 910) 175. 760 65. 742 (3. 942) 67. 089 (3. 739) C 2, 22. 548 (1. 248) F 6 122. 999 (8. 796) 177. 890 61. 930 (4. 228) 39. 135 (3. 615, 3. 171) C 1, 132. 878 (7. 165); C 2, 132. 878 (7. 165); C 1, 129. 972 (7. 024); C 2, 129. 972 (7. 024); C , 128. 127 (6. 834) Q 7 117. 315 (8. 118) 178. 649 59. 520 (3. 647) 30. 229 (1. 193, 1. 193) C , 34. 492 (1. 851, 1. 851); N 2, 107. 564 (6. 195, 4. 472) K 8 118. 131 (7. 449) 178. 680 58. 946 (4. 036) 32. 895 (1. 807, 1. 770) C , 25. 188 (1. 487, 1. 487); C , 29. 128 (1. 710, 1. 710); C , 42. 023 (2. 944, 2. 944) K 9 115. 307 (8. 261) 176. 634 57. 489 (4. 167) 34. 724 (1. 626, 1. 626) C , 26. 475 (1. 090, 1. 090); C , 29. 549 (1. 398, 1. 398); C , 41. 720 (2. 882, 2. 882) H 10 106. 834 (7. 803) 173. 998 55. 370 (4. 846) 30. 286 (2. 767, 2. 000) C 2, 122. 074 (6. 786); C 1, 137. 835 (8. 755) L 11 120. 994 (8. 311) 176. 088 55. 178 (5. 406) 41. 738 (2. 156, 2. 156) C , 26. 267 (1. 788); C 1, 24. 285 (1. 103); C 2, 24. 285 (1. 103) T 12 114. 206 (8. 237) 171. 678 58. 813 (5. 003) 69. 998 (3. 775) C 2, 19. 537 (1. 220) D 13 125. 154 (8. 271) 175. 311 52. 472 (4. 874) 39. 360 (3. 060, 2. 766) T 14 114. 229 (8. 106) 172. 387 58. 915 (4. 802) 69. 593 (4. 067) C 2, 19. 268 (0. 947) K 15 124. 290 (8. 239) 176. 948 57. 949 (3. 623) 32. 306 (1. 440, 1. 440) C , 24. 692 (0. 736, 0. 405); C , 29. 281 (1. 423, 1. 423); C , 41. 742 (2. 741, 2. 741) K 16 120. 841 (7. 904) 174. 770 53. 666 (4. 277) 30. 617 (1. 680, 1. 680) C , 24. 350 (1. 234, 1. 234); C , 28. 913 (1. 545, 1. 545); C , 41. 894 (2. 953, 2. 953) V 17 121. 789 (6. 052) 175. 994 62. 623 (3. 325) 32. 235 (1. 441) C 1, 21. 082 (0. 405); C 2, 19. 392 (0. 105) K 18 128. 767 (8. 665) 176. 794 53. 827 (4. 488) 29. 301 (1. 886, 1. 886) C , 19. 141 (1. 548, 1. 548); C , 24. 296 (1. 748, 1. 748); C , 42. 046 (3. 062, 3. 062) C 19 122. 110 (8. 066) 174. 536 58. 997 (3. 692) 40. 173 (3. 027, 2. 339) D 20 118. 616 (8. 880) 177. 547 57. 451 (4. 453) 38. 424 (3. 056, 2. 905)

Structural Statistics of the Best 20 Structures

Ramachandran Plot

3 D Structure Determination of RNase 3 from Rana catesbeiana

References • http: //www. cis. rit. edu/htbooks/nmr/inside. htm • “Spin Dynamics: Basics of Nuclear Magnetic Resonance” by Malcolm H. Levitt • “Protein NMR Spectroscopy: Principles and Practice” by Cavanagh, John, and Fairbrother, Wayne J, and Palmer, Arthur G, III, 2006. • “High-Resolution NMR Techniques in Organic Chemistry” by J. -E. Ba¨ckvall, J. E. Baldwin and R. M. Williams, 2009. • Wuthrich, K. “NMR pf protein and Nucleic Acids” Wiley-intersciences, 1986.

References • Derome, A. “Modem NMR Techniques for Chemistry Research” Pergamon, 1987. • Clore, G. M. and Gronenbron, A. M. (1994) Protein Science, 3, 372 -390 “Structures of Large Proteins, Protein-Ligand protein –DNA Complexes by Multidimensional Heteronuclear NMR”. • Croasmun, W. R. and Carlson, R. M. “Two-Dimensional NMR Spectroscopy-application for Chemists and Biochemists” VCH, 1994. • Crai. K, D. J. “NMR in Drug Design” CRC Series in Analytical Biotechnology, 1996. • Reid, D. G. “Protein NMR Techniques” Methods in Molecular Biology, 1997. • 科儀新知 1994年六月份。 • Yee, A. et al. (2002) PANS, 99, 1825 -1830 “An NMR approach to structure proteomics”. • Clore, G. M. and Gronenbron, A. M. (1998) TIBTECH, 16, 22 -34 “Determining the Structures of Large Proteins, Protein Complexes by NMR”. • Clore, G. M. and Gronenborn A. M. (1998) New Methods of Structure Refinement for Macromolecular Structure Determination by NMR. Proc. Natl. Acad. Sci. USA. 95, 5891 -5898. • Gardner, K. H. and Kay, L. E. (1998) The Use of 2 H, 13 C, 15 N Multidimensional NMR to Study the Structure and Dynamics of Proteins. Annu. Rev. Biophys. Biomol. Struct. 27, 357 -406. • Staunton, D. , Owen, J. and Campbell, I. D. (2003) NMR and Structural Genomics. Acc. Chem. Res. 36, 207 -214.
- Slides: 79