
STRUCTURAL FEA OF QUAI HEB 400 SUPPORT BEAMS

STRUCTURAL FEA OF QUAI HEB 400 SUPPORT BEAMS Miguel Lino Diogo dos Santos EDMS 1729183 EN-EA-EC
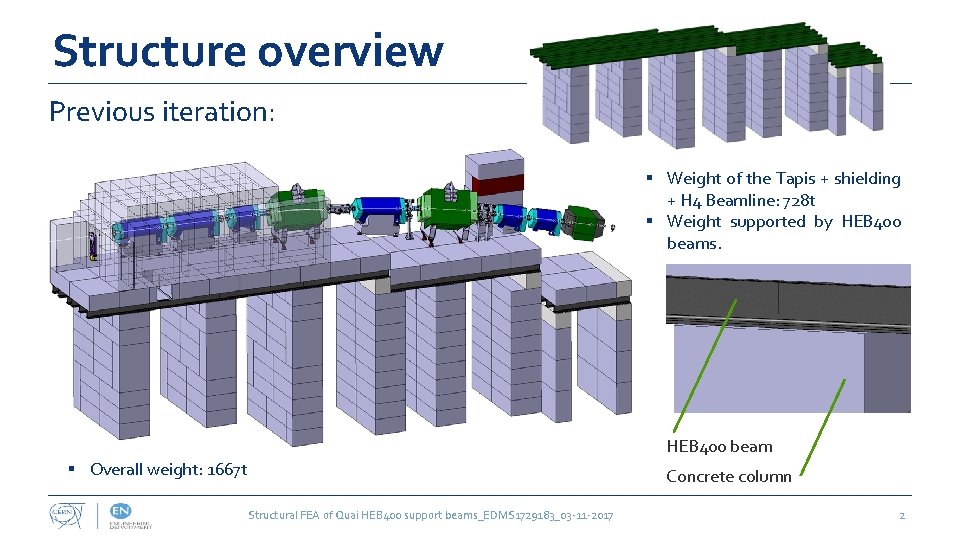
Structure overview Previous iteration: § Weight of the Tapis + shielding + H 4 Beamline: 728 t § Weight supported by HEB 400 beams. HEB 400 beam § Overall weight: 1667 t Concrete column Structural FEA of Quai HEB 400 support beams_EDMS 1729183_03 -11 -2017 2
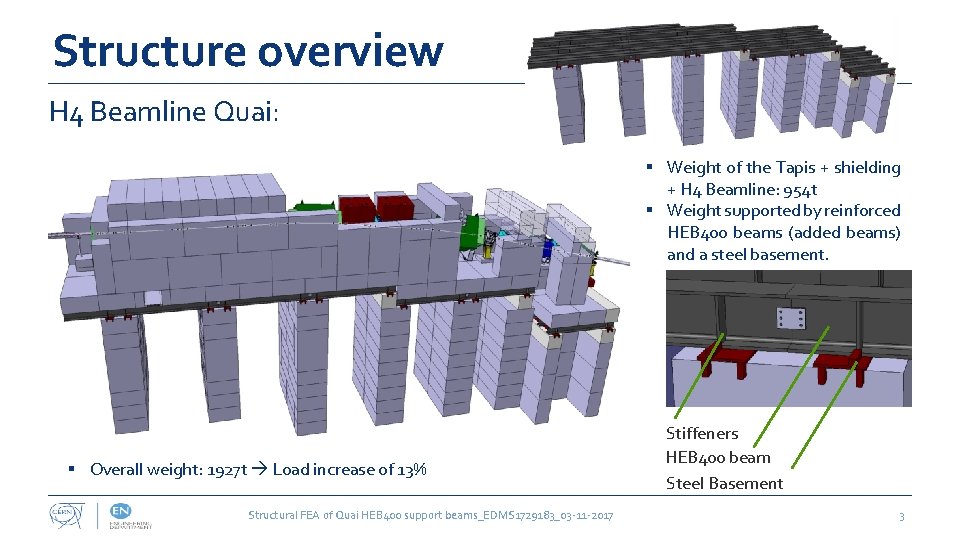
Structure overview H 4 Beamline Quai: § Weight of the Tapis + shielding + H 4 Beamline: 954 t § Weight supported by reinforced HEB 400 beams (added beams) and a steel basement. § Overall weight: 1927 t Load increase of 13% Structural FEA of Quai HEB 400 support beams_EDMS 1729183_03 -11 -2017 Stiffeners HEB 400 beam Steel Basement 3
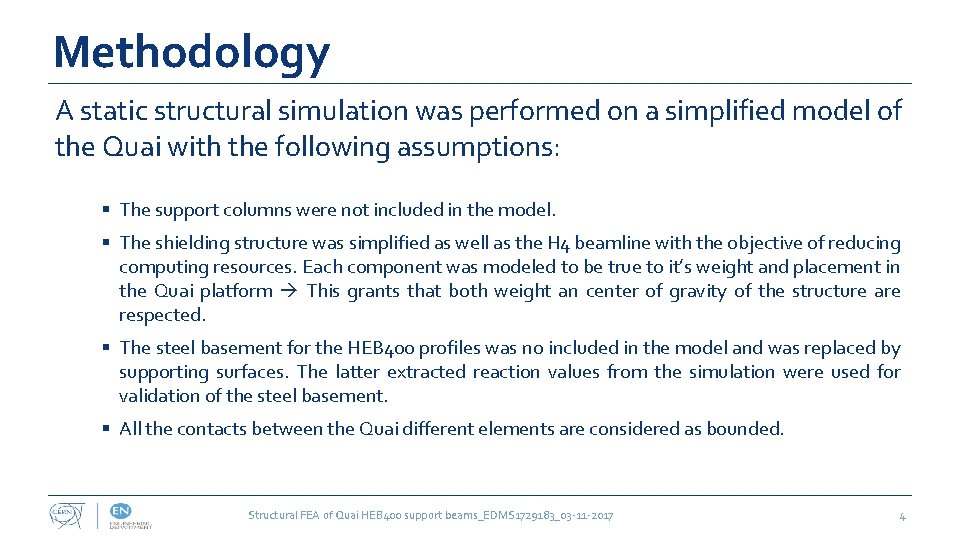
Methodology A static structural simulation was performed on a simplified model of the Quai with the following assumptions: § The support columns were not included in the model. § The shielding structure was simplified as well as the H 4 beamline with the objective of reducing computing resources. Each component was modeled to be true to it’s weight and placement in the Quai platform This grants that both weight an center of gravity of the structure are respected. § The steel basement for the HEB 400 profiles was no included in the model and was replaced by supporting surfaces. The latter extracted reaction values from the simulation were used for validation of the steel basement. § All the contacts between the Quai different elements are considered as bounded. Structural FEA of Quai HEB 400 support beams_EDMS 1729183_03 -11 -2017 4
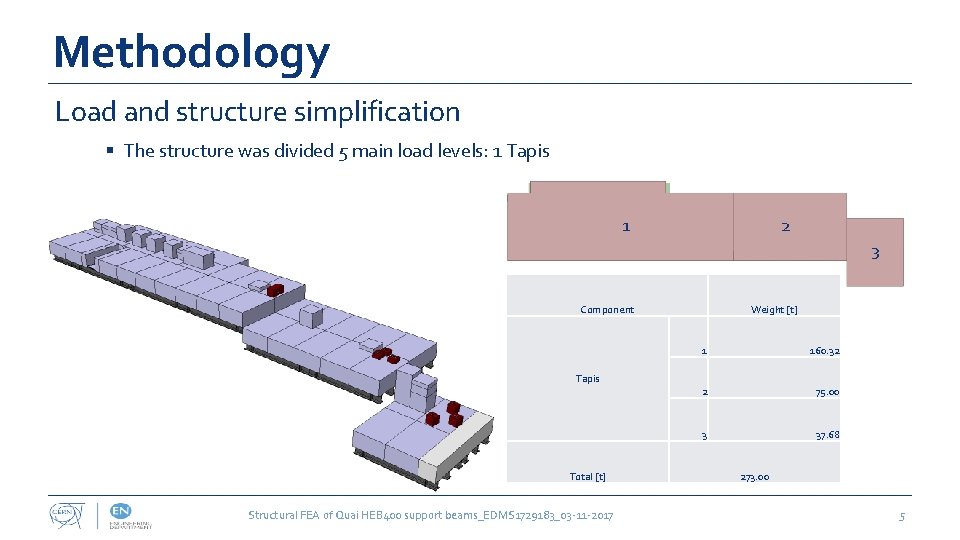
Methodology Load and structure simplification § The structure was divided 5 main load levels: 1 Tapis 1 2 3 Component Tapis Total [t] Structural FEA of Quai HEB 400 support beams_EDMS 1729183_03 -11 -2017 Weight [t] 1 160. 32 2 75. 00 3 37. 68 273. 00 5
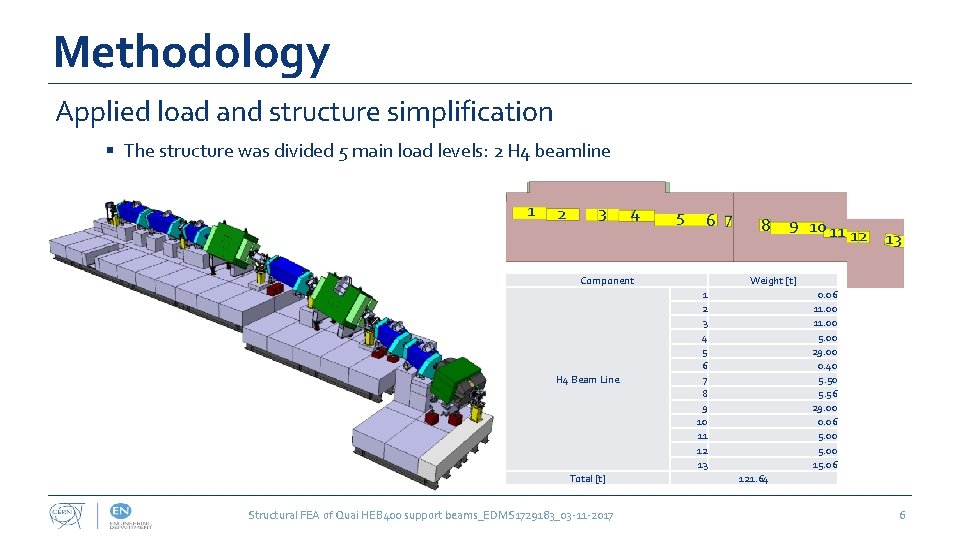
Methodology Applied load and structure simplification § The structure was divided 5 main load levels: 2 H 4 beamline 1 2 3 4 5 6 7 Component H 4 Beam Line Total [t] Structural FEA of Quai HEB 400 support beams_EDMS 1729183_03 -11 -2017 8 9 10 11 12 13 Weight [t] 1 2 3 4 5 6 7 8 9 10 11 12 13 0. 06 11. 00 5. 00 29. 00 0. 40 5. 56 29. 00 0. 06 5. 00 15. 06 121. 64 6
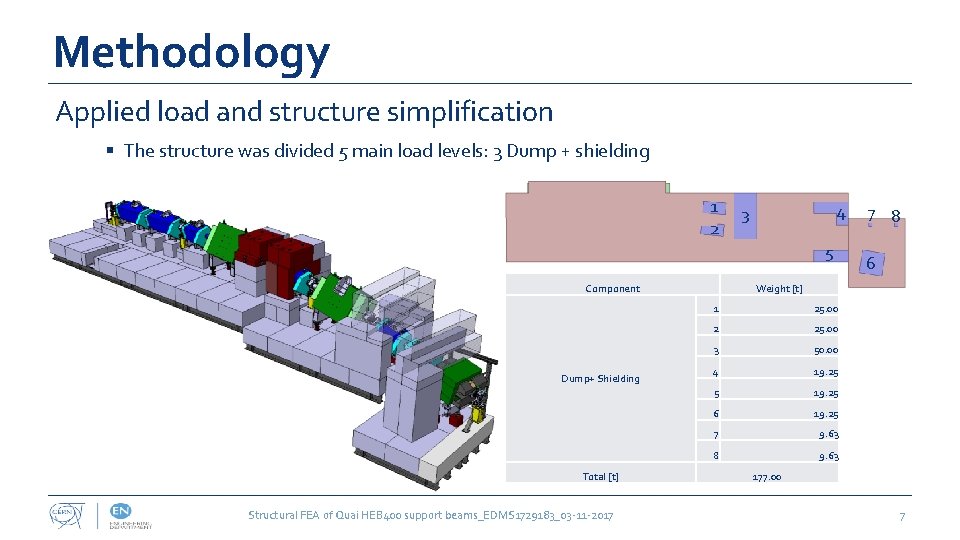
Methodology Applied load and structure simplification § The structure was divided 5 main load levels: 3 Dump + shielding 1 2 4 3 5 Component Dump+ Shielding Total [t] Structural FEA of Quai HEB 400 support beams_EDMS 1729183_03 -11 -2017 7 8 6 Weight [t] 1 25. 00 2 25. 00 3 50. 00 4 19. 25 5 19. 25 6 19. 25 7 9. 63 8 9. 63 177. 00 7
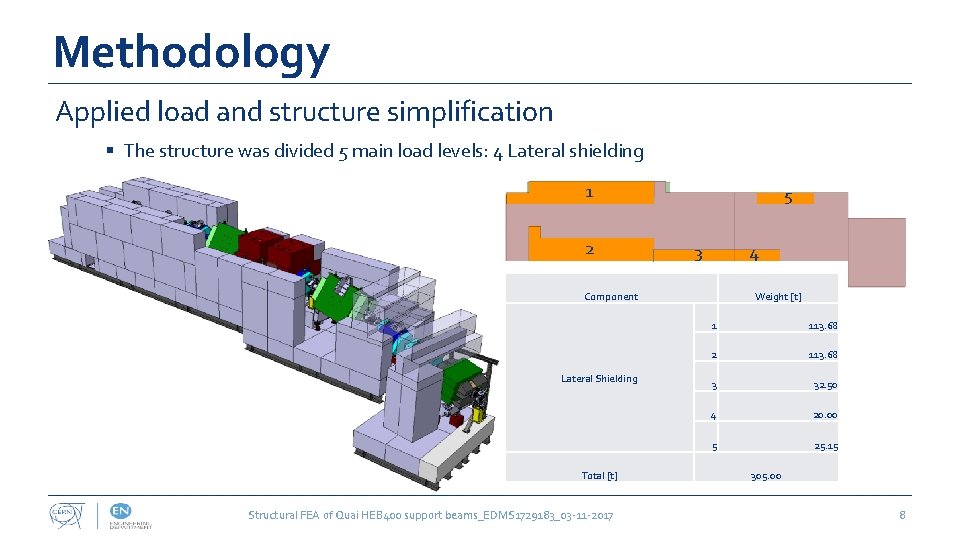
Methodology Applied load and structure simplification § The structure was divided 5 main load levels: 4 Lateral shielding 1 2 5 4 3 Component Lateral Shielding Total [t] Structural FEA of Quai HEB 400 support beams_EDMS 1729183_03 -11 -2017 Weight [t] 1 113. 68 2 113. 68 3 32. 50 4 20. 00 5 25. 15 305. 00 8
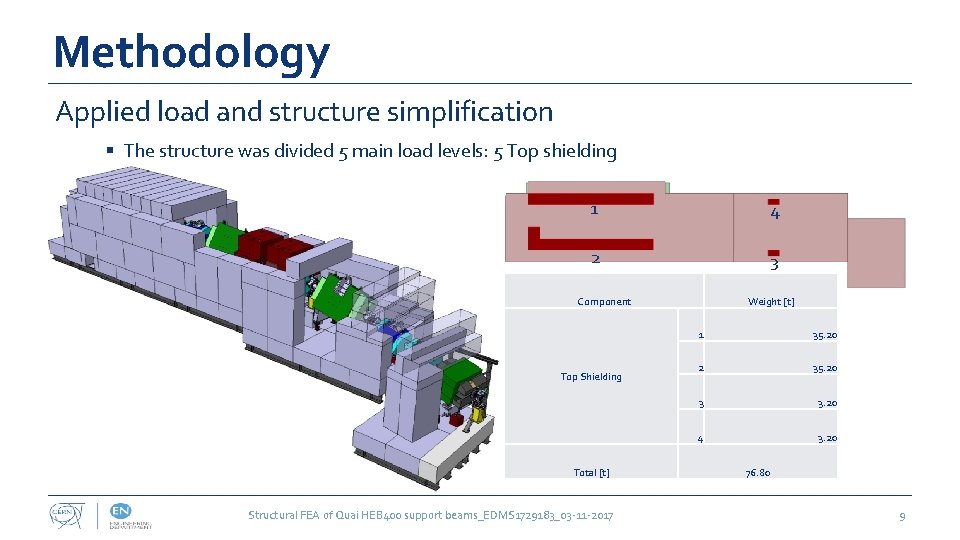
Methodology Applied load and structure simplification § The structure was divided 5 main load levels: 5 Top shielding 1 4 2 3 Component Top Shielding Total [t] Structural FEA of Quai HEB 400 support beams_EDMS 1729183_03 -11 -2017 Weight [t] 1 35. 20 2 35. 20 3 3. 20 4 3. 20 76. 80 9
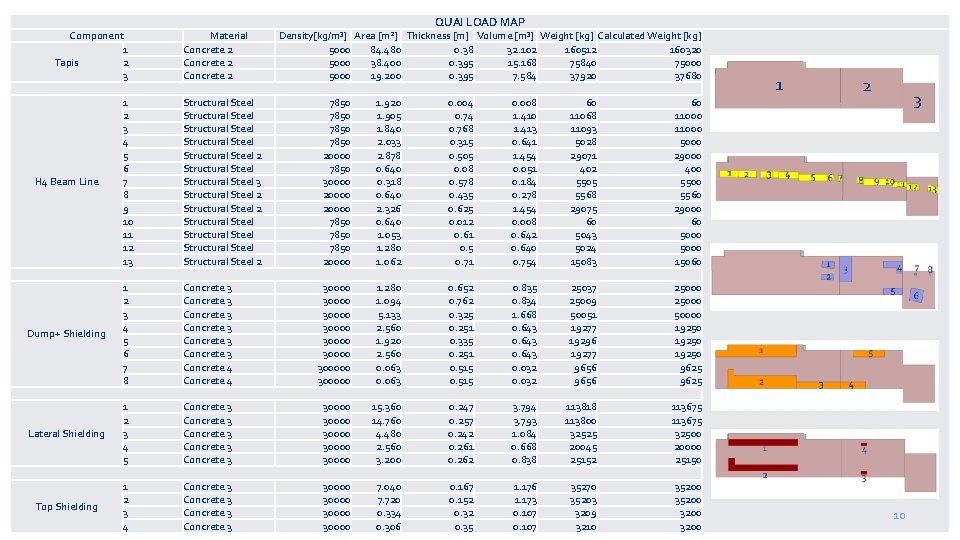
Component 1 Tapis 2 3 Material Concrete 2 QUAI LOAD MAP Density[kg/m³] Area [m²] Thickness [m] Volume [m³] Weight [kg] Calculated Weight [kg] 5000 84. 480 0. 38 32. 102 160512 160320 5000 38. 400 0. 395 15. 168 75840 75000 19. 200 0. 395 7. 584 37920 37680 7850 1. 920 0. 004 0. 008 60 60 7850 1. 905 0. 74 1. 410 11068 11000 7850 1. 840 0. 768 1. 413 11093 11000 7850 2. 033 0. 315 0. 641 5028 5000 20000 2. 878 0. 505 1. 454 29071 29000 7850 0. 640 0. 08 0. 051 402 400 30000 0. 318 0. 578 0. 184 5505 5500 20000 0. 640 0. 435 0. 278 5560 20000 2. 326 0. 625 1. 454 29075 29000 7850 0. 640 0. 012 0. 008 60 60 7850 1. 053 0. 61 0. 642 5043 5000 7850 1. 280 0. 5 0. 640 5024 5000 20000 1. 062 0. 71 0. 754 15083 15060 30000 1. 280 0. 652 0. 835 25037 25000 30000 1. 094 0. 762 0. 834 25009 25000 30000 5. 133 0. 325 1. 668 50051 50000 30000 2. 560 0. 251 0. 643 19277 19250 30000 1. 920 0. 335 0. 643 19296 19250 30000 2. 560 0. 251 0. 643 19277 19250 300000 0. 063 0. 515 0. 032 9656 9625 H 4 Beam Line 1 2 3 4 5 6 7 8 9 10 11 12 13 Structural Steel Structural Steel 2 Structural Steel 3 Structural Steel 2 Structural Steel 2 Dump+ Shielding 1 2 3 4 5 6 7 8 Concrete 3 Concrete 3 Concrete 4 Lateral Shielding 1 2 3 4 5 Concrete 3 Concrete 3 30000 30000 Top Shielding 1 2 3 4 Concrete 3 30000 15. 360 14. 760 4. 480 2. 560 3. 200 0. 247 0. 257 0. 242 0. 261 0. 262 3. 794 3. 793 1. 084 0. 668 0. 838 113818 113800 32525 20045 25152 113675 32500 20000 25150 7. 040 7. 720 0. 334 0. 306 0. 167 0. 152 0. 35 1. 176 1. 173 0. 107 35270 35203 3209 3210 35200 3200 1 2 3 10
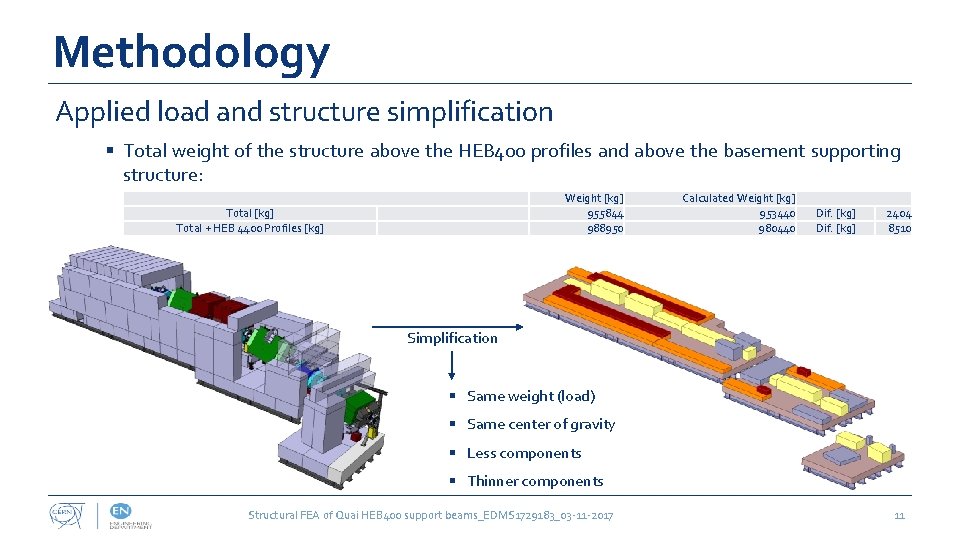
Methodology Applied load and structure simplification § Total weight of the structure above the HEB 400 profiles and above the basement supporting structure: Total [kg] Total + HEB 4400 Profiles [kg] Weight [kg] 955844 988950 Calculated Weight [kg] 953440 980440 Dif. [kg] 2404 8510 Simplification § Same weight (load) § Same center of gravity § Less components § Thinner components Structural FEA of Quai HEB 400 support beams_EDMS 1729183_03 -11 -2017 11
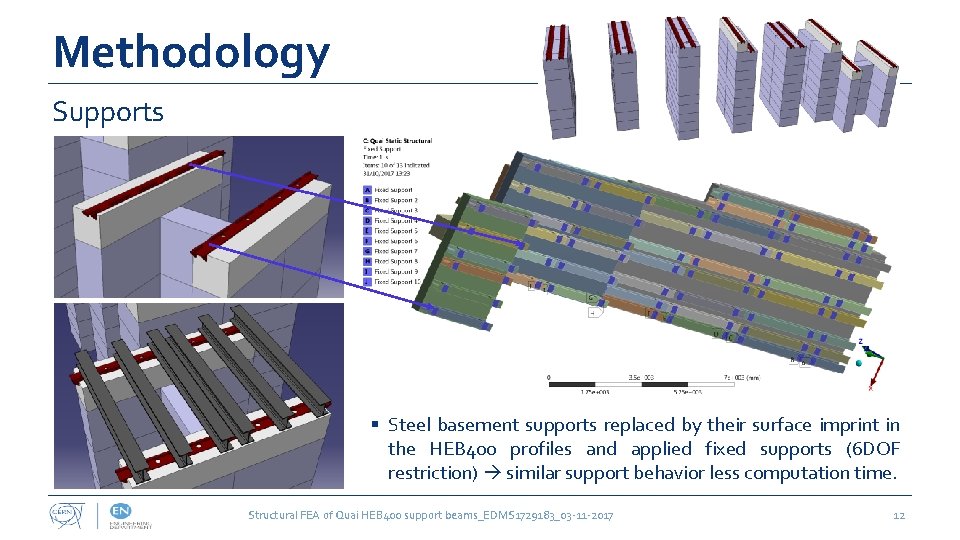
Methodology Supports § Steel basement supports replaced by their surface imprint in the HEB 400 profiles and applied fixed supports (6 DOF restriction) similar support behavior less computation time. Structural FEA of Quai HEB 400 support beams_EDMS 1729183_03 -11 -2017 12
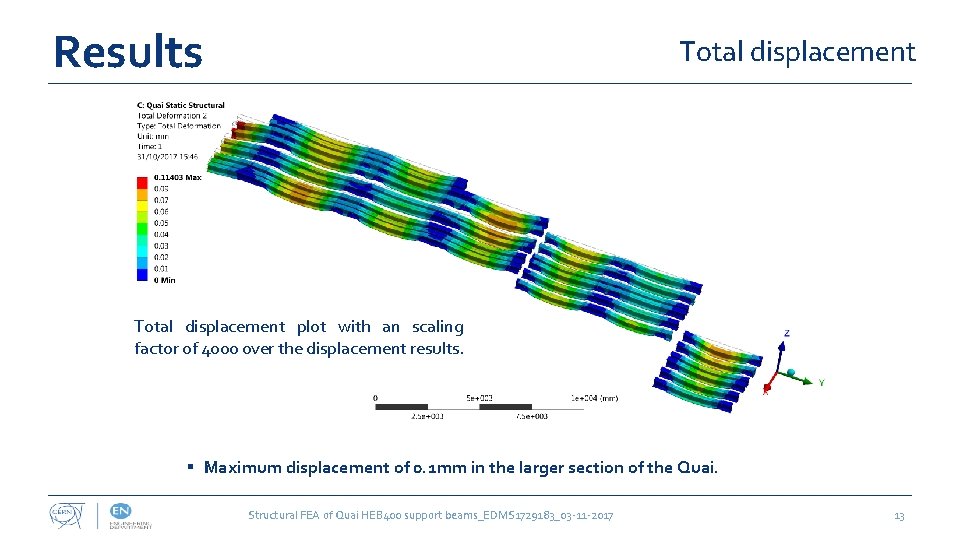
Results Total displacement plot with an scaling factor of 4000 over the displacement results. § Maximum displacement of 0. 1 mm in the larger section of the Quai. Structural FEA of Quai HEB 400 support beams_EDMS 1729183_03 -11 -2017 13
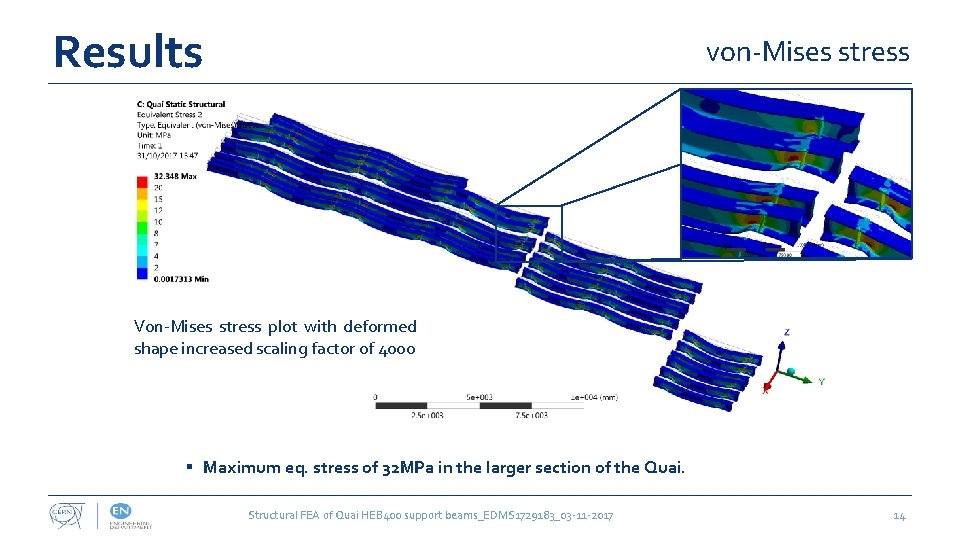
Results von-Mises stress Von-Mises stress plot with deformed shape increased scaling factor of 4000 § Maximum eq. stress of 32 MPa in the larger section of the Quai. Structural FEA of Quai HEB 400 support beams_EDMS 1729183_03 -11 -2017 14
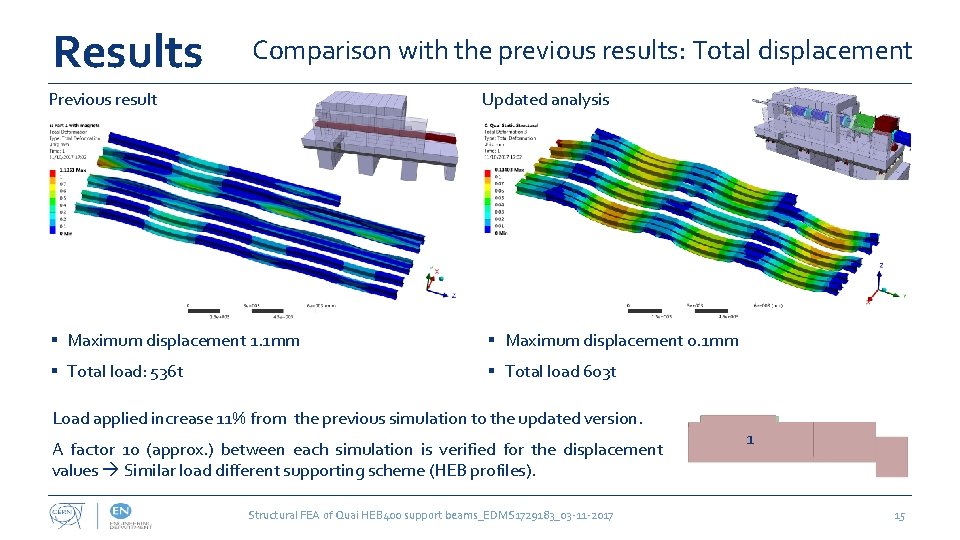
Results Comparison with the previous results: Total displacement Previous result Updated analysis § Maximum displacement 1. 1 mm § Maximum displacement 0. 1 mm § Total load: 536 t § Total load 603 t Load applied increase 11% from the previous simulation to the updated version. A factor 10 (approx. ) between each simulation is verified for the displacement values Similar load different supporting scheme (HEB profiles). Structural FEA of Quai HEB 400 support beams_EDMS 1729183_03 -11 -2017 1 15
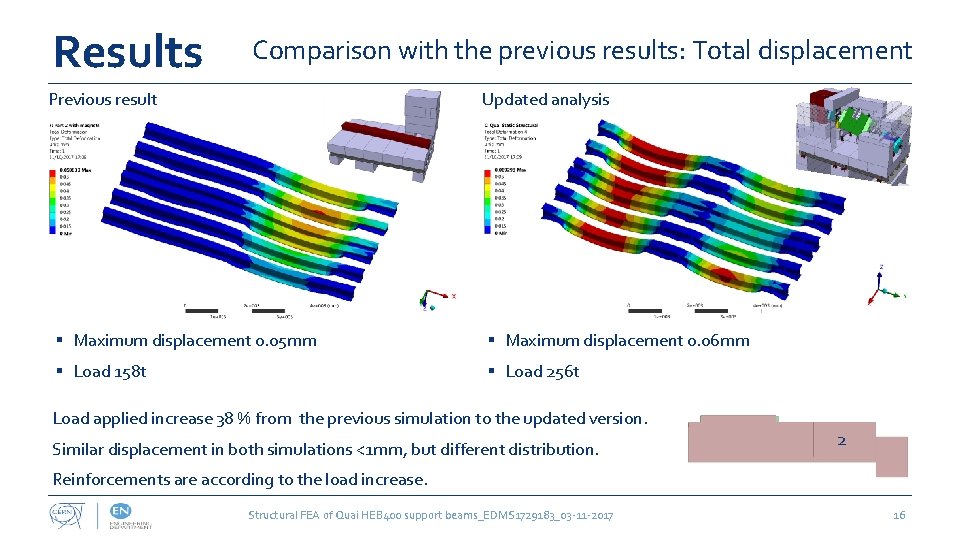
Results Comparison with the previous results: Total displacement Previous result Updated analysis § Maximum displacement 0. 05 mm § Maximum displacement 0. 06 mm § Load 158 t § Load 256 t Load applied increase 38 % from the previous simulation to the updated version. Similar displacement in both simulations <1 mm, but different distribution. 2 Reinforcements are according to the load increase. Structural FEA of Quai HEB 400 support beams_EDMS 1729183_03 -11 -2017 16
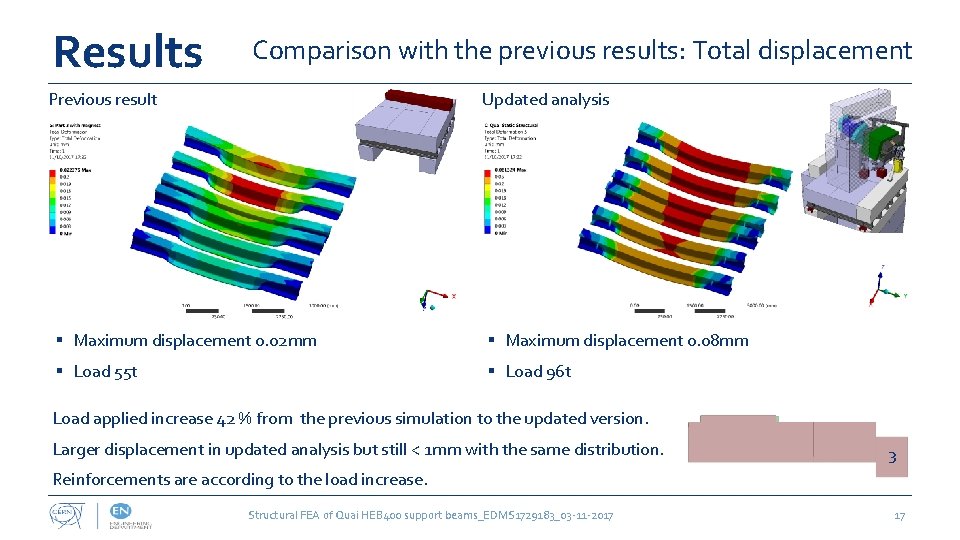
Results Comparison with the previous results: Total displacement Previous result Updated analysis § Maximum displacement 0. 02 mm § Maximum displacement 0. 08 mm § Load 55 t § Load 96 t Load applied increase 42 % from the previous simulation to the updated version. Larger displacement in updated analysis but still < 1 mm with the same distribution. 3 Reinforcements are according to the load increase. Structural FEA of Quai HEB 400 support beams_EDMS 1729183_03 -11 -2017 17
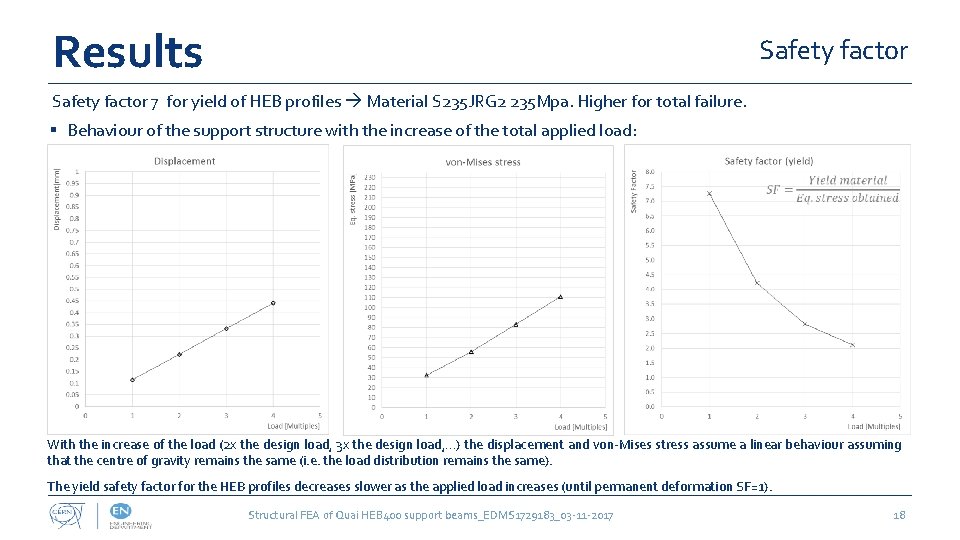
Results Safety factor 7 for yield of HEB profiles Material S 235 JRG 2 235 Mpa. Higher for total failure. § Behaviour of the support structure with the increase of the total applied load: With the increase of the load (2 x the design load, 3 x the design load, …) the displacement and von-Mises stress assume a linear behaviour assuming that the centre of gravity remains the same (i. e. the load distribution remains the same). The yield safety factor for the HEB profiles decreases slower as the applied load increases (until permanent deformation SF=1). Structural FEA of Quai HEB 400 support beams_EDMS 1729183_03 -11 -2017 18
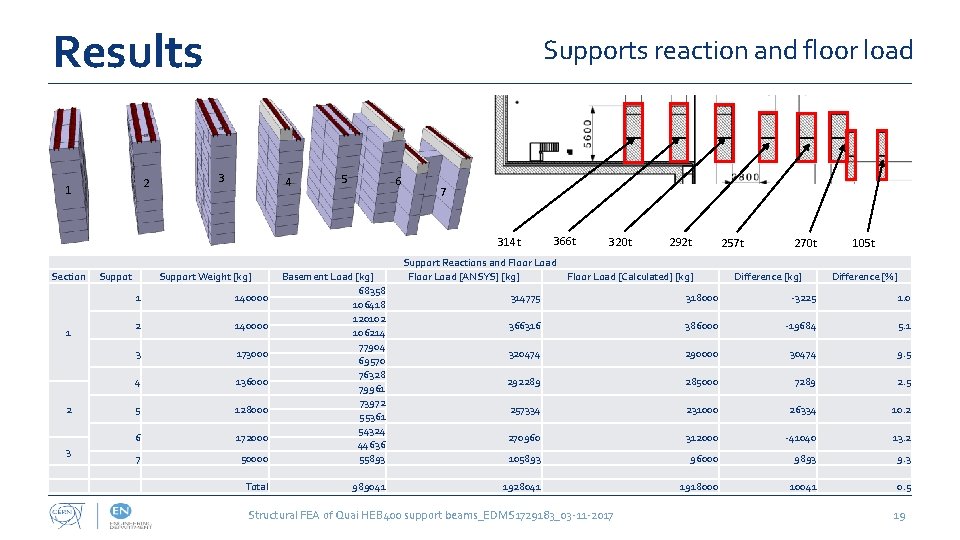
Results 2 1 Supports reaction and floor load 3 4 5 6 7 314 t Section 1 2 3 Suppot Support Weight [kg] 1 140000 2 140000 3 173000 4 136000 5 128000 6 172000 7 50000 Basement Load [kg] 68358 106418 120102 106214 77904 69570 76328 79961 73972 55361 54324 44636 55893 Total 989041 366 t 320 t 292 t Support Reactions and Floor Load [ANSYS] [kg] Floor Load [Calculated] [kg] 257 t 270 t Difference [kg] 105 t Difference [%] 314775 318000 -3225 1. 0 366316 386000 -19684 5. 1 320474 290000 30474 9. 5 292289 285000 7289 2. 5 257334 231000 26334 10. 2 270960 312000 -41040 13. 2 105893 96000 9893 9. 3 1928041 1918000 10041 0. 5 Structural FEA of Quai HEB 400 support beams_EDMS 1729183_03 -11 -2017 19
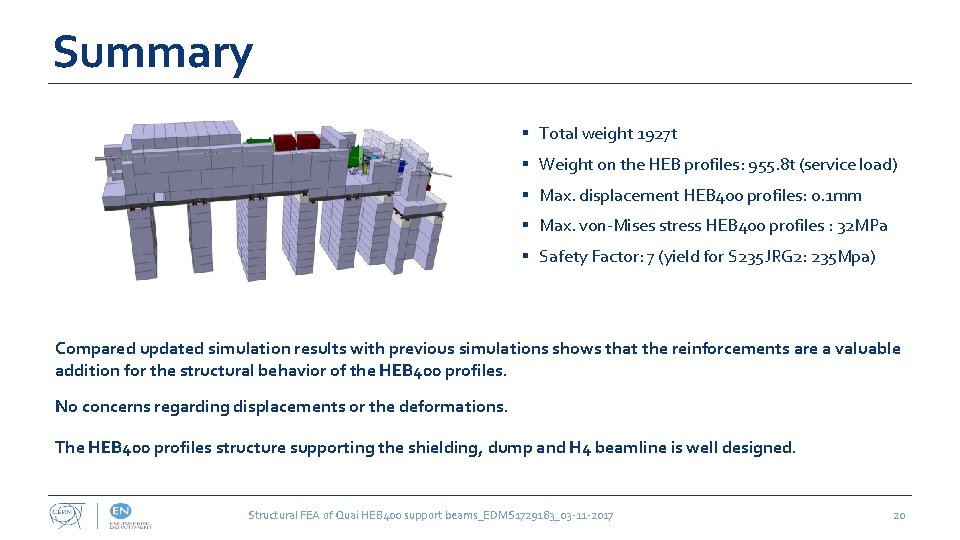
Summary § Total weight 1927 t § Weight on the HEB profiles: 955. 8 t (service load) § Max. displacement HEB 400 profiles: 0. 1 mm § Max. von-Mises stress HEB 400 profiles : 32 MPa § Safety Factor: 7 (yield for S 235 JRG 2: 235 Mpa) Compared updated simulation results with previous simulations shows that the reinforcements are a valuable addition for the structural behavior of the HEB 400 profiles. No concerns regarding displacements or the deformations. The HEB 400 profiles structure supporting the shielding, dump and H 4 beamline is well designed. Structural FEA of Quai HEB 400 support beams_EDMS 1729183_03 -11 -2017 20
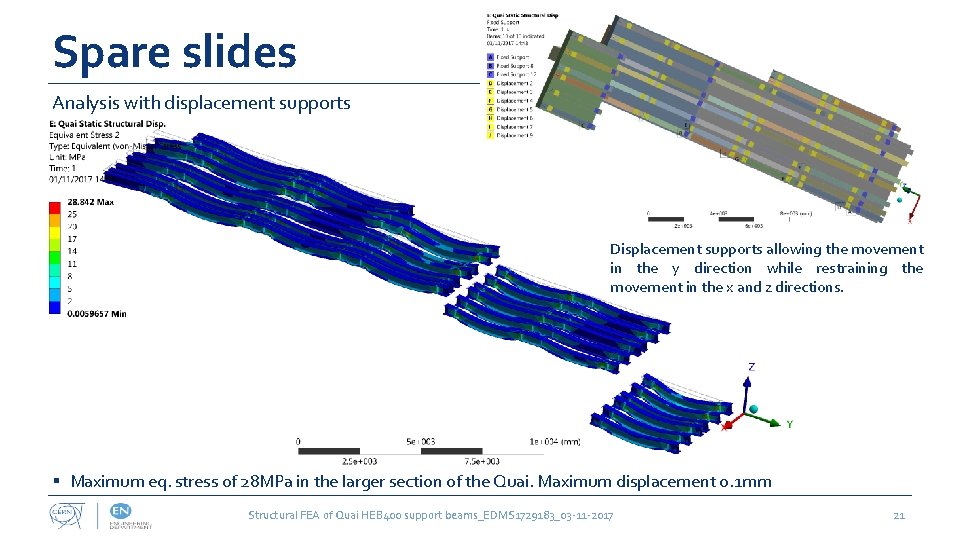
Spare slides Analysis with displacement supports Displacement supports allowing the movement in the y direction while restraining the movement in the x and z directions. § Maximum eq. stress of 28 MPa in the larger section of the Quai. Maximum displacement o. 1 mm Structural FEA of Quai HEB 400 support beams_EDMS 1729183_03 -11 -2017 21
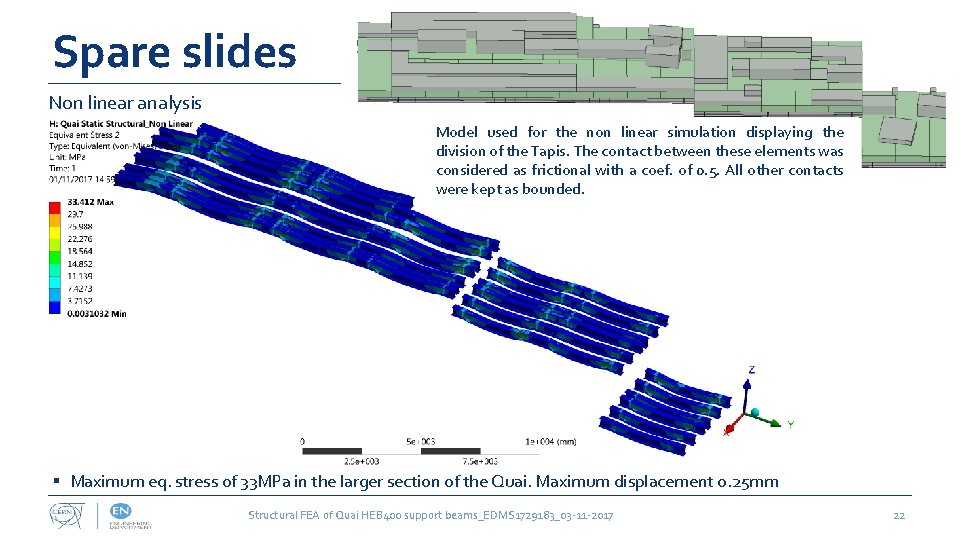
Spare slides Non linear analysis Model used for the non linear simulation displaying the division of the Tapis. The contact between these elements was considered as frictional with a coef. of 0. 5. All other contacts were kept as bounded. § Maximum eq. stress of 33 MPa in the larger section of the Quai. Maximum displacement o. 25 mm Structural FEA of Quai HEB 400 support beams_EDMS 1729183_03 -11 -2017 22
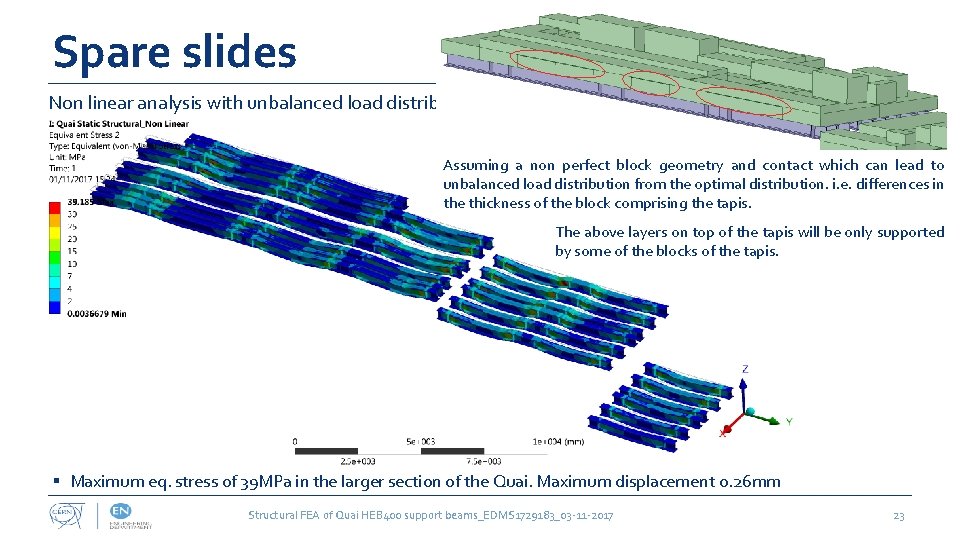
Spare slides Non linear analysis with unbalanced load distribution Assuming a non perfect block geometry and contact which can lead to unbalanced load distribution from the optimal distribution. i. e. differences in the thickness of the block comprising the tapis. The above layers on top of the tapis will be only supported by some of the blocks of the tapis. § Maximum eq. stress of 39 MPa in the larger section of the Quai. Maximum displacement o. 26 mm Structural FEA of Quai HEB 400 support beams_EDMS 1729183_03 -11 -2017 23
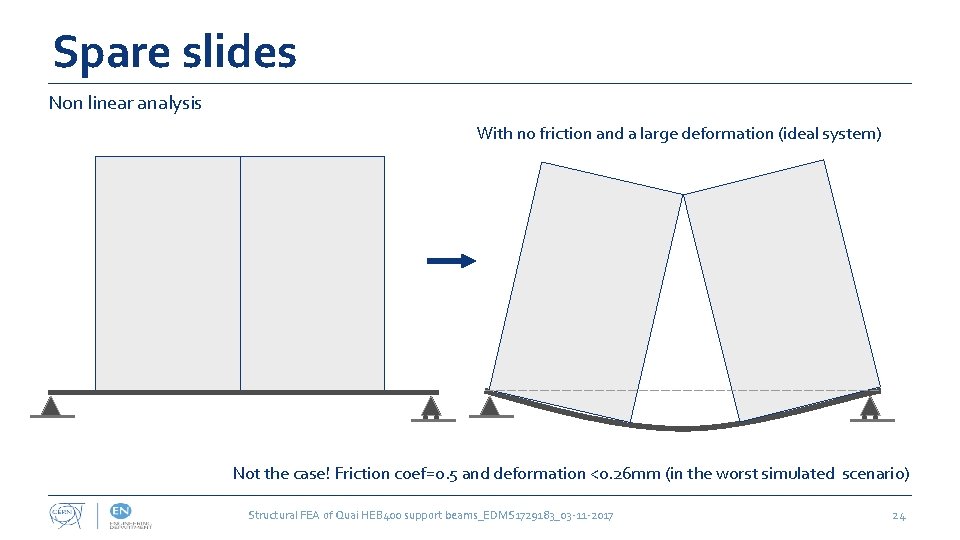
Spare slides Non linear analysis With no friction and a large deformation (ideal system) Not the case! Friction coef=0. 5 and deformation <0. 26 mm (in the worst simulated scenario) Structural FEA of Quai HEB 400 support beams_EDMS 1729183_03 -11 -2017 24
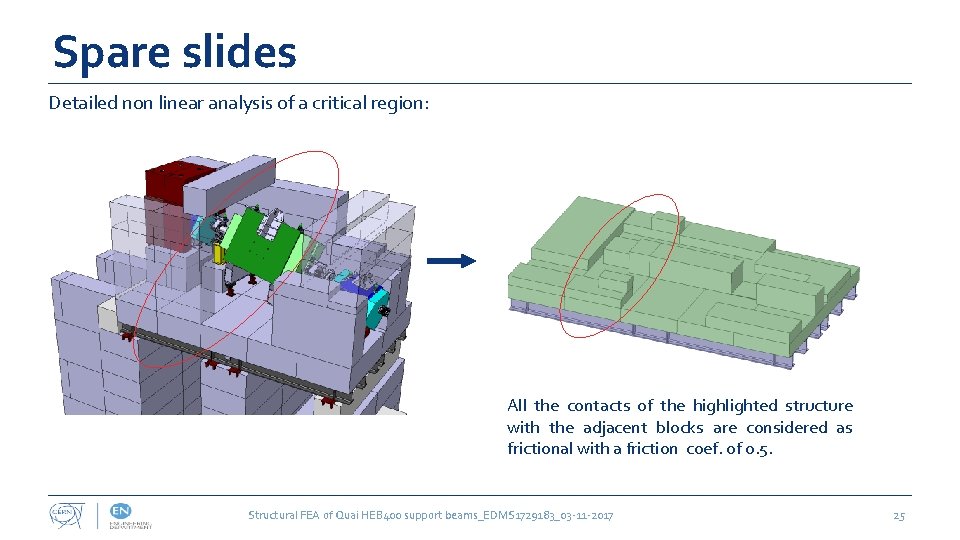
Spare slides Detailed non linear analysis of a critical region: All the contacts of the highlighted structure with the adjacent blocks are considered as frictional with a friction coef. of 0. 5. Structural FEA of Quai HEB 400 support beams_EDMS 1729183_03 -11 -2017 25
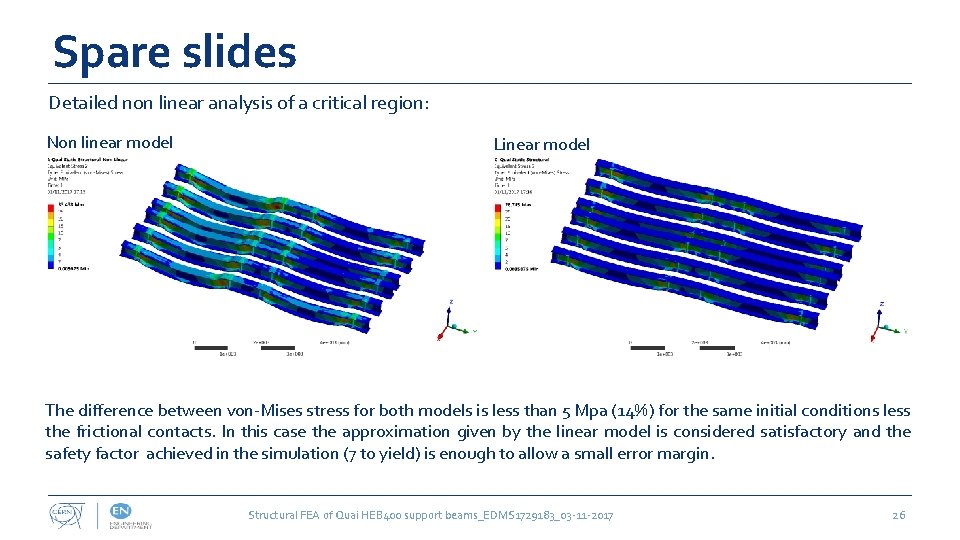
Spare slides Detailed non linear analysis of a critical region: Non linear model Linear model The difference between von-Mises stress for both models is less than 5 Mpa (14%) for the same initial conditions less the frictional contacts. In this case the approximation given by the linear model is considered satisfactory and the safety factor achieved in the simulation (7 to yield) is enough to allow a small error margin. Structural FEA of Quai HEB 400 support beams_EDMS 1729183_03 -11 -2017 26
- Slides: 26