Stress Testing Which Test to Choose Gary J

")


 GRADE (%) METS REST 00.")


")


 vs. Single Photon Emission Computed Tomography")


- Slides: 52
Stress Testing : Which Test to Choose? Gary J. Balady, MD Professor of Medicine Boston University School of Medicine
Stress Testing at Boston Medical Center • • • Exercise ECG ( treadmill test) Exercise – Echo Exercise – Nuclear Cardiopulmonary ( Metabolic ) Dobutamine –Echo Pharmacologic (regadenoson) nuclear – SPECT – PET • SCM Order Set: stress test selector
supply demand
supply coronary arteries • atherosclerosis • coronary vasospasm • hypoxemia • anemia • hypotension • coronary anomalies • coronary vasculitis demand factors • HR x BP • contractility • wall stress
Supply • Degree of obstruction • Length of lesion • Dynamic properties of distal vascular bed • thickness of myocardium
Supply Collateral flow
supply demand factors • HR x BP • contractility
History • Chest discomfort – Types of angina • Quality of discomfort/location • Provocative factors • Relief • Age/Gender/Risk Factors • Classes of Angina
Physical Examination • hypertension • weight/body habitus • vascular bruits • heart size • skin • eye grounds
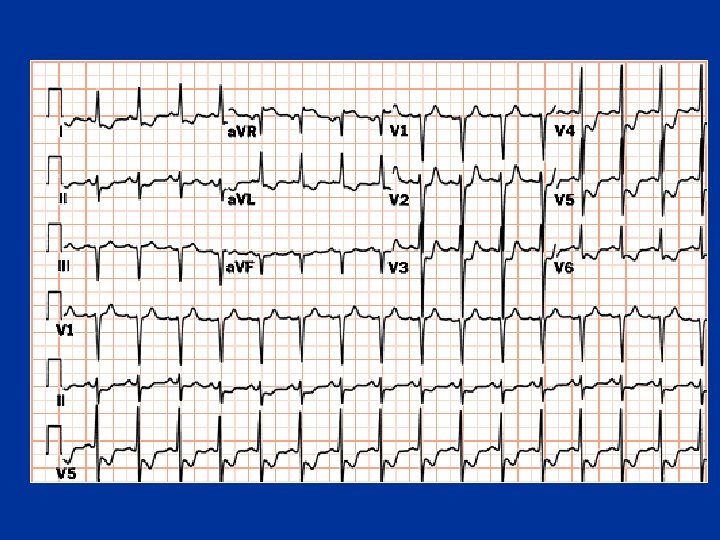
Resting Electrocardiogram
Exercise Testing Protocols
Work = force x distance Workrate = work/time VO 2 is directly related to workrate Treadmill • Force = body weight • Distance/time= Treadmill speed • Estimated VO 2 (ml/kg/min) – ACSM regression equations – METs Stationary Cycle • Force = resistance against the flywheel • Distance/time= Cycling speed • Estimated VO 2 (ml/min) – ACSM regression equations – Need body weight to calculate METs
METs Stepped METs Ramp Time 10 min
Bruce Protocol for Treadmill Testing STAGE TIME SPEED (mph) GRADE (%) METS REST 00. 00 0. 0 1 03. 00 1. 7 10. 0 4. 6 2 03. 00 2. 5 12. 0 7. 0 3 03. 00 3. 4 14. 0 10. 1 4 03. 00 4. 2 16. 0 12. 9 5 03. 00 5. 0 18. 0 15. 1 6 03. 00 5. 5 20. 0 16. 9 7 03. 00 6. 8 22. 0 19. 2
Boston Medical Center Ramp Protocols Stage* Very Low Ramp mph Low Ramp Moderate Ramp High Ramp Athlete’s Ramp % grade METs mph % grade METs 1 1. 0 0. 0 1. 8 1. 5 2. 1 3. 0 3. 5 1. 8 0. 0 2. 4 2 1. 1 0. 2 1. 9 1. 1 0. 5 1. 9 1. 6 2. 0 2. 7 2. 2 4. 0 3. 9 2. 1 0. 5 2. 7 3 1. 2 0. 4 2. 0 1. 2 1. 0 2. 1 1. 7 2. 5 2. 9 2. 3 4. 5 4. 2 2. 4 1. 0 3. 2 4 1. 3 0. 6 2. 1 1. 3 1. 5 2. 3 1. 8 3. 0 3. 1 2. 4 5. 5 4. 6 2. 7 1. 5 3. 6 5 1. 4 0. 8 2. 2 1. 4 2. 0 2. 5 1. 9 3. 5 3. 4 2. 5 6. 0 5. 0 3. 3 2. 0 4. 1 6 1. 5 1. 0 2. 3 1. 5 2. 7 2. 0 4. 0 3. 6 2. 6 7. 0 5. 5 3. 3 2. 5 4. 6 7 1. 6 1. 2 2. 5 1. 6 3. 0 2. 9 2. 1 4. 5 3. 9 2. 7 7. 5 5. 8 3. 6 3. 0 5. 2 8 1. 7 1. 4 2. 6 1. 7 3. 5 3. 1 2. 2 5. 0 4. 2 2. 8 8. 5 6. 4 3. 9 3. 5 6. 1 9 1. 8 1. 6 2. 8 1. 8 4. 0 3. 4 2. 3 5. 5 4. 5 2. 9 9. 0 6. 8 4. 2 4. 0 7. 3 10 1. 9 1. 8 2. 9 1. 9 4. 5 3. 6 2. 4 6. 0 4. 8 3. 0 10. 0 7. 4 4. 5 8. 4 11 2. 0 3. 1 2. 0 5. 0 3. 9 2. 5 6. 5 5. 1 3. 1 10. 5 7. 8 4. 8 5. 0 9. 5 12 2. 1 2. 2 3. 2 2. 1 5. 5 4. 2 2. 6 7. 0 5. 5 3. 2 11. 5 8. 5 5. 1 5. 5 10. 6 13 2. 2 2. 4 3. 4 2. 2 6. 0 4. 5 2. 7 7. 5 5. 8 3. 3 12. 0 8. 9 5. 4 6. 0 11. 5 14 2. 3 2. 6 3. 6 2. 3 6. 5 4. 8 2. 8 8. 0 6. 2 3. 4 13. 0 9. 7 5. 7 6. 5 12. 2 15 2. 4 2. 8 3. 8 2. 4 7. 0 5. 1 2. 9 8. 5 6. 6 3. 5 10. 1 6. 0 7. 0 13. 0 16 2. 5 3. 0 3. 9 2. 5 7. 5 5. 5 3. 0 9. 0 7. 0 3. 6 14. 5 10. 9 6. 3 7. 5 13. 8 17 2. 6 3. 2 4. 1 2. 6 8. 0 5. 8 3. 1 9. 5 7. 4 3. 7 15. 0 11. 4 6. 6 8. 0 14. 7 18 2. 7 3. 4 4. 3 2. 7 8. 5 6. 2 3. 2 10. 0 7. 8 3. 8 16. 0 12. 2 6. 9 8. 5 15. 5 19 2. 8 3. 6 4. 5 2. 8 9. 0 6. 6 3. 3 10. 5 8. 3 3. 9 16. 5 12. 6 7. 2 9. 0 16. 4 20 2. 9 3. 8 4. 7 2. 9 9. 5 7. 0 3. 4 11. 0 8. 7 4. 0 17. 5 13. 3 7. 5 9. 5 17. 3
Duke Activity Status Index
Diagnostic level of stress: 85% maximum predicted HR where MPHR = (220 -age)
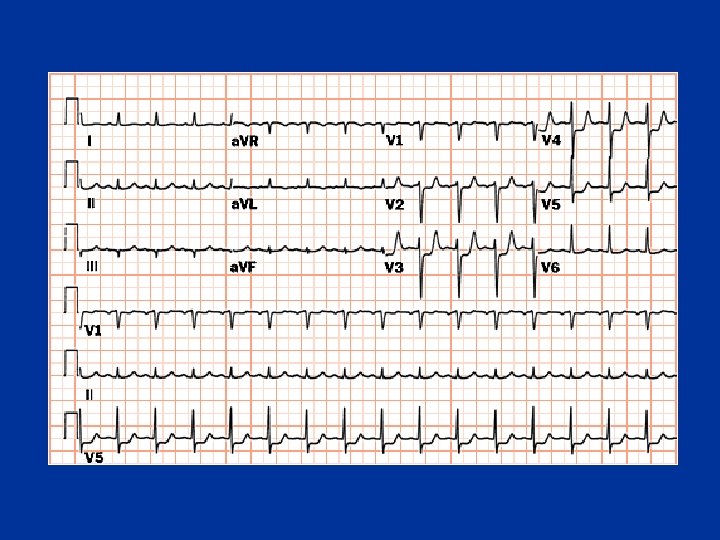
Normal Response Ischemic Response
Sensitivity/Specificity/Predictive Value high prevalence population 63 3 95 27 7 21 90 10 exercise ecg test: 70% sensitive/ 70% specific
Sensitivity/Specificity/Predictive Value low prevalence population 7 27 21 3 63 95 10 90 exercise ecg test: 70% sensitive/ 70% specific
Duke Prognostic Scoring System x x x * x
Heart Rate Recovery
Heart Rate Recovery: Risk of mortality at 6 years Cole, et al. NEJM 1999: 341: 1351
Cleveland Clinic ETT Score Lauer, et al. Ann Int Med 147: 821 -828; 2007
Hypertension During Exercise: BPs > 180 at 7 METs Circulation 2010: 121: 2109
Oxygen Uptake - Workrate relationship VO 2 No handrail ? Workrate Handrail
CPX System • • Oxygen sensor Carbon dioxide sensor Volume measures/flow meters Breath by breath measures – BTPS – Expired air • Oxygen uptake • Carbon Dioxide production • Ventilation
Indications for CPX • Accurate assessment of exercise capacity – Clinical – Research • Diagnosis – Dyspnea on exertion • Prognosis – Heart failure – Congenital Heart Disease • Disability assessment • Treatment – Pacemaker settings
Exercise Testing additional indications • Adequacy of therapy – medical – revascularization ( imaging tests) • Activity counseling – MET Chart • Exercise prescription • Rhythm assessment • Valvular Heart Disease – – Aortic stenosis Mitral regurgitation Hypertrophic obstructive cardiomyopathy
Exercise Prescription Patients with CHD • Intensity – Exercise Test • calculate heart rate reserve (HRR) – peak HR minus resting HR – moderate intensity: » 50% HRR plus resting HR to » 70% HRR plus resting HR » keep peak HR 10 beats < HR at ischemia – Risk Stratify using AHA criteria
Stress Imaging Tests • Abnormal resting ECG • ST segments • Left bundle branch block • LVH with strain • Need for increased diagnostic accuracy sensitivity 85 -90% specificity 85 -90% • localize ischemia to specific coronary vascular territory
Contrast Echo
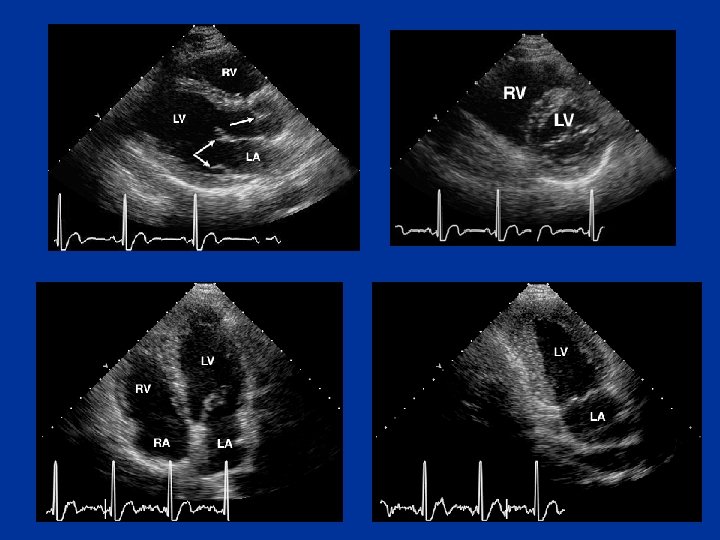
Stress Echocardiogram: Apical septal wall ischemia
Stress Nuclear Testing tomographic imaging planes Short Axis • base to apex Vertical Long Axis • septal to lateral Horizontal Long Axis • anterior to inferior
normal nuclear perfusion scan stress rest
lateral ischemia on nuclear perfusion scan stress rest
Pharmacological Stress Tests dobutamine echo Dobutamine • beta agonist • increases myocardial oxygen demand • increases HR, BP, contractility
Pharmacological Stress Tests nuclear perfusion scan Adenosine or Dipyridimole • direct coronary vasodilator • causes shifts in flow leading to relative reduction in flow distal to coronary stenosis • minimal change in HR, BP, and contractility
Myocardial Perfusion Imaging: Pharmacologic Positron Emission Tomography (PET) vs. Single Photon Emission Computed Tomography (SPECT) PET Energy: 511 Ke. V Resolution: 1. 5 cm Protocol: 45 min Stress EF Myocardial flow quantification • More expensive than SPECT • • • SPECT • • Energy: 80 -140 Ke. V Resolution: 2. 0 cm Protocol: 2 -3 h ( or 2 d) Post-Stress EF Courtesy of Edward Miller, MD, Ph. D
For more information • www. americanheart. org –Scientific publications • Statements and guidelines –Exercise standards -2013
Elective in Stress Testing • • Second and third year residents 3 weeks – preferably continuous Fellow surrogate Certification in Exercise-ECG Testing – Supervision and interpretation • Exposure to stress echo and stress nuclear
Approximate METs during Stationary Cycle Testing Body weight kg Lb Exercise rate (kg · min -1 and watts) Kpms 300 Watts 50 450 600 750 900 1050 1200 75 100 125 150 175 200 50 110 5. 1 6. 9 8. 6 10. 3 12. 0 13. 7 15. 4 60 132 4. 3 5. 7 7. 1 8. 6 10. 0 11. 4 12. 9 70 154 3. 7 4. 9 6. 1 7. 3 8. 6 9. 8 11. 0 80 176 3. 2 4. 3 5. 4 6. 4 7. 5 8. 6 90 198 2. 9 3. 8 4. 8 5. 7 6. 7 7. 6 8. 6 100 220 2. 6 3. 4 4. 3 5. 1 6. 0 6. 9 7. 7
Myocardial Contractility
Myocardial Wall Stress R P Th Wall stress = P x R/ Th