STRENGTHS AND WEAKNESSES OF EURUSSIA COOPERATION IN SCIENCE

 Beyond a strong common historical and cultural background,")
 The rough image of the Russian S&T system:")
 Maintaining strength in basic science, somewhat weaker in")
 Beyond the perception of those in direct contact")
 The following indicators are helpful in assessing the respective")
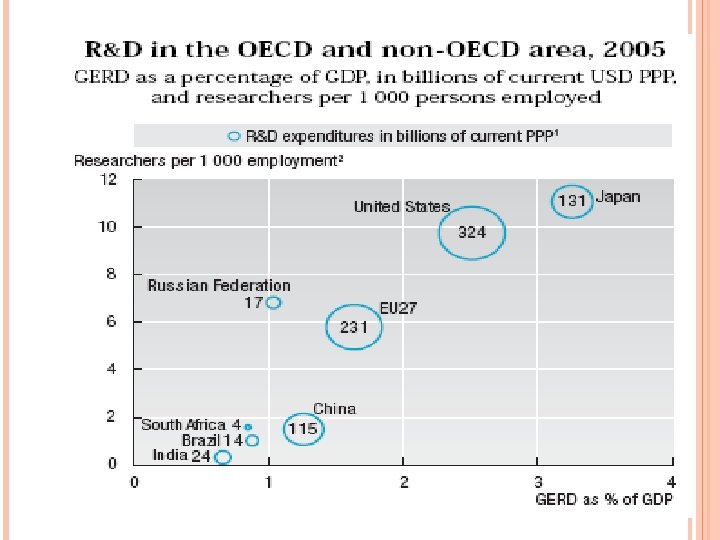
 Gross Expenditure on R&D (GERD) in Billions US$ (PPP")
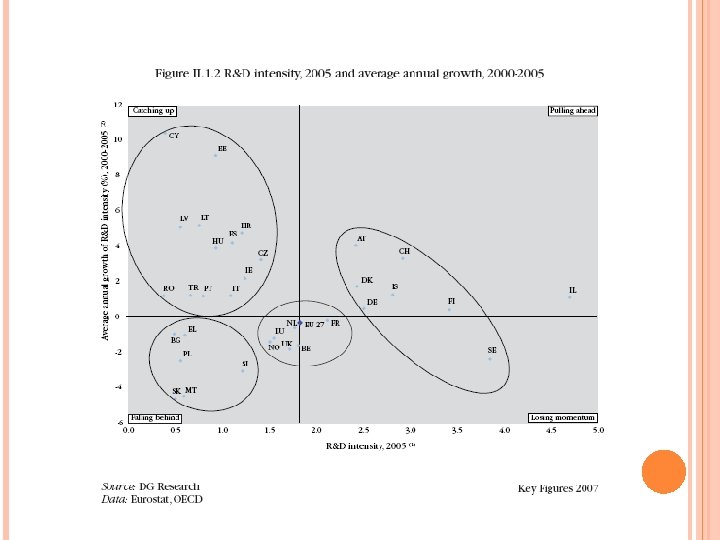
 R&D intensity, i. e. GERD as % of GDP:")
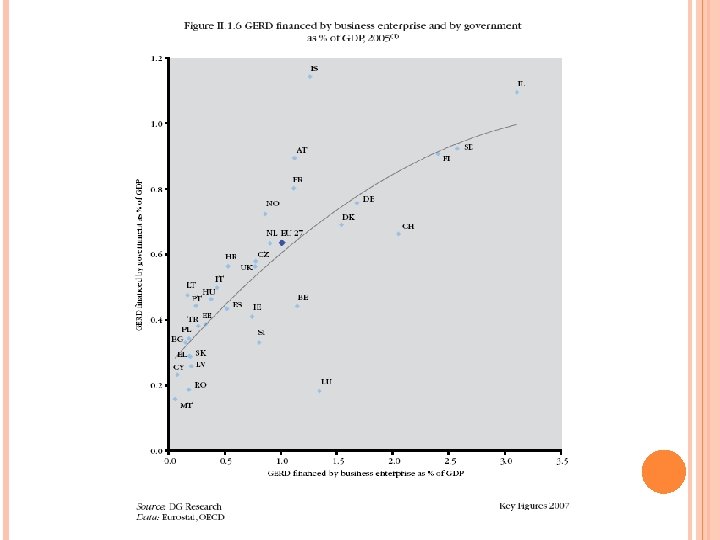
 In terms of source of funding and performing sector,")
 In terms of researchers in the total workforce: Russia")
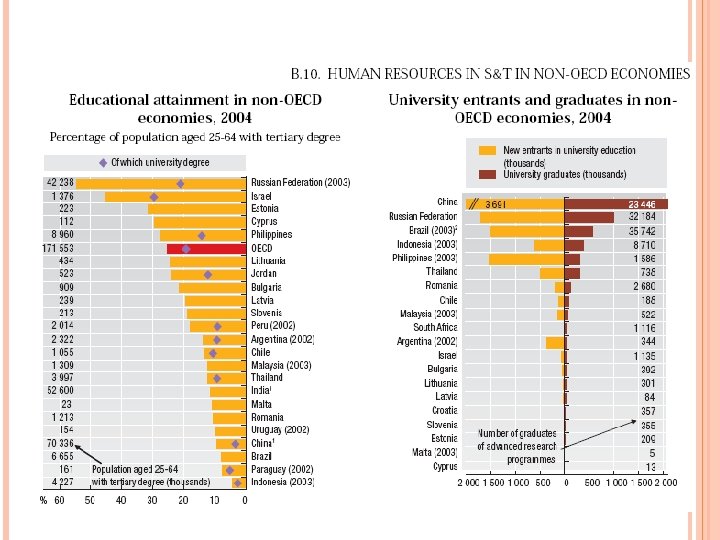
 In terms of strength of the tertiary education: Russia")
 In terms of output of any S&T system, patent")
 Russia and other CIS countries are strong in national applications as exemplified")
 Patent filings by residents per Million Dollars spent in R&D: world average")
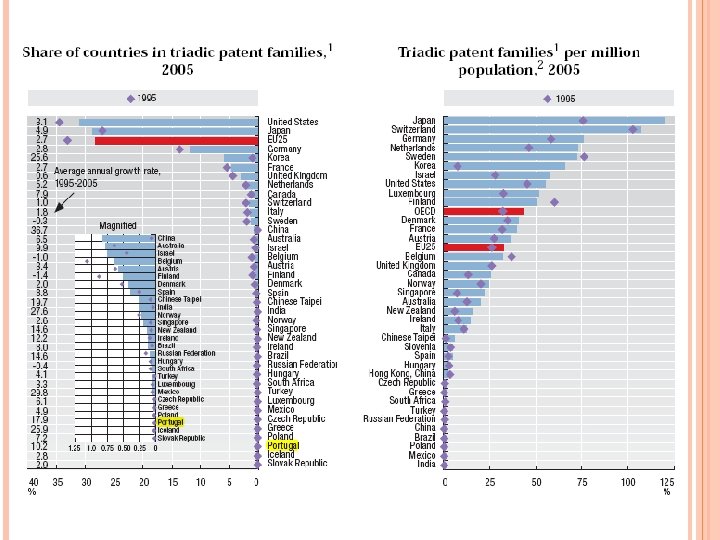
 BUT Weakness of Russia for registering international patents, notably the triadic patents,")
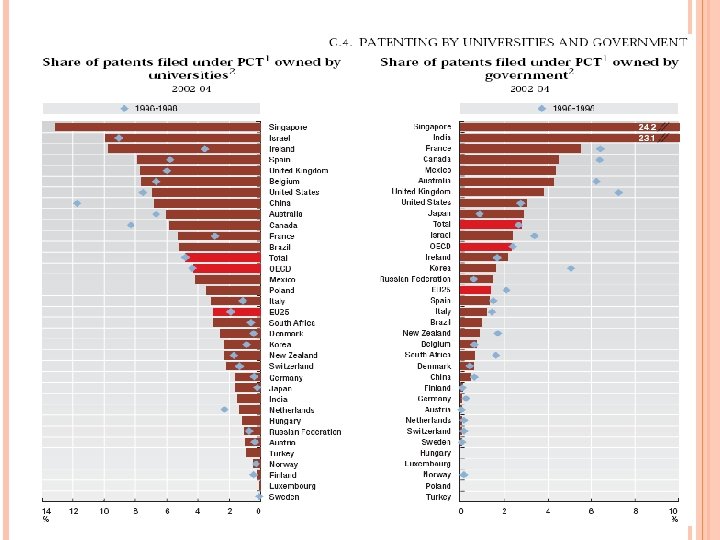
 In Russia, very few patents are owned by universities, less than 2%")
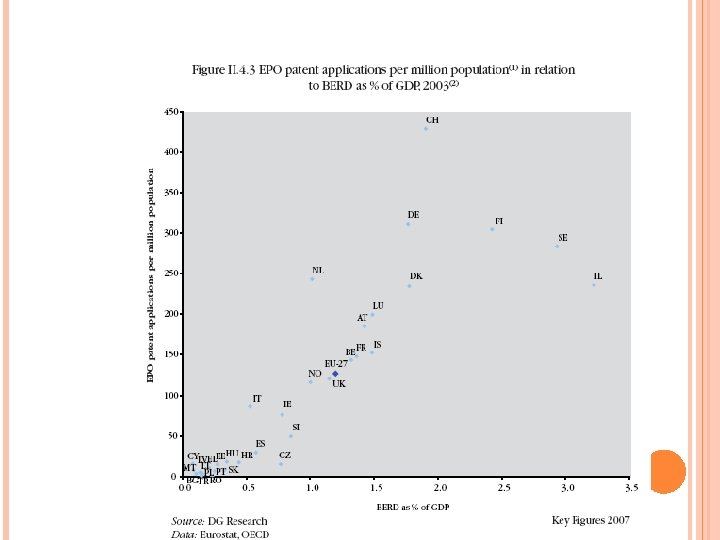
 What about Slovenia? As shown by the next graph, Slovenia is performing")


 The statistical data confirm the intuitive feeling about Russian")
 Technological niches: materials, nuclear technologies, biotechnologies, remembering that they")
 To facilitate cooperation, Russia should surmount some basic weaknesses")
 Discrepancies in Intellectual Property Rights policies Different project management")

- Slides: 34
STRENGTHS AND WEAKNESSES OF EURUSSIA COOPERATION IN SCIENCE & TECHNOLOGY J. P. CONTZEN ISTC-STCU International Conference Ljubljana, March 10 th, 2008
THE EUROPEAN UNION AND RUSSIA (1) Beyond a strong common historical and cultural background, does the rationale for international cooperation apply to the relations between the European Union and Russia? The answer requires a comparative analysis of the strengths and weaknesses of the respective S&T systems
THE EUROPEAN UNION AND RUSSIA (2) The rough image of the Russian S&T system: The heir to a superb scientific system yielding excellent technologies in a certain number of areas corresponding to the national priorities of the Soviet Union In phase of recovery from the catastrophic 90 s, has shown its resilience during these difficult years For decades, funded and demand-driven through governmental plans, notions of market and pricing still largely absent
THE EUROPEAN UNION AND RUSSIA (3) Maintaining strength in basic science, somewhat weaker in translation sciences, uneven technological level Universities still lagging in research Relatively modest Industry-funded (and -performed? ) S&T explaining weakness in industrial innovation, deepened through absence of a significant internal market Not fully integrated in the international networking Abundant human resources but what about the future generations?
THE EUROPEAN UNION AND RUSSIA (4) Beyond the perception of those in direct contact with the Russian system, what do the S&T indicators tell about this system? The very recent OECD Science, Technology and Industry Scoreboard 2007, the EC Science, Technology an Innovation Key Figures 2007 contain very useful information, complemented by other relevant data sources, e. g. the European Patent Office
SOME DATA ABOUT S&T (1) The following indicators are helpful in assessing the respective strengths of potential partners: Gross Expenditure on R&D (GERD) and R&D intensity, i. e. GERD as % of GDP R&D by source of funding and by performing sector Researchers in total workforce Strength of tertiary education
SOME DATA ABOUT S&T (2) Gross Expenditure on R&D (GERD) in Billions US$ (PPP 2005) and average annual growth 1995 -2005: EU 27 231 B$, + 3% OECD 772 B$, + 3. 5% Russian Fed. 16. 7 B$, + 6% Italy 17. 7 B$, + 2. 5% Slovenia 0. 55 B$, - 3% (2000 -2005), growing now
SOME DATA ABOUT S&T (3) R&D intensity, i. e. GERD as % of GDP: EU 27 1. 84 OECD 2. 2 Russian Fed. 1. 1 Italy 1. 1 Slovenia 1. 22 (1. 49 in 2005) In terms of GERD and R&D intensity, Russia is quite similar to Italy
SOME DATA ABOUT S&T (4) In terms of source of funding and performing sector, the Russian Federation is quite different from most EU countries and notably Slovenia: In Russia only 30% of GERD is financed by business enterprise vs. 60% in Slovenia (above EU 27 average of 54. 5%) In Russia, about 65% of the total R&D is performed according to OECD by business (careful about definition of business performers in the RF!) while in Slovenia this figure is about 60%
SOME DATA ABOUT S&T (6) In terms of researchers in the total workforce: Russia has to be considered as “overstaffed” according to world standards but the current attrition of the R&D workforce will bring it back to the general trend experienced elsewhere Slovenia with 6. 5 Researchers (FTE) per 1000 total employment for a R&D intensity of 1. 50 is in excess of the EU average and slightly above this general trend
SOME DATA ABOUT S&T (7) In terms of strength of the tertiary education: Russia leads with 55% of the total population aged 25 to 64 having a tertiary degree, well above the OECD average of 28% while Slovenia places itself at 18%
SOME DATA ABOUT S&T (8) In terms of output of any S&T system, patent filings constitute an important element The degree of internationalization can be measured by the flow of exchanged students, a condition for future S&T collaboration and by the internationalization of research projects
PATENTS (1) Russia and other CIS countries are strong in national applications as exemplified by following figures: Patent filings by residents per Billion Dollars GDP: world average 19, ranging from S. Korea 116. 2 - Japan 107. 3 - Germany 22. 6 – Georgia 21. 1 - USA 17. 7 - Russian Federation 17. 6 – Belarus 16. 9 - Ukraine 14. 7 – China 9. 4 - India 2. 3 – and Mexico 0. 6
PATENTS (2) Patent filings by residents per Million Dollars spent in R&D: world average 0. 81, ranging from S. Korea 4. 60 - Japan 3. 49 - Belarus 3. 15 - Russian Federation 1. 46 – Ukraine 1. 42 - Germany 0. 92 China 0. 78 - USA 0. 71 - India 0. 23 - Mexico 0. 14 – Belgium 0. 08 - Portugal 0. 07
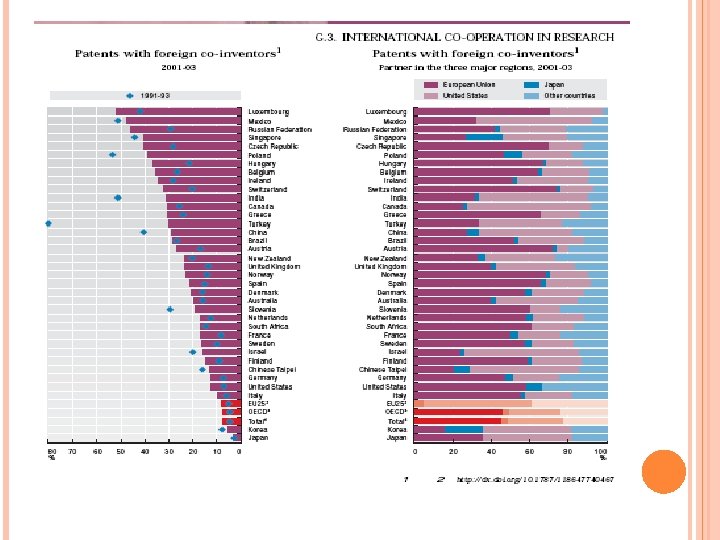
PATENTS (3) BUT Weakness of Russia for registering international patents, notably the triadic patents, about 5% of the total (EU 27 shares 28% of the total) These international patents are generally with foreign co-inventors and Russia has the highest share (64%) of foreign ownership of domestic inventions filed internationally
PATENTS (4) In Russia, very few patents are owned by universities, less than 2% to be opposed to nearly 10% in Ireland
PATENTS (5) What about Slovenia? As shown by the next graph, Slovenia is performing fairly well for EPO patent applications, not very far from the Irish performance
RUSSIA’S INTERNATIONALIZATION OF STUDENTS If Russian Universities are still attracting foreign students (3% of world total), the number of Russian students enrolled in Universities of OECD countries is quite low: less than 17, 000 from Russia over a total of 900, 000 in 2002; in comparison China sent 152, 000 students and India 82, 000 The flow increased significantly recently: about 50, 000 Russian students went abroad in 2007
RUSSIA AND THE EUROPEAN UNION The following diagram demonstrates the strength of Russia as foreign participant in the Framework Programme of the European Union, in this particular case FP 6
Comparison of foreign participations in FP 6
LESSONS FOR EU-RUSSIA COOPERATION (1) The statistical data confirm the intuitive feeling about Russian S&T strengths and weaknesses with question marks about the importance of business R&D and about the validity of patents as an indicator of the innovation potential Basically, cooperation could rely on the current strengths of Russia: Basic science Big science: Fusion, Space, High Energy Physics
LESSONS FOR EU-RUSSIA COOPERATION (2) Technological niches: materials, nuclear technologies, biotechnologies, remembering that they rely essentially on public financing and public execution Using a more refined approach, cooperation might be beneficial on emerging industrial products: the recent development of small and medium size enterprises in Russia could constitute a favorable factor in this respect
LESSONS FOR EU-RUSSIA COOPERATION (3) To facilitate cooperation, Russia should surmount some basic weaknesses linked to its too much inward looking approach. Such approach could be explained by several factors: Language Weak networking in the past Lack of active presence in international meetings Different approach to cooperation, notably reluctance to share financial burden
LESSONS FOR EU-RUSSIA COOPERATION (4) Discrepancies in Intellectual Property Rights policies Different project management styles Political obstacles such as visas, export control and information disclosure issue Differences in S&T structures Weak implication of industry Meager involvement of the younger
CONCLUSION In spite of these obstacles, Russia remains for the European Union an attractive partner for S&T cooperation. Real opportunities exist for creating win -win situations. Beyond a better mutual understanding based on enhanced personal contacts, what is mostly needed , is the manifestation of a clear political will, on both sides, for removing the most worrisome obstacles.