Strengths and Weakness of ADHDsymptoms and Normalbehavior SWAN
 Rating Scales for Assessment of ADHD")
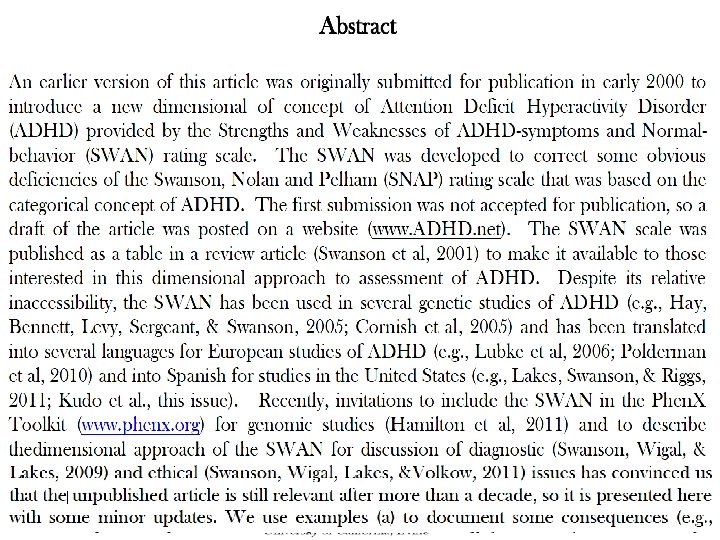
Strengths and Weakness of ADHDsymptoms and Normal-behavior (SWAN) Rating Scales for Assessment of ADHD James M Swanson, Ph. D Professor of Pediatrics, UC Irvine

SWAN Created for Population-Based Studies • 1980 Created the SNAP when DSM-III was released • 1994 Revised the SNAP for DSM-IV • 1999 Created the SWAN for population-based studies – – – DSM-III items for Attention Deficit Disorder (ADD) Swanson, Nolan and Pelham (SNAP) scale with 4 -point rating Developed norms during lectures to teachers (in groups) Used in clinical studies of medication for ADD (Swanson et al, 1983) DSM-IV items for Attention Deficit Hyperactivity Disorder (ADHD) Short-form with 18 ADHD items Long-form with 91 items for all psychiatric disorders of childhood Used for clinical assessment of at the UCI Child Development Center Florence Levy initiating the Australian Twin Study with David Hay Planned to use the SNAP rating scale Concerned about SNAP score distribution in a population study Most participants would not meet criteria for ADHD
: Severity of “symptom presence” on")
Typical Rating Scale Approach (e. g. , for SNAP): Severity of “symptom presence” on 4 -point scale Example Item: Often fails to give close attention to detail Not at All Just A Little Quite a Bit Very Much Increasing Symptom Severity 0 Not Present 1 2 Degree Present 3
 Rating Scale Often fails to give close attention to")
Swanson, Nolan, and Pelham (SNAP) Rating Scale Often fails to give close attention to detail 0 +1 +2 +3

The SWAN was derived from the SNAP N SWA Often fails to give close attention to detail -3 -2 -1 Compared to other children, how does & avoid Keep track of Ignore Remember Control movement of Sit still (control squirming) Stay seated in Modulate motor activity (inhibit running/climbing in Play Settle down and rest (control constant activity) Modulate verbal activity (control excess talking) Reflects on Enter without interruptiing) 0 +1 +2 +3

How does this child give close attention to detail? +3 +2 +1 0 -1 -2 -3

SNAP N = 847 mean = 0. 54 sd = 0. 67 skew = 1. 47 SWAN N = 656 mean = -0. 13 sd = 1. 46 skew = 0. 01 067 1 1 256 Above Average 2 345 344 Average 4523 5612 6701 Below Average
; Polderman")
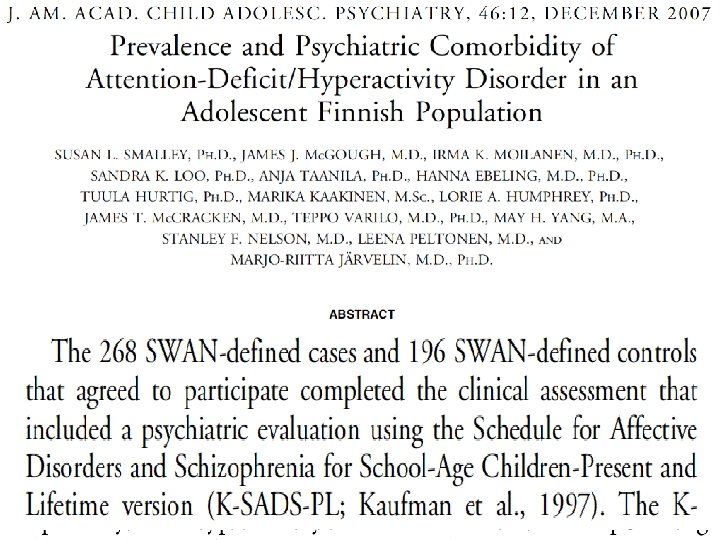
Example Studies Using the SWAN • Twin Studies – Hay et al (2007); Polderman et al (2007) – High DZ correlations for the SWAN (small contrast effect) • Prevalence and Norm Studies – Swanson et al (2001); Smalley et al (2007); Arnett et al (2012) – Shift in distribution (due to Lake Wobegon effect) • Brain Imaging Studies – Volkow et al (2009) – Correlation of DAT/DR 2 density from PET with the SWAN • Pharmacogentic Studies – Arcos-Burgos et al (2012) – Enhanced range of response to medication on the SWAN

Use of the SWAN in a Twin Study

Use of the SWAN in a Twin Study

95% Percentile Cutoff For Combined = 0. 278 Above Average Below Average

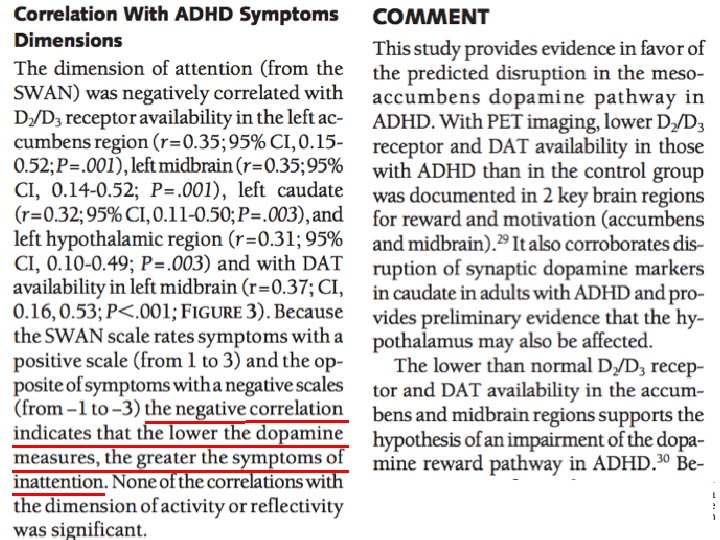
Use of the SWAN in a Brain Imaging Study

PET studies of the Site of Action of Methylphenidate in the Human Brain 11 C methylphenidate [11 C]methylphenidate Positron Emission Tomography (PET) studies show that methylphenidate acts predominantly in the striatum of the human brain where it binds to DA transporters
 MAO")
Dopamine- Deficit Hypothesis of ADHD/HKD (based on stimulant drug site- of- action hypothesis) MAO A DA DA DRD 2 DAT PET Measures 1. 2. DA Transporters DA D 2 Receptors DA transporters [11 C] MPH or Cocaine signal DA D 2 receptors [11 C] Raclopride

Use of the SWAN in a Genetic Study

Cluster Analysis Identified Subtypes of ADHD 9 Inattentive 9 Hyper/Imp Below Average Combined Type Inattentive Type Above Average Inattentive Hyper/Imp

SWAN Extends Range of Medication Response Below Average Placebo Inattentive Hyper/Imp Medication Inattentive Hyper/Imp Above Average

Association of LPHN 3 Haplotype and Extended Response to Medication on the SWAN

Other Examples of Use of the SWAN: Preschool Samples

Other Examples of Use of the SWAN: Genetic and Neuropsychology

Other Examples of Use of the SWAN: Subtypes and Symptom Domains

Other Examples of Use of the SWAN: Both Ends of the Continuum or Dimension

Summary • DSM-5 content is used to define items on the SWAN – the clinical wisdom of DSM is captured • Each symptom is dimensionalized on the SWAN – a 7 -point rating measures full range of behavior • Scores are normally distributed for the SWAN – Not skewed as typical 4 -point symptom-severity ratings • Some types of studies benefit by using the SWAN – Effects in genetics & brain imaging studies are enhanced
- Slides: 26