Street design survey and data collection 1 Pedestrian


 Mode Number of vehicles 5 m 1")
 Vehicle Adopted ECS Car Two wheeler Parking slot area (sq")


- Slides: 18
Street design survey and data collection
1. Pedestrian and Cyclist count • 30 minute surveys on each side of the road, during peak hr Gender Age On/Off footpath Cycle rickshaw Or Goods cycle
Presentation of pedestrian count - sample Pedestrian count by age group: 3 rd Cross Street, Kasturba Nagar 100 Pedestrian Count per hour 90 80 70 60 36 60 50 40 30 20 20 10 0 4 <=10 40 12 8 8 26 -33 34 -45 18 -25 8 46 -64 0 65+ ON FOOTPATH 8 4 <=10 18 -25 OFF FOOTPATH Female Male 28 26 -33 20 34 -45 12 8 4 46 -64 65+
Presentation of cyclist count – sample Cyclist count by gender: 3 rd Cross Street, Kasturba Nagar Kasthurbhai Nagar 3 rd Street 8 0 92 20 40 Female 60 Count Per Hour Male 80 100 120
2. Footpath obstruction survey • Mark points at intersections along the length of the road, • Walk between these points to count: • Permanent obstructions • Temporary obstructions • Parked vehicles
Continuous survey
Types of obstructions Drain covers Trees Dust bins, TNEB box Light pole, parking Road side shops Temporary Permanent
3. Land use analysis • Identify for all buildings in the study area: – Ground and upper floor land use – Number of floors – Type of activities in each building
Street vending locations
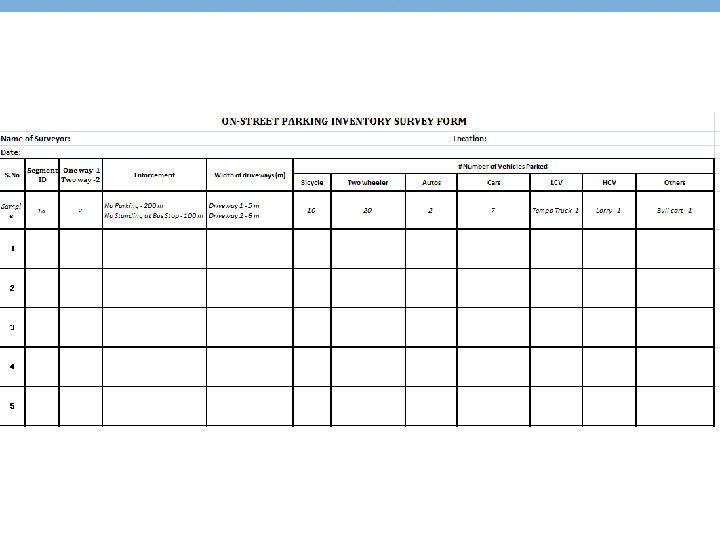
5. Parking survey • To identify parking patterns and occupancy rates • Survey should cover – Study Area streets + streets within a buffer of 500 m on both sides – Both on-street parking + off-street public or semipublic parking • Parking demand to be assessed and classified by vehicle type • Parking fee structure
Calculating parking requirement Equivalent car space (ECS) Mode Number of vehicles 5 m 1 Car 5 bikes 10 bicycles Nearly 2 auto-rickshaws
Equivalent car space (ECS) Vehicle Adopted ECS Car Two wheeler Parking slot area (sq m) 10 2 Cycle Auto-rickshaw Cycle rickshaw Bus HCV LCV Mini Bus 1 4. 5 2. 5 39 21. 6 10 21 0. 7 0. 5 3. 9 2. 2 1 1. 5 1. 0 0. 2
Calculating parking occupancy – Kasthurbhai Nagar 3 rd Street Calculations Road length 300 m Total length (2 sides of the road) 600 m 300 x 2 = 600 Total parking area 1200 sqm 600 m x 2 (car width) = 1200 Net parking area (available parking area) 840 sqm 70% x 1200 sqm = 840 Net capacity (Max no. of cars parked) 84 ECS 840 / 10 (1 car area) = 84 No. of parked vehicles (as per survey) 57. 4 ECS Area occupied by parked ECS 574 sqm 57. 4 ECS x 10 (1 car area) = 574 Occupancy 69% 574 sqm of parked ECS / 840 sqm of net parking area = 0. 69 Available parking space 226 sqm 22. 6 ECS 840 sqm – 574 sqm = 226 sqm = 22. 6 ECS
Calculating parking occupancy – 1 st Avenue Road, Indira Nagar Calculations Road length 300 m Total length (2 sides of the road) 600 m 300 x 2 = 600 Total parking area 1200 sqm 600 m x 2 (car width) = 1200 Net parking area (available parking area) 840 sqm 70% x 1200 sqm = 840 Net capacity (Max no. of cars parked) 84 ECS 840 / 10 (1 car area) = 84 No. of parked vehicles (as per survey) 24. 4 ECS Area occupied by parked ECS 244 sqm 24. 4 ECS x 10 (1 car area) = 244 Occupancy 29% 244 sqm of parked ECS / 840 sqm of net parking area = 0. 29 Available parking space 596 sqm 59. 6 ECS 840 sqm – 244 sqm = 226 sqm = 22. 6 ECS
Calculating parking occupancy – South Canal Road, Stretch 1 Calculations Road length 240 m Total length (2 sides of the road) 480 m 240 x 2 = 480 Total parking area 960 sqm 480 m x 2 (car width) = 960 Net parking area (available parking area) 672 sqm 70% x 960 sqm = 672 Net capacity (Max no. of cars parked) 67. 2 ECS 672 / 10 (1 car area) = 67. 2 No. of parked vehicles (as per survey) 49. 8 ECS Area occupied by parked ECS 498 sqm 49. 8 ECS x 10 (1 car area) = 498 Occupancy 74. 1% 498 sqm of parked ECS / 672 sqm of net parking area = 0. 741 Available parking space 174 sqm 17. 4 ECS 672 sqm – 498 sqm = 174 sqm = 17. 4 ECS
Calculating parking occupancy – South Canal Road, Stretch 2 Calculations Road length 300 m Total length (2 sides of the road) 600 m 300 x 2 = 600 Total parking area 1200 sqm 600 m x 2 (car width) = 1200 Net parking area (available parking area) 840 sqm 70% x 1200 sqm = 840 Net capacity (Max no. of cars parked) 84 ECS 840 / 10 (1 car area) = 84 No. of parked vehicles (as per survey) 74. 2 ECS Area occupied by parked ECS 742 sqm 74. 2 ECS x 10 (1 car area) = 742 Occupancy 88. 4% 742 sqm of parked ECS / 840 sqm of net parking area =. 884 Available parking space 98 sqm 9. 8 ECS 840 sqm – 742 sqm = 98 sqm = 9. 8 ECS
Parking occupancy Available parking spaces-726 ECS Occupied parking spaces-318 ECS