
Stream Flow Characteristics in Western Anatolia with Basin

Stream Flow Characteristics in Western Anatolia with Basin Physiographic Parameters Abdullah Cem Koc, Mesut Mese Denizli, TURKEY
Aim of the Study • Linear models for: – Instantaneous maximum discharge – Long term mean discharge Which are two flow characteristics using in the design stage of water buildings and water resources development planning studies
Aim of the Study • Stream gauging stations ensure data to obtain stream flow characteristics • Unfortunately every stream has no Stream Gauging Station (SGS) • Usually the area ratio with a nearby SGS is used to transfer the information • But area can not contain the whole characteristics of a watershed
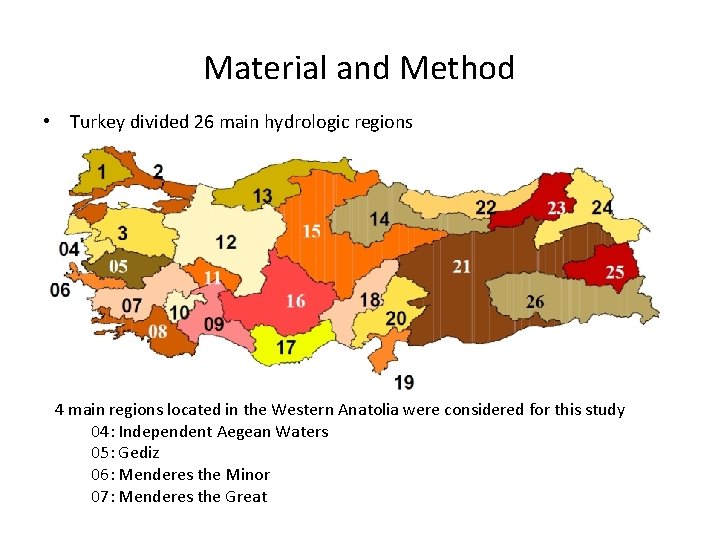
Material and Method • Turkey divided 26 main hydrologic regions 4 main regions located in the Western Anatolia were considered for this study 04: Independent Aegean Waters 05: Gediz 06: Menderes the Minor 07: Menderes the Great
SGS Selection Criteria • 47 operating or nonoperating SGS’s were selected for this study • Having data more than 20 years • Having area less than 2600 km 2 • American Watershed Management Units – Catchment (0. 05 -0. 5 mile 2 _ 0. 13 -1. 29 km 2) – Subwatershed (1 -10 miles 2 _ 2. 59 -25. 9 km 2) – Watershed (10 -100 miles 2 _ 25. 9 -259 km 2) – Subbasin (100 -1000 miles 2 _ 259 -2590 km 2) – Basin (1000 -10000 miles 2 _ 2590 -25900 km 2) – Subregion – Region
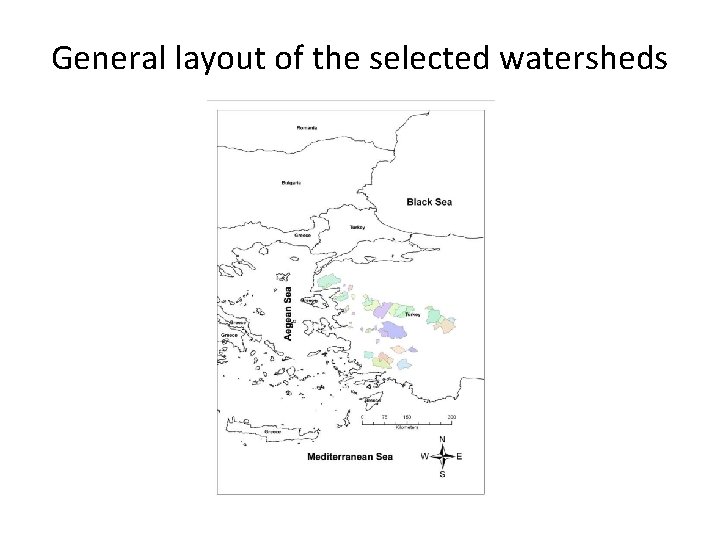
General layout of the selected watersheds
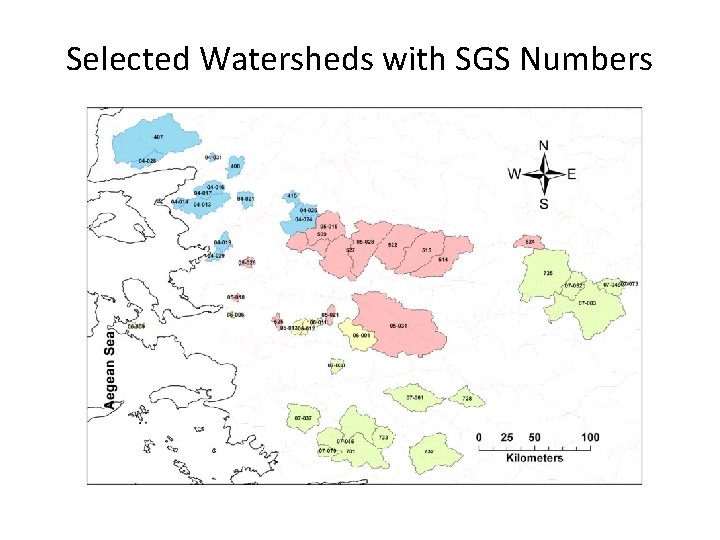
Selected Watersheds with SGS Numbers
Digital Elevation Model • ASTER : An earth observing sensor developed in Japan to be onboard the satellite "Terra" • The Ministry of Economy, Trade and Industry of Japan (METI) and the National Aeronautics and Space Administration (NASA) are collaborating on a project to develop ASTER Global Digital Elevation Model (ASTER GDEM) • www. gdem. aster. ersdac. or. jp • ASTER vs. SRTM (Shuttle Radar Topography Mission) • Posting interval : 1 arc-second (~30 x 30 meters at the Equator) • Tile Size : 3601 by 3601 pixels (1 by 1 degree)
Material and Method • Arc. GIS (www. esri. com) and DEM Surface Tools (www. jennessent. com) were used for delineating the watersheds and obtaining the physiographical parameters. • Geomorphological studies in regional scale are called as physiography. The physiographical analysis is exploring the physiographical parameters which are obtained from the region of interest in terms of magnitude and distribution.
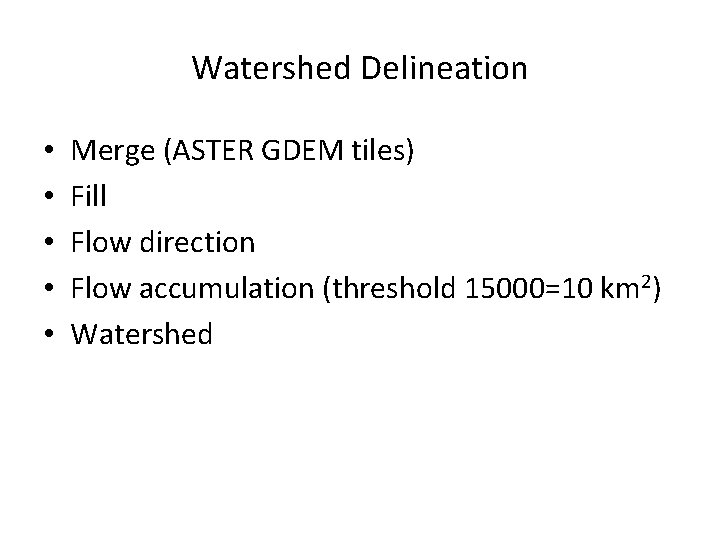
Watershed Delineation • • • Merge (ASTER GDEM tiles) Fill Flow direction Flow accumulation (threshold 15000=10 km 2) Watershed
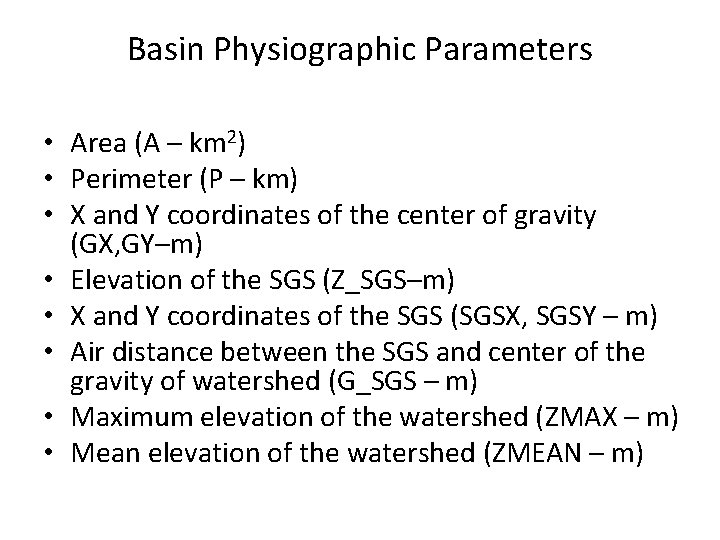
Basin Physiographic Parameters • Area (A – km 2) • Perimeter (P – km) • X and Y coordinates of the center of gravity (GX, GY–m) • Elevation of the SGS (Z_SGS–m) • X and Y coordinates of the SGS (SGSX, SGSY – m) • Air distance between the SGS and center of the gravity of watershed (G_SGS – m) • Maximum elevation of the watershed (ZMAX – m) • Mean elevation of the watershed (ZMEAN – m)
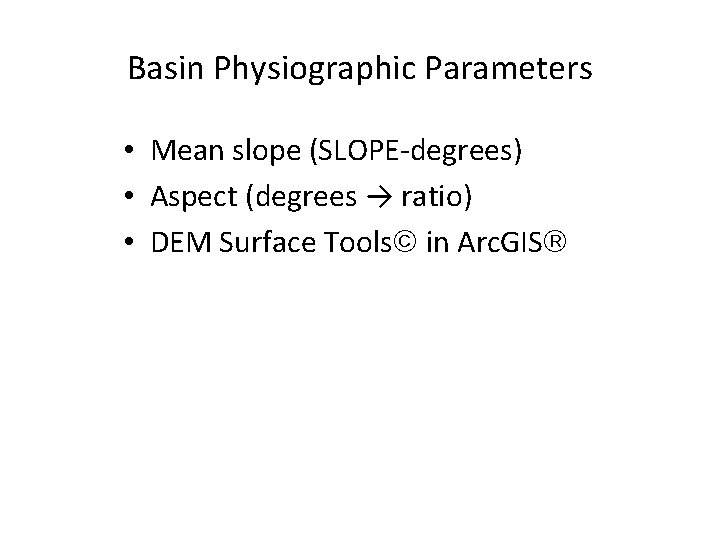
Basin Physiographic Parameters • Mean slope (SLOPE-degrees) • Aspect (degrees → ratio) • DEM Surface Tools in Arc. GIS

3 x 3 array model of raster cells East-West gradient (G) and North-South gradient (H) Horn’s method : Direction Flat Northeast East Southeast Southwest West Northwest Degrees -1 338 – 22 23 – 67 68 – 112 113 – 157 158 – 202 203 – 247 248 – 292 293 – 337 Abbreviation AS_FLAT AS_NE AS_SE AS_SW AS_NW • If Direction > 90° then Aspect = (450 – Direction) • Otherwise Aspect = (90 – Direction)

Basin Physiographic Parameters • • • Elevation-relief ratio (E) ~ Hypsometric integral Strahler order (STR) – Without threshold Shreve magnitude (SHR) - Without threshold Main stream length (L_MAIN – km) Air distance of the longest path (L_DIST – km) Sinusoity (SIN) The ratio of L_MAIN and L_DIST
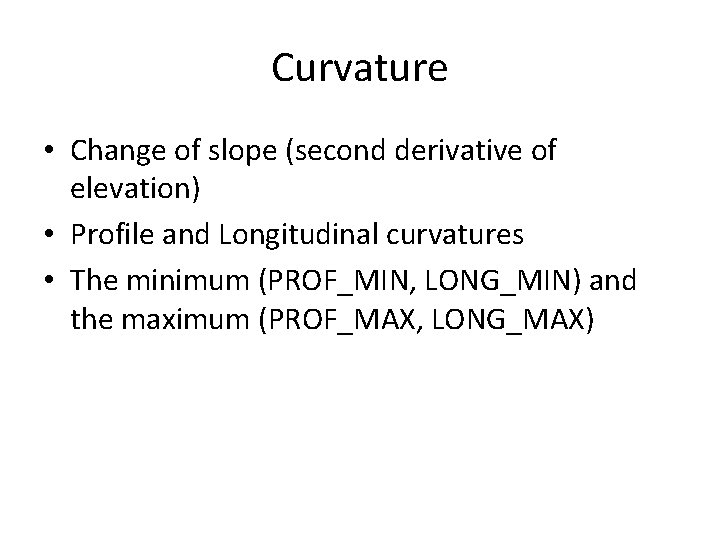
Curvature • Change of slope (second derivative of elevation) • Profile and Longitudinal curvatures • The minimum (PROF_MIN, LONG_MIN) and the maximum (PROF_MAX, LONG_MAX)
Regression Analysis • Multiple linear backward stepwise regression • All variables were considered in the beginning. The independent variable that contributes the least to the prediction is removed from the equation by using the F test.
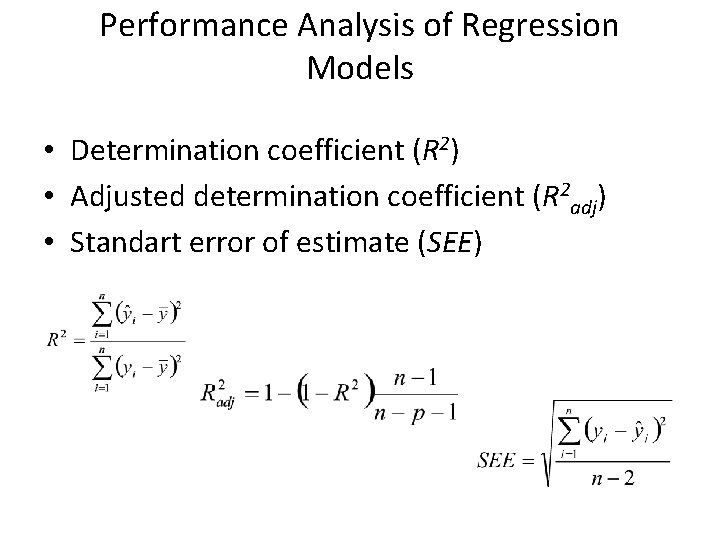
Performance Analysis of Regression Models • Determination coefficient (R 2) • Adjusted determination coefficient (R 2 adj) • Standart error of estimate (SEE)
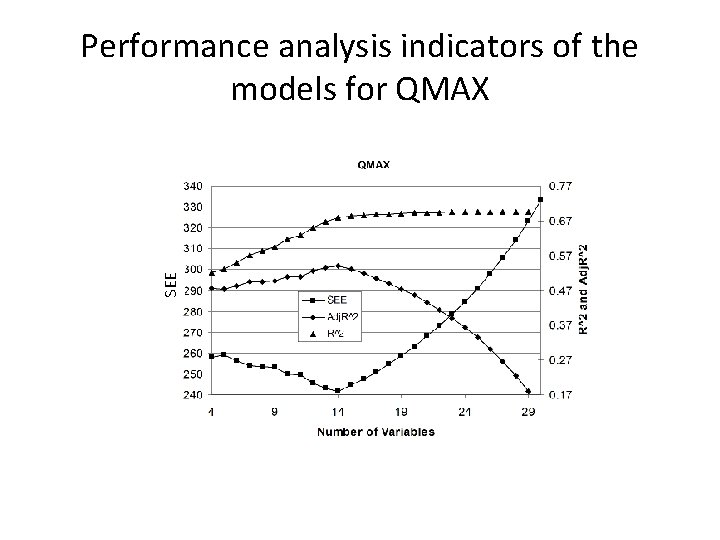
SEE Performance analysis indicators of the models for QMAX
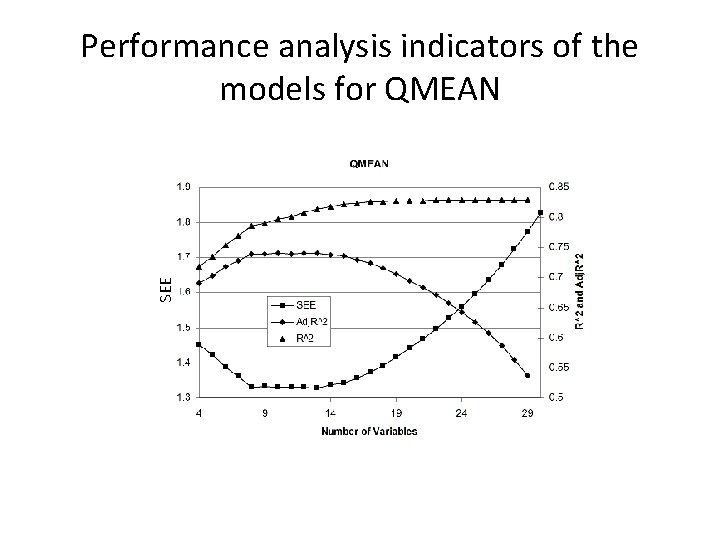
SEE Performance analysis indicators of the models for QMEAN
Conclusions • The models are satisfactory but can be improved. • New basin physiographical parameters can be added. • Highly correlated two or more parameters caused multicollinearity which is a statistical phenomenon brings the coefficient estimates may change erratically in response to small changes in the model or the data in the regression analysis. • All possible regression models may be tried but for 30 parameters more than a billion alternatives appears (2 n-1) so this technique should be applied after the elimination of some parameters. • Nonlinear regression or other model building techniques like Artificial Neural Networks can be performed in the future studies to obtain the best model.
Thank You For Your Attention Abdullah Cem Koc, Mesut Mese Denizli, TURKEY
- Slides: 21