
STRATEGY ANALYSIS AND CHOICE Gopal Salim UAE Strategic
- Slides: 95
STRATEGY ANALYSIS AND CHOICE Gopal Salim UAE
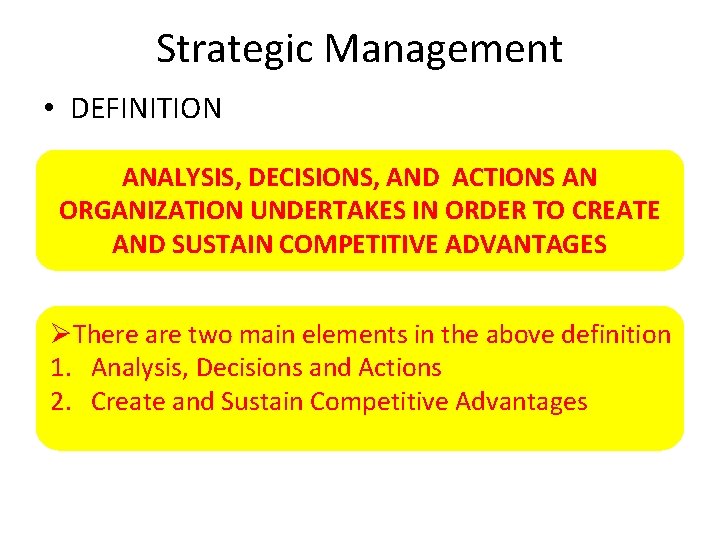
Strategic Management • DEFINITION ANALYSIS, DECISIONS, AND ACTIONS AN ORGANIZATION UNDERTAKES IN ORDER TO CREATE AND SUSTAIN COMPETITIVE ADVANTAGES ØThere are two main elements in the above definition 1. Analysis, Decisions and Actions 2. Create and Sustain Competitive Advantages
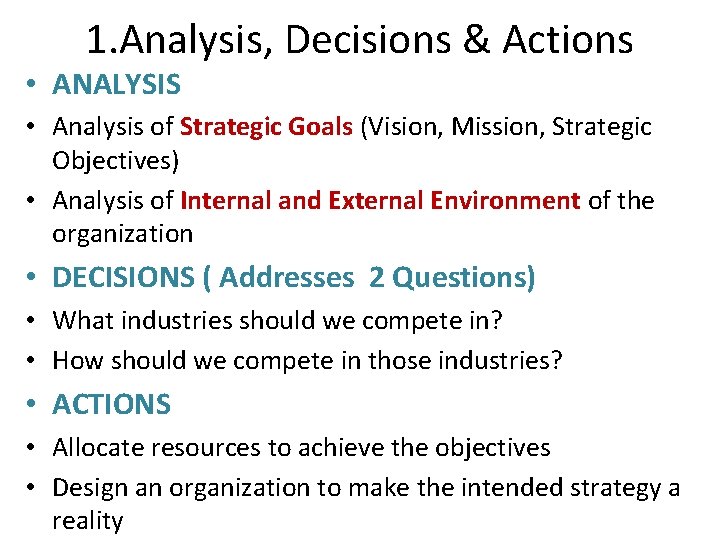
1. Analysis, Decisions & Actions • ANALYSIS • Analysis of Strategic Goals (Vision, Mission, Strategic Objectives) • Analysis of Internal and External Environment of the organization • DECISIONS ( Addresses 2 Questions) • What industries should we compete in? • How should we compete in those industries? • ACTIONS • Allocate resources to achieve the objectives • Design an organization to make the intended strategy a reality
2. Create & Sustain Competitive Advantage • This focus on two major questions 1. How should an organization compete to create competitive advantage in the market place or industry ? 2. How can an organization create competitive advantage that is not only unique and valuable , but difficult for competitors to copy?
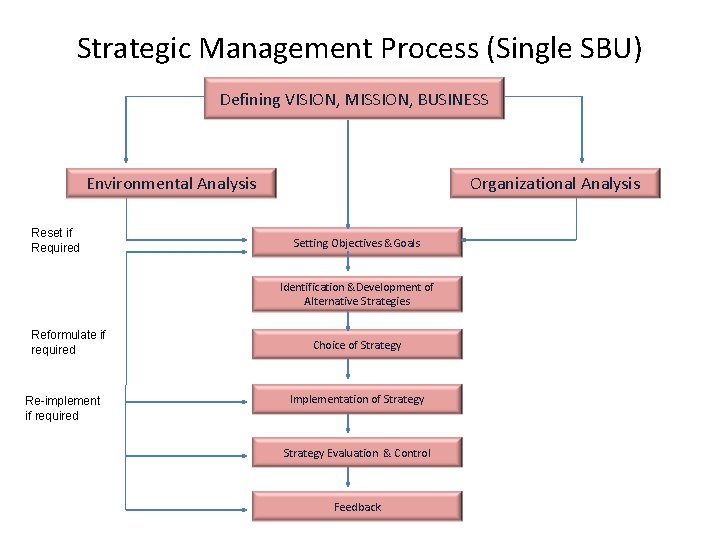
Strategic Process • The above definition of strategic management brings in a series of actions in an organization that is intended towards achieving the organizational goals so that the organization can sustain its competitive advantage in the long run. • The whole series of actions can be summarized in the form of a chart as given in the next power point
Strategic Management Process (Single SBU) Defining VISION, MISSION, BUSINESS Environmental Analysis Reset if Required Organizational Analysis Setting Objectives &Goals Identification &Development of Alternative Strategies Reformulate if required Re-implement if required Choice of Strategy Implementation of Strategy Evaluation & Control Feedback
Analysis of Objectives & Goals Organizational Vision § Vision serves the purpose of stating what an organization wishes to achieve in the long run § It is more of a dream than articulated idea and it should be “massively inspring, overarching and long term”. § It is powerful motivator to action § Vision articulates the position of an organization which it may retain in distant future
Analysis of Objectives & Goals Organizational Vision ENVISIONING § This is the process of creating vision § A well conceived vision should have: § Core ideology § This remains unchanged and has enduring character § Envisioned Future § This shows the long term objectives of the organization § Clear description of articulated future
Analysis of Objectives & Goals Organizational Vision Advantages of having a Vision 1. It promotes experimentation 2. Promotes long term thinking of the management 3. It promotes risk taking 4. It makes organization competitive, original and unique 5. It is inspiring and motivating to people
Analysis of Objectives & Goals Organizational Mission § It is the purpose or reason for the organization to exist § It answers “ why the organization is in existence”. § It is the basis of awareness of a sense of purpose
Analysis of Objectives & Goals Organizational Mission Characteristics of Mission Statement § The mission of an organization is always stated by Mission Statement. A mission statement should have the following characteristics: § It should be SMART (Specific, Measurable, Appropriate, Realistic and Timely) § Neither be too broad nor too narrow § Should not be ambiguous § Should be distinct § Should have societal linkage § Should be motivating
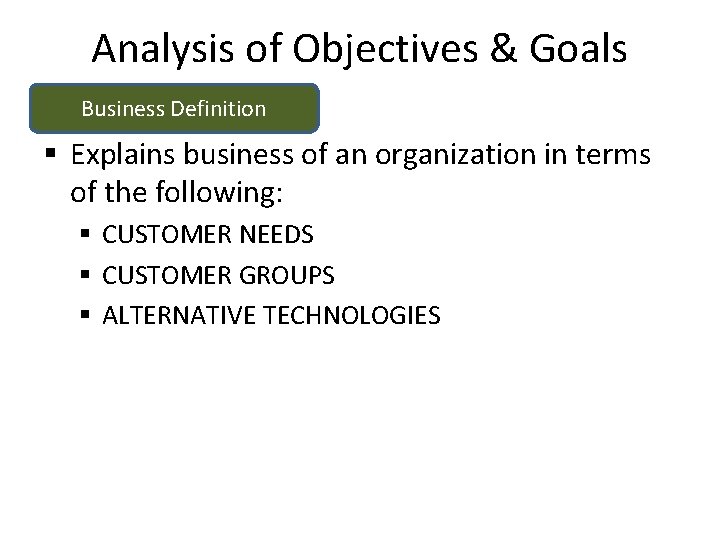
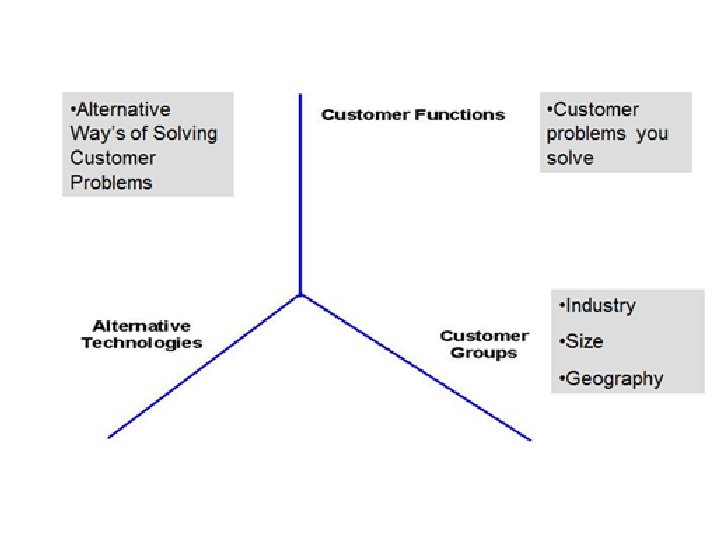
Analysis of Objectives & Goals Business Definition § Explains business of an organization in terms of the following: § CUSTOMER NEEDS § CUSTOMER GROUPS § ALTERNATIVE TECHNOLOGIES
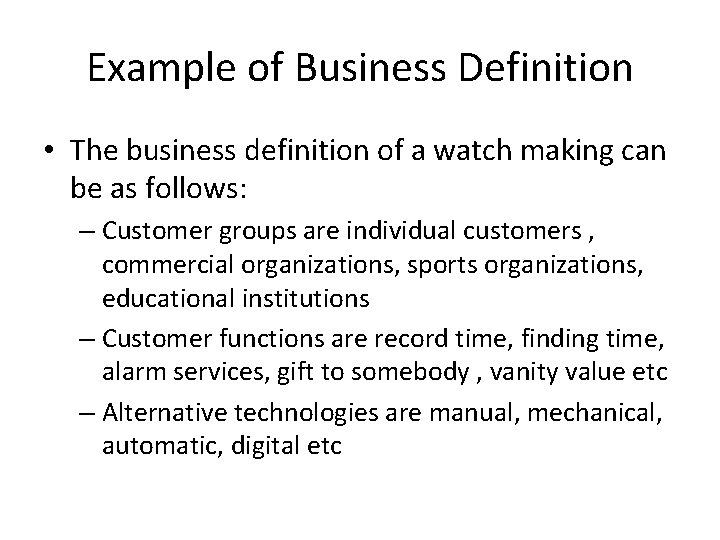
Example of Business Definition • The business definition of a watch making can be as follows: – Customer groups are individual customers , commercial organizations, sports organizations, educational institutions – Customer functions are record time, finding time, alarm services, gift to somebody , vanity value etc – Alternative technologies are manual, mechanical, automatic, digital etc
Objectives and Goals • Objectives are ultimate end results which is used to operationalize the mission statement • They are more specific than mission • It is the ultimate end results which are to be accomplished by overall plan over a specific period of time • Objectives are open ended and when they are stated in specific terms, it becomes goal
Difference between Objectives and Goals • Goals are broad, while objectives specific • Goals set for relatively longer period of time • Goals are more affected by external environment • Goals are not quantified, but objectives are quantified
What objectives should be set? • • Profit objective Marketing objective Productivity objective Product objective Social objective Financial objective HR Objective
Analyzing External Environment • The external environment is the totality of forces that is external to the business and it interact with the business in the market place. • The external environment provides the OPPORTUNITY for the firm to do business and at the same time it generates THREAT from the market.
Creating an Environmentally Aware Organization • A firm need to forecasts its environment for developing a strategy that create sustained competitive advantage • The inputs forecasting are : – Environmental Scanning – Environmental Monitoring – Competitive Intelligence
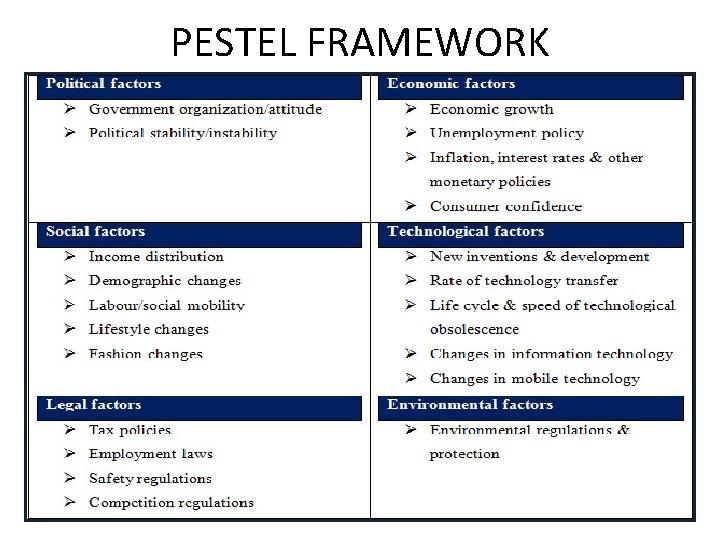
Creating an Environmentally Aware Organization • Role of Environment Scanning • This involves the surveillance of a firm’s external environment to predict environmental changes, and detect changes that is already underway. • For Environmental Scanning, we can use a framework which is known as PESTEL framework • An example of Pestel framework is given below:
PESTEL FRAMEWORK
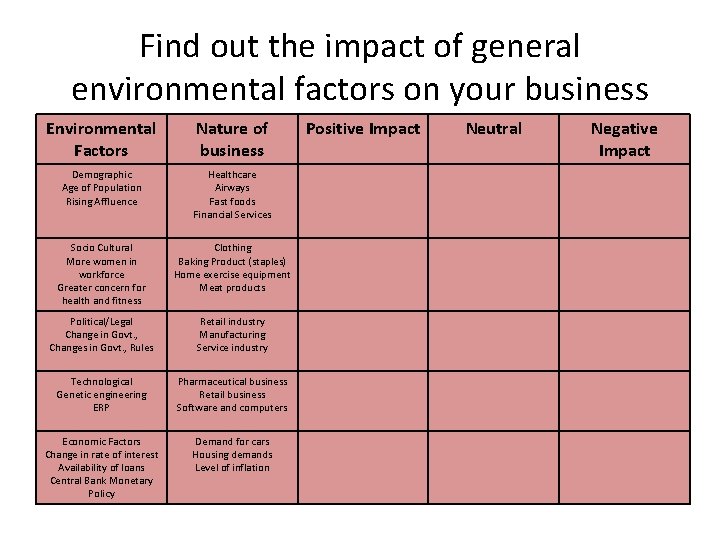
Find out the impact of general environmental factors on your business Environmental Factors Nature of business Demographic Age of Population Rising Affluence Healthcare Airways Fast foods Financial Services Socio Cultural More women in workforce Greater concern for health and fitness Clothing Baking Product (staples) Home exercise equipment Meat products Political/Legal Change in Govt. , Changes in Govt. , Rules Retail industry Manufacturing Service industry Technological Genetic engineering ERP Pharmaceutical business Retail business Software and computers Economic Factors Change in rate of interest Availability of loans Central Bank Monetary Policy Demand for cars Housing demands Level of inflation Positive Impact Neutral Negative Impact
Find out the impact of general environmental factors on your business • Consider the table given overleaf. • If the impact of a factors is positive, then it has got some positive influence on your business • If the impact is negative, then it has got some negative impact on your business • If it is neutral, then the factor is unimportant for you now
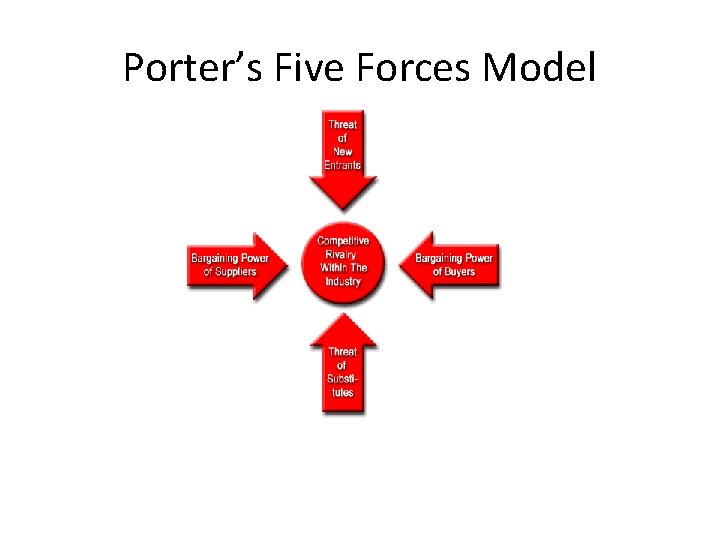
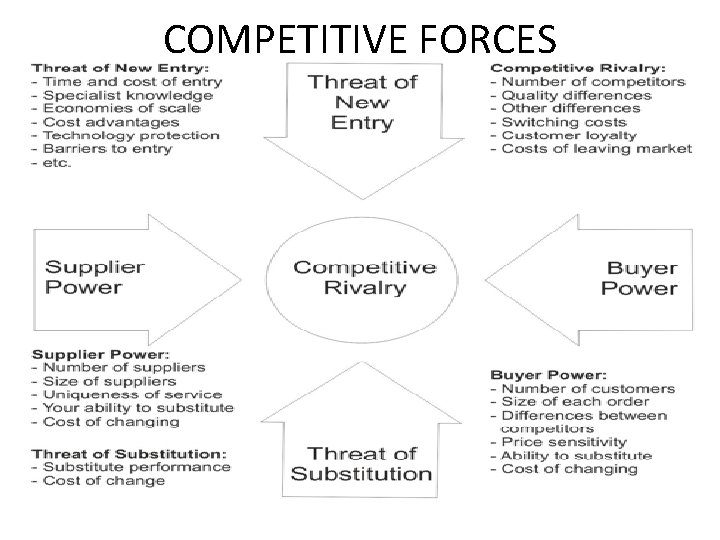
COMPETITIVE FORCES • One of the most uncertain environmental forces that affect the business is the competitive framework in the market. • One of the models that is highly acclaimed in assessing competitive framework is Michael E. Porter’s Five Forces Model.
Porter’s Five Forces Model
COMPETITIVE FORCES
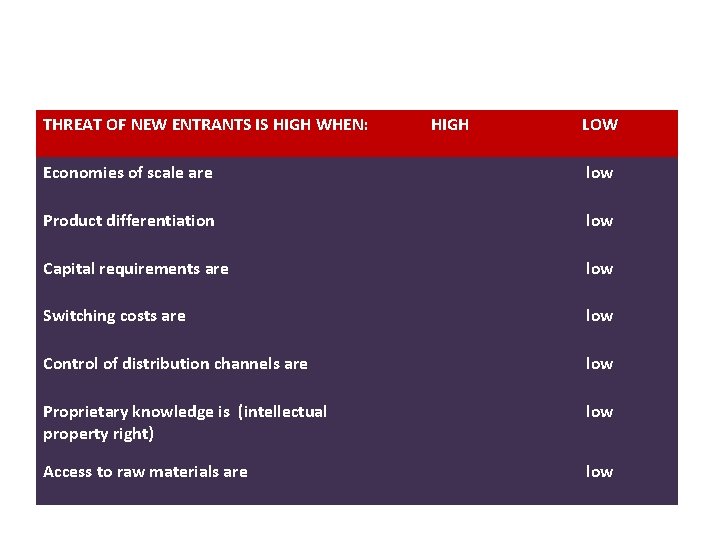
THREAT OF NEW ENTRANTS IS HIGH WHEN: HIGH LOW Economies of scale are low Product differentiation low Capital requirements are low Switching costs are low Control of distribution channels are low Proprietary knowledge is (intellectual property right) low Access to raw materials are low
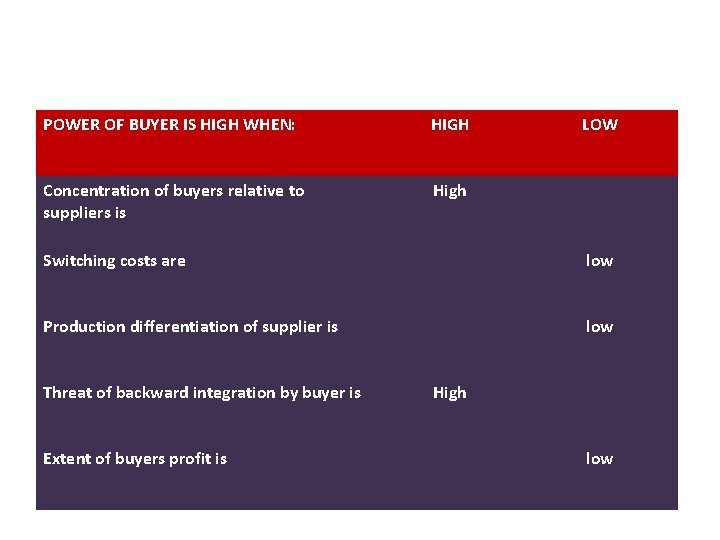
POWER OF BUYER IS HIGH WHEN: HIGH Concentration of buyers relative to suppliers is High LOW Switching costs are low Production differentiation of supplier is low Threat of backward integration by buyer is Extent of buyers profit is High low
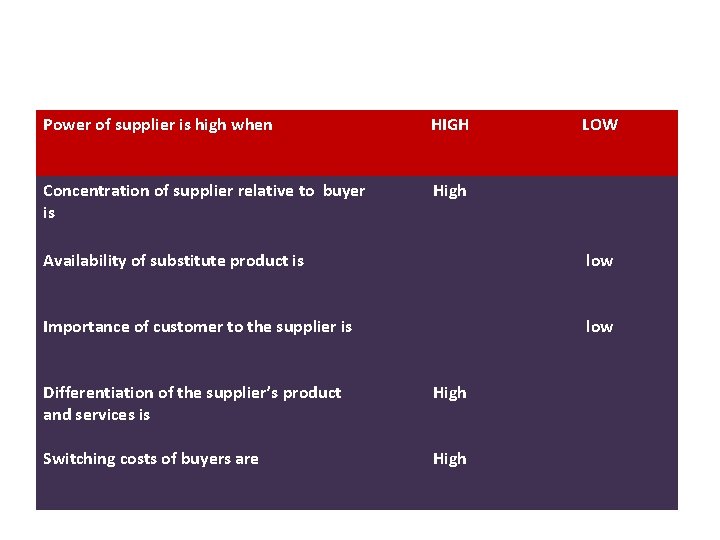
Power of supplier is high when HIGH Concentration of supplier relative to buyer is High LOW Availability of substitute product is low Importance of customer to the supplier is low Differentiation of the supplier’s product and services is High Switching costs of buyers are High
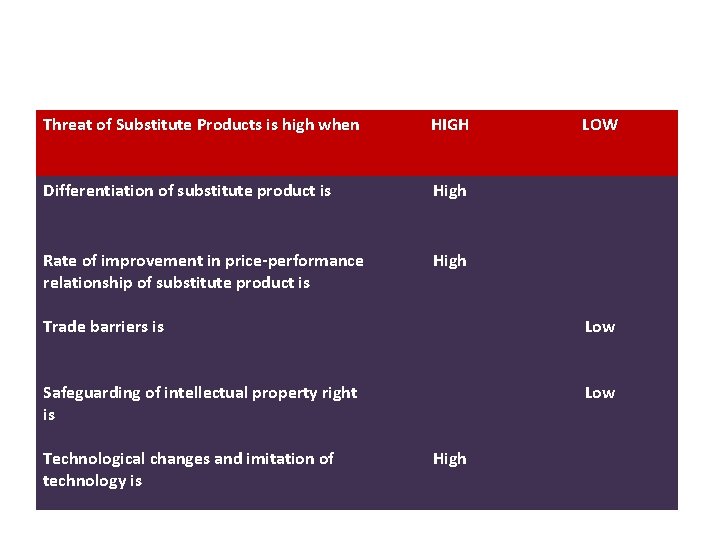
Threat of Substitute Products is high when HIGH Differentiation of substitute product is High Rate of improvement in price-performance relationship of substitute product is High LOW Trade barriers is Low Safeguarding of intellectual property right is Low Technological changes and imitation of technology is High
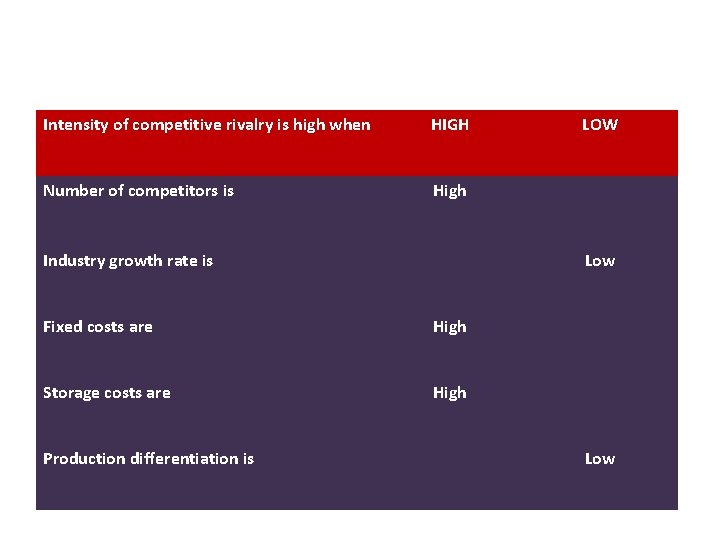
Intensity of competitive rivalry is high when HIGH Number of competitors is High Industry growth rate is Low Fixed costs are High Storage costs are High Production differentiation is LOW Low
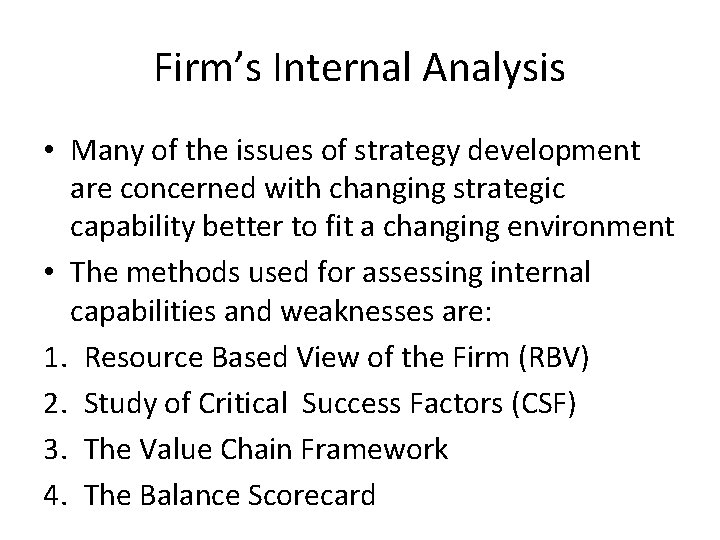
Firm’s Internal Analysis • Many of the issues of strategy development are concerned with changing strategic capability better to fit a changing environment • The methods used for assessing internal capabilities and weaknesses are: 1. Resource Based View of the Firm (RBV) 2. Study of Critical Success Factors (CSF) 3. The Value Chain Framework 4. The Balance Scorecard
STRATEGY FORMULATION FRAMEWORK : TOOLS AND TECHNIQUES
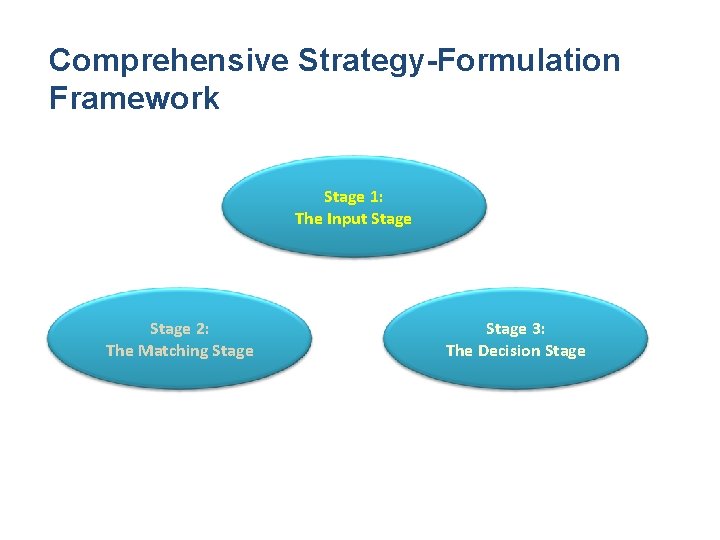
Comprehensive Strategy-Formulation Framework Stage 1: The Input Stage 2: The Matching Stage 3: The Decision Stage
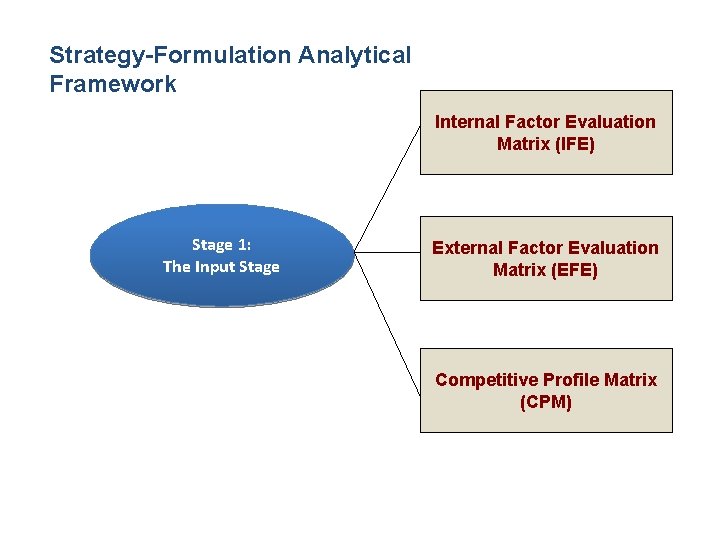
Strategy-Formulation Analytical Framework Internal Factor Evaluation Matrix (IFE) Stage 1: The Input Stage External Factor Evaluation Matrix (EFE) Competitive Profile Matrix (CPM)
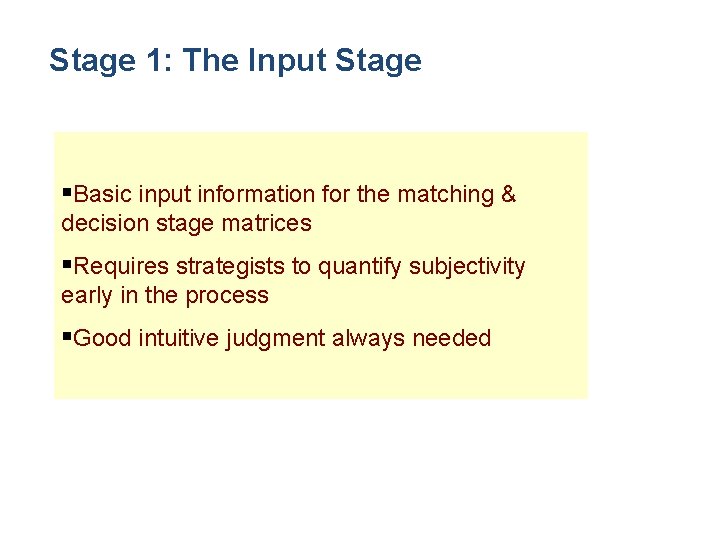
Stage 1: The Input Stage §Basic input information for the matching & decision stage matrices §Requires strategists to quantify subjectivity early in the process §Good intuitive judgment always needed
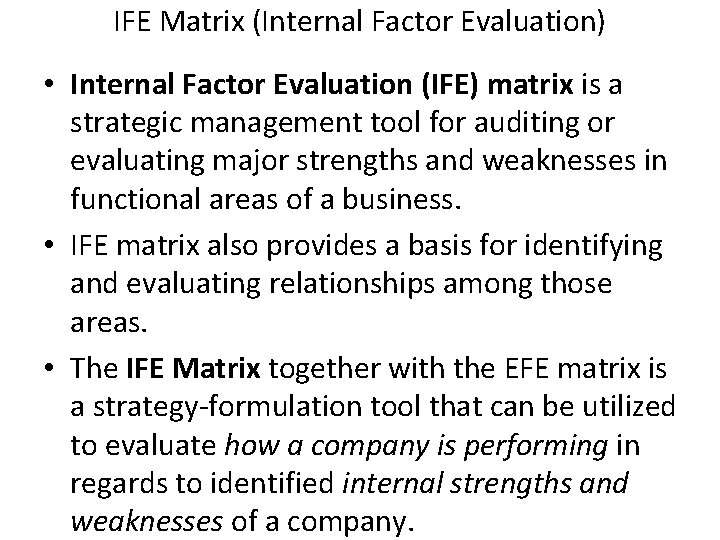
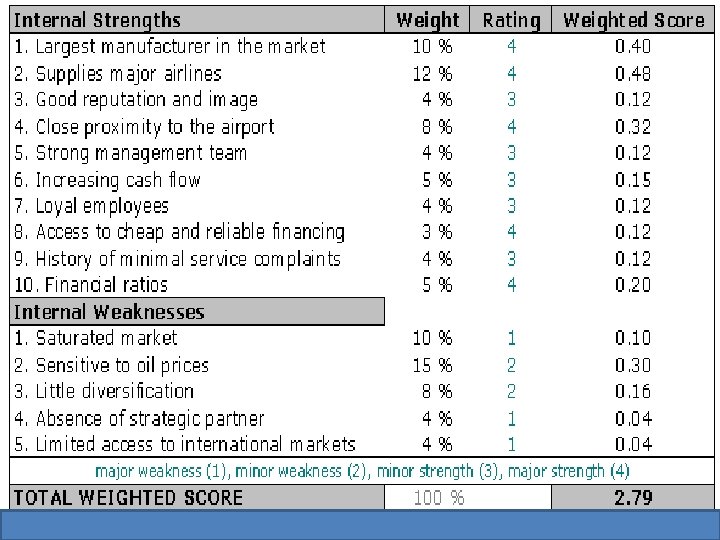
IFE Matrix (Internal Factor Evaluation) • Internal Factor Evaluation (IFE) matrix is a strategic management tool for auditing or evaluating major strengths and weaknesses in functional areas of a business. • IFE matrix also provides a basis for identifying and evaluating relationships among those areas. • The IFE Matrix together with the EFE matrix is a strategy-formulation tool that can be utilized to evaluate how a company is performing in regards to identified internal strengths and weaknesses of a company.
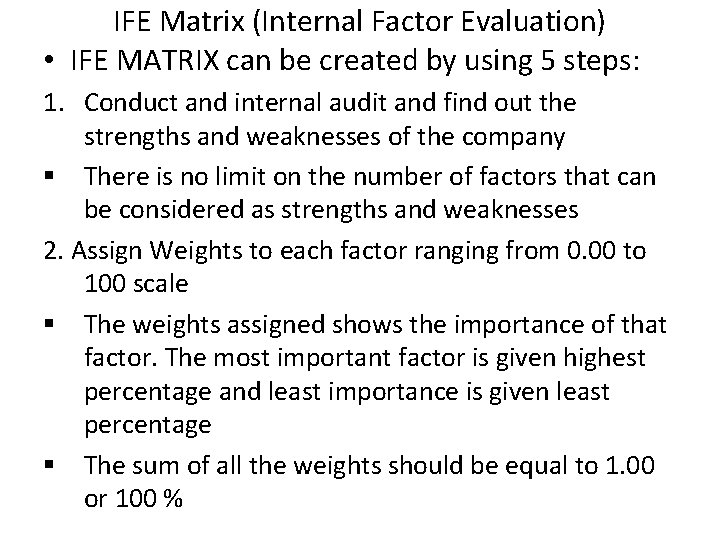
IFE Matrix (Internal Factor Evaluation) • IFE MATRIX can be created by using 5 steps: 1. Conduct and internal audit and find out the strengths and weaknesses of the company § There is no limit on the number of factors that can be considered as strengths and weaknesses 2. Assign Weights to each factor ranging from 0. 00 to 100 scale § The weights assigned shows the importance of that factor. The most important factor is given highest percentage and least importance is given least percentage § The sum of all the weights should be equal to 1. 00 or 100 %
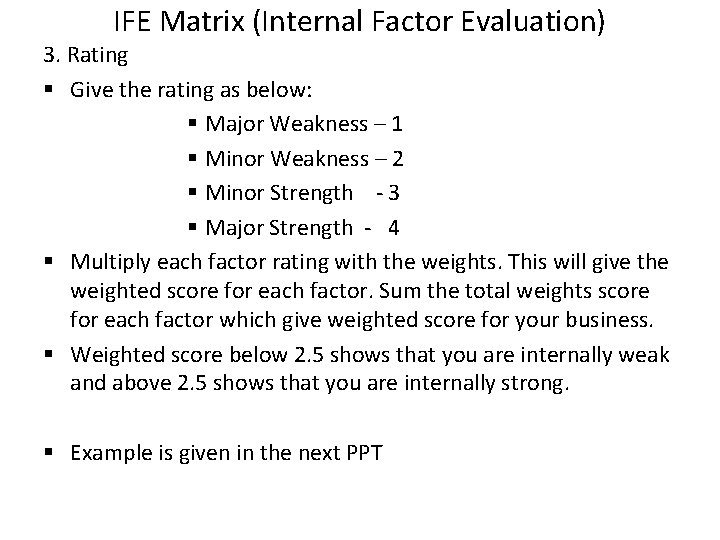
IFE Matrix (Internal Factor Evaluation) 3. Rating § Give the rating as below: § Major Weakness – 1 § Minor Weakness – 2 § Minor Strength - 3 § Major Strength - 4 § Multiply each factor rating with the weights. This will give the weighted score for each factor. Sum the total weights score for each factor which give weighted score for your business. § Weighted score below 2. 5 shows that you are internally weak and above 2. 5 shows that you are internally strong. § Example is given in the next PPT
External Factor Evaluation Matrix (EFE) • External Factor Evaluation (EFE) matrix method is a strategic-management tool often used for assessment of current business conditions. • The EFE matrix is a good tool to visualize and prioritize the opportunities and threats that a business is facing.
Development of EFE Matrix 1. List Opportunities and Threats • List one by one the opportunities and threats of the business 2. Assign Weightage • Assign a weight to each factor • The value of weight should be between 0 and 1 ( or use a scale on 0 to 100) • Zero means factors is unimportant. If it is nearing either one or 100, it is important • The total value of weight will be 1 or 100
Development of EFE Matrix 3. Rate Factors • Assign a rating to each factor. • Rating should be between 1 and 4 • Ratings indicate the effectiveness of the present strategy of the firm to the factor under consideration • Rating should be given as follows: § Poor Response – 1 § Below Average Response -2 § Above Average Response – 3 § Superior Response - 4
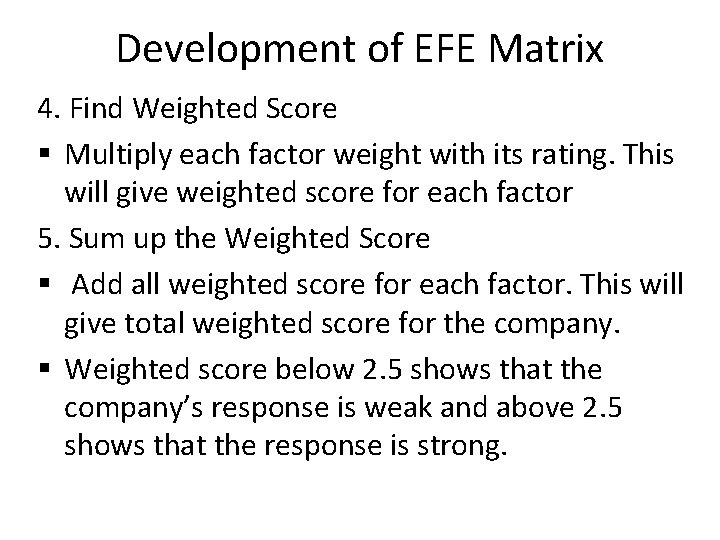
Development of EFE Matrix 4. Find Weighted Score § Multiply each factor weight with its rating. This will give weighted score for each factor 5. Sum up the Weighted Score § Add all weighted score for each factor. This will give total weighted score for the company. § Weighted score below 2. 5 shows that the company’s response is weak and above 2. 5 shows that the response is strong.
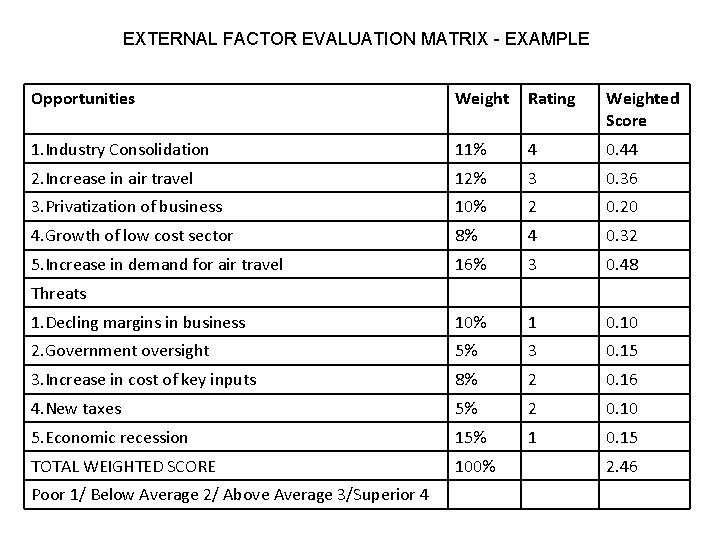
EXTERNAL FACTOR EVALUATION MATRIX - EXAMPLE Opportunities Weight Rating Weighted Score 1. Industry Consolidation 11% 4 0. 44 2. Increase in air travel 12% 3 0. 36 3. Privatization of business 10% 2 0. 20 4. Growth of low cost sector 8% 4 0. 32 5. Increase in demand for air travel 16% 3 0. 48 1. Decling margins in business 10% 1 0. 10 2. Government oversight 5% 3 0. 15 3. Increase in cost of key inputs 8% 2 0. 16 4. New taxes 5% 2 0. 10 5. Economic recession 15% 1 0. 15 TOTAL WEIGHTED SCORE 100% Threats Poor 1/ Below Average 2/ Above Average 3/Superior 4 2. 46
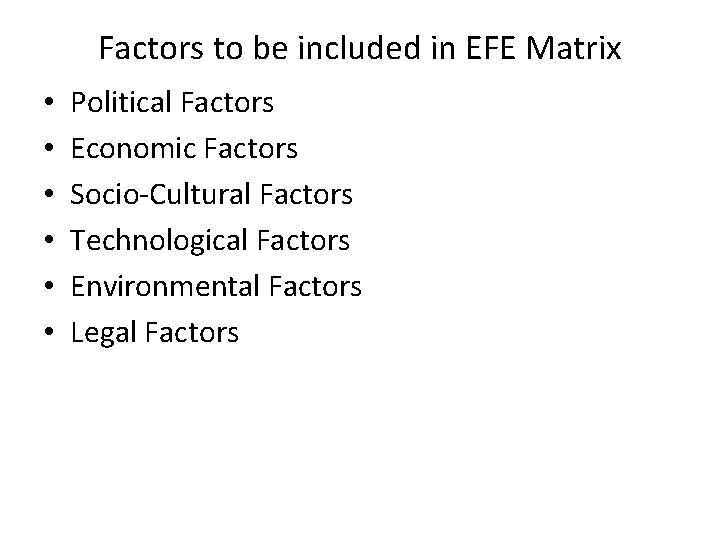
Factors to be included in EFE Matrix • • • Political Factors Economic Factors Socio-Cultural Factors Technological Factors Environmental Factors Legal Factors
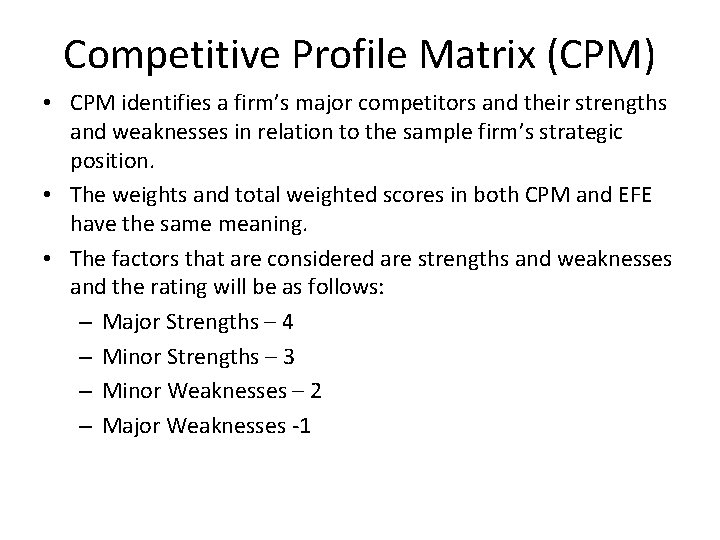
Competitive Profile Matrix (CPM) • CPM identifies a firm’s major competitors and their strengths and weaknesses in relation to the sample firm’s strategic position. • The weights and total weighted scores in both CPM and EFE have the same meaning. • The factors that are considered are strengths and weaknesses and the rating will be as follows: – Major Strengths – 4 – Minor Strengths – 3 – Minor Weaknesses – 2 – Major Weaknesses -1
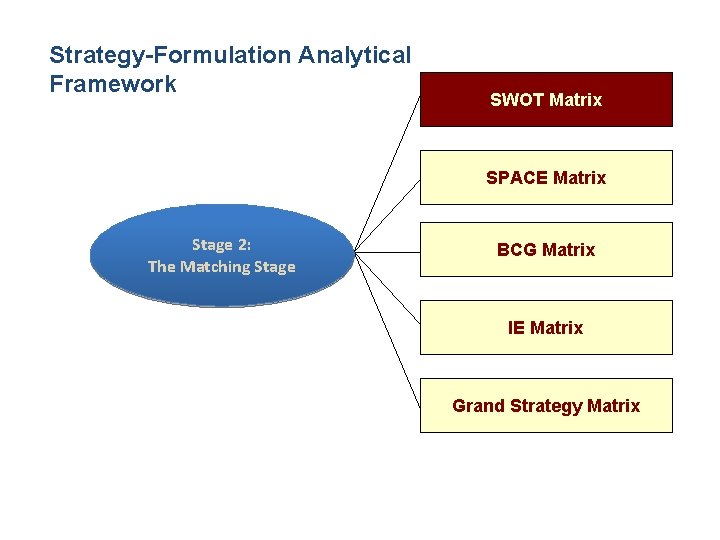
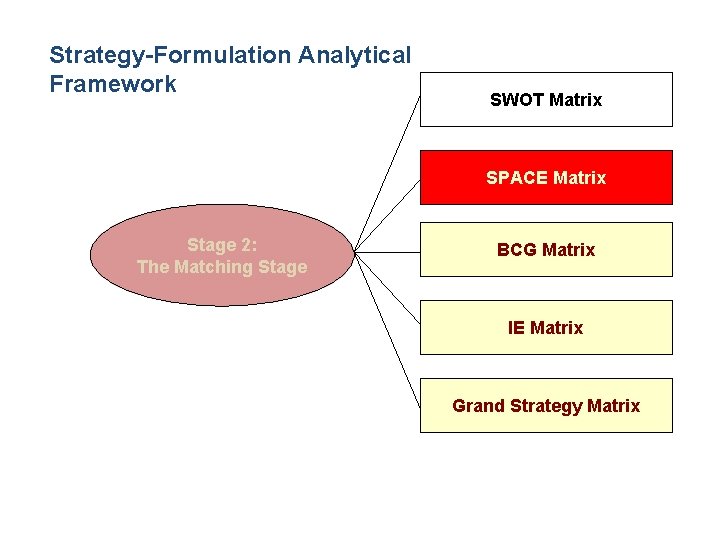
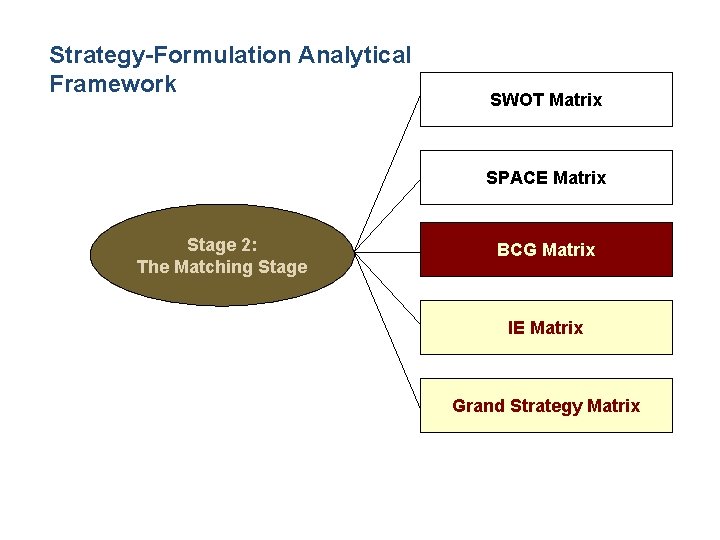
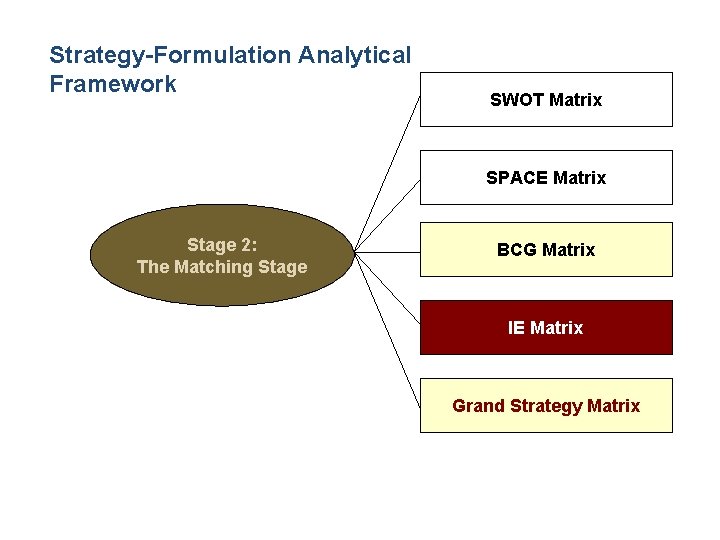
Strategy-Formulation Analytical Framework SWOT Matrix SPACE Matrix Stage 2: The Matching Stage BCG Matrix IE Matrix Grand Strategy Matrix
Stage 2: The Matching Stage §Match between organization’s internal resources & skills and the opportunities & risks created by its external factors
Stage 2: The Matching Stage SWOT Matrix §Strengths §Weaknesses §Opportunities §Threats
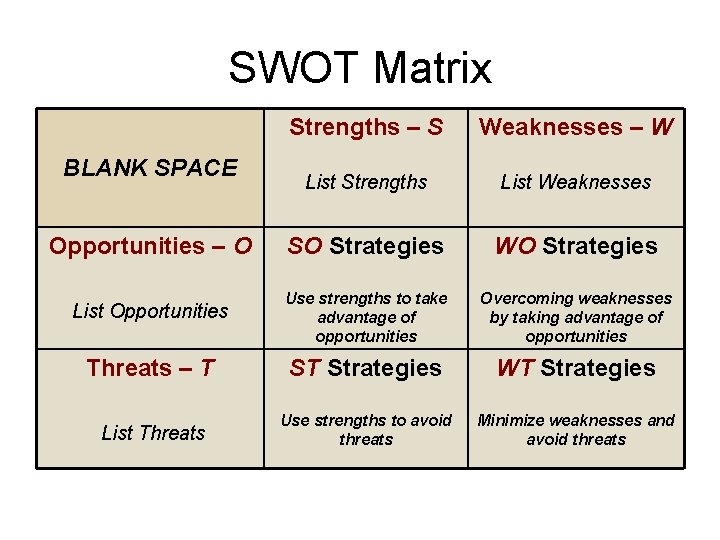
SWOT Matrix Four Types of Strategies §Strengths-Opportunities (SO) §Weaknesses-Opportunities (WO) §Strengths-Threats (ST) §Weaknesses-Threats (WT)
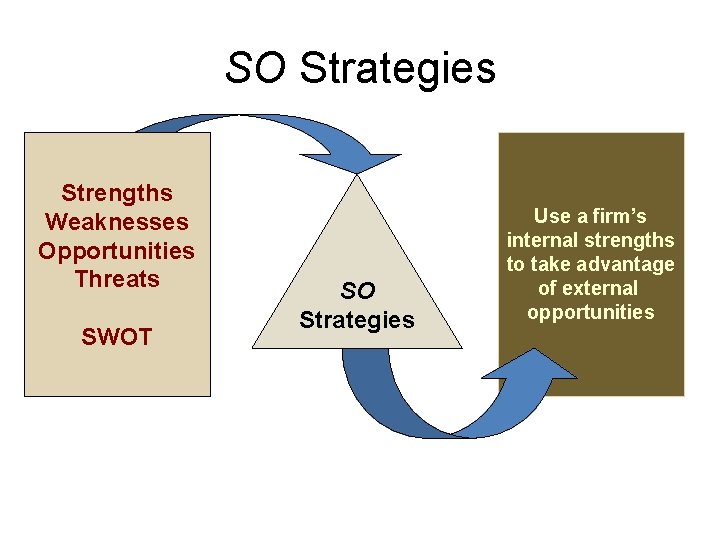
SO Strategies Strengths Weaknesses Opportunities Threats SWOT SO Strategies Use a firm’s internal strengths to take advantage of external opportunities
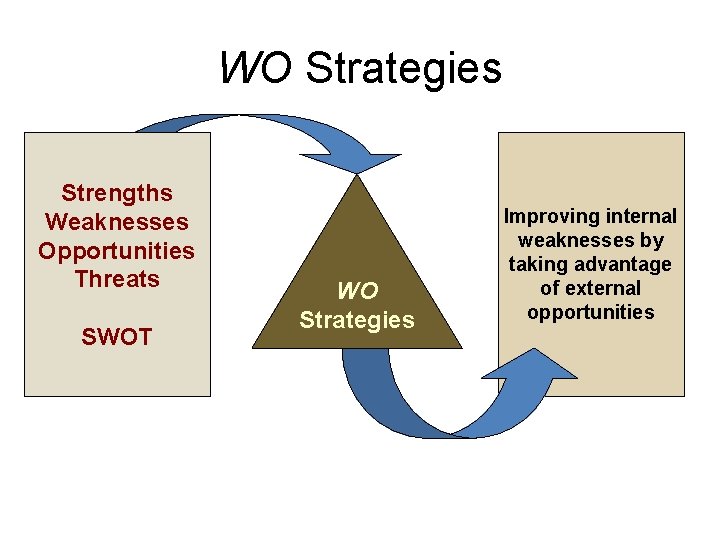
WO Strategies Strengths Weaknesses Opportunities Threats SWOT WO Strategies Improving internal weaknesses by taking advantage of external opportunities
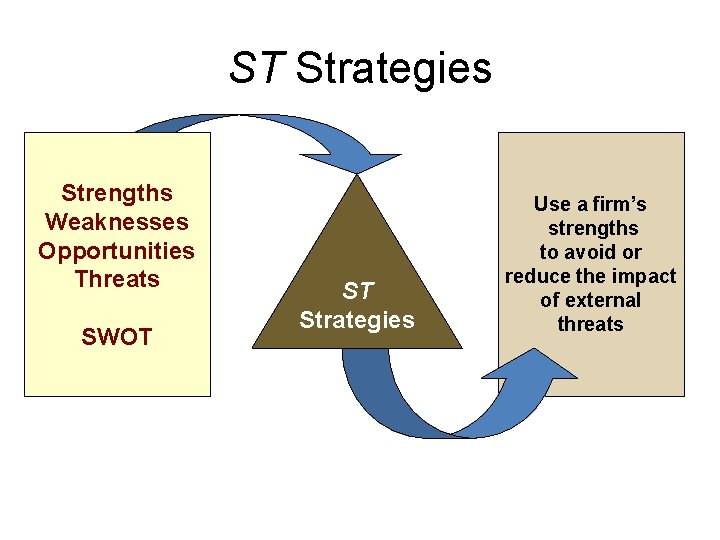
ST Strategies Strengths Weaknesses Opportunities Threats SWOT ST Strategies Use a firm’s strengths to avoid or reduce the impact of external threats
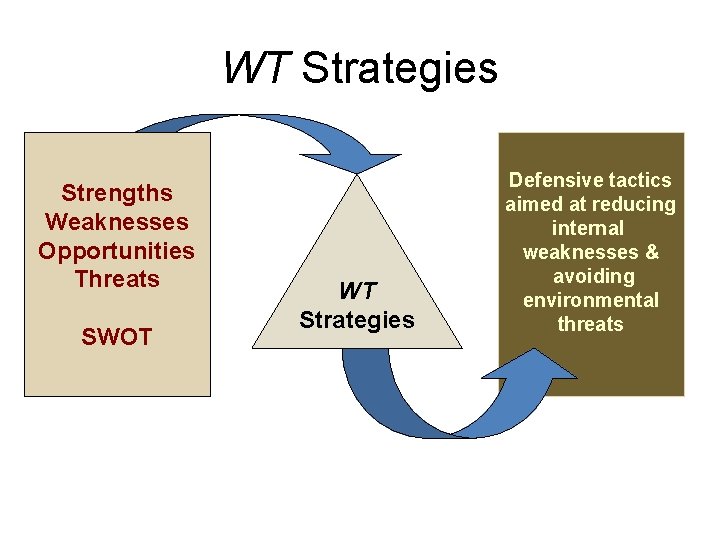
WT Strategies Strengths Weaknesses Opportunities Threats SWOT WT Strategies Defensive tactics aimed at reducing internal weaknesses & avoiding environmental threats
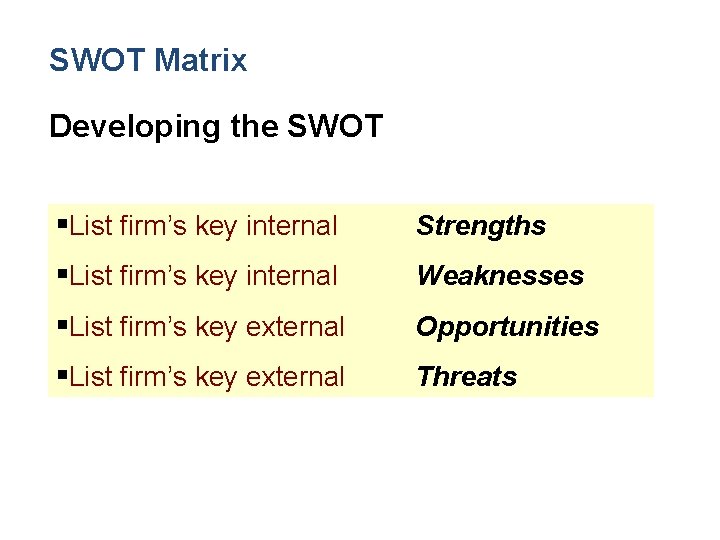
SWOT Matrix Developing the SWOT §List firm’s key internal Strengths §List firm’s key internal Weaknesses §List firm’s key external Opportunities §List firm’s key external Threats
SWOT Matrix Strengths – S Weaknesses – W List Strengths List Weaknesses Opportunities – O SO Strategies WO Strategies List Opportunities Use strengths to take advantage of opportunities Overcoming weaknesses by taking advantage of opportunities Threats – T ST Strategies WT Strategies List Threats Use strengths to avoid threats Minimize weaknesses and avoid threats BLANK SPACE
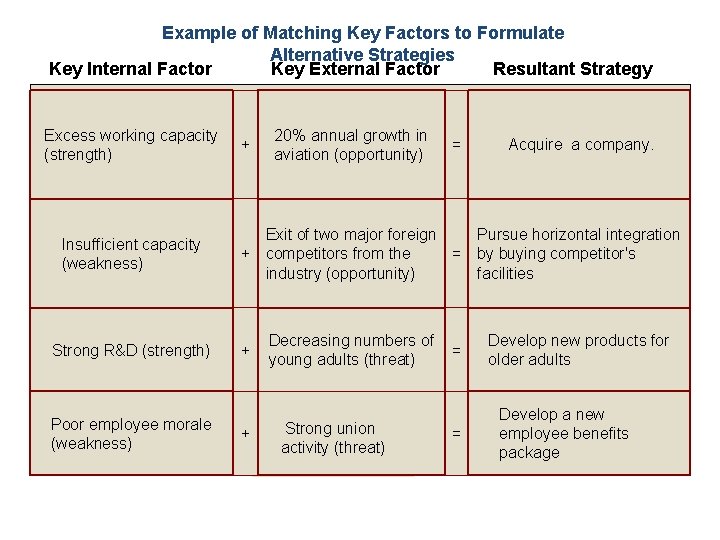
Example of Matching Key Factors to Formulate Alternative Strategies Key Internal Factor Key External Factor Resultant Strategy Excess working capacity (strength) Insufficient capacity (weakness) Strong R&D (strength) Poor employee morale (weakness) + 20% annual growth in aviation (opportunity) = Acquire a company. Exit of two major foreign Pursue horizontal integration + competitors from the = by buying competitor's industry (opportunity) facilities + + Decreasing numbers of young adults (threat) Strong union activity (threat) = = Develop new products for older adults Develop a new employee benefits package
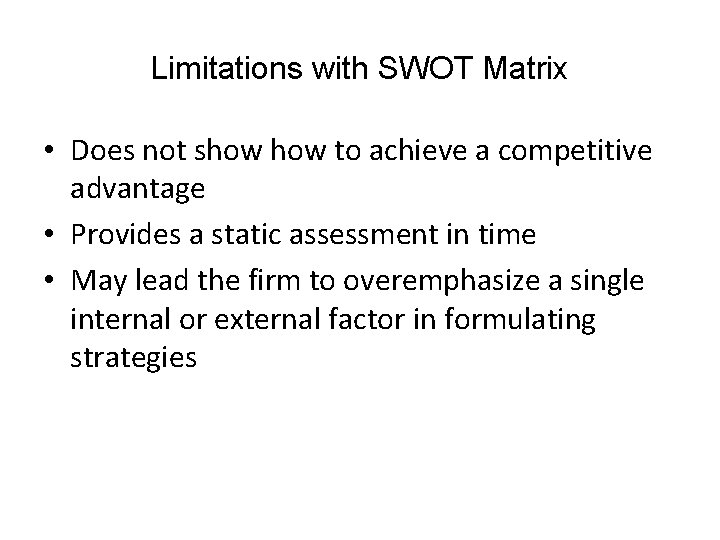
Limitations with SWOT Matrix • Does not show to achieve a competitive advantage • Provides a static assessment in time • May lead the firm to overemphasize a single internal or external factor in formulating strategies
Strategy-Formulation Analytical Framework SWOT Matrix SPACE Matrix Stage 2: The Matching Stage BCG Matrix IE Matrix Grand Strategy Matrix
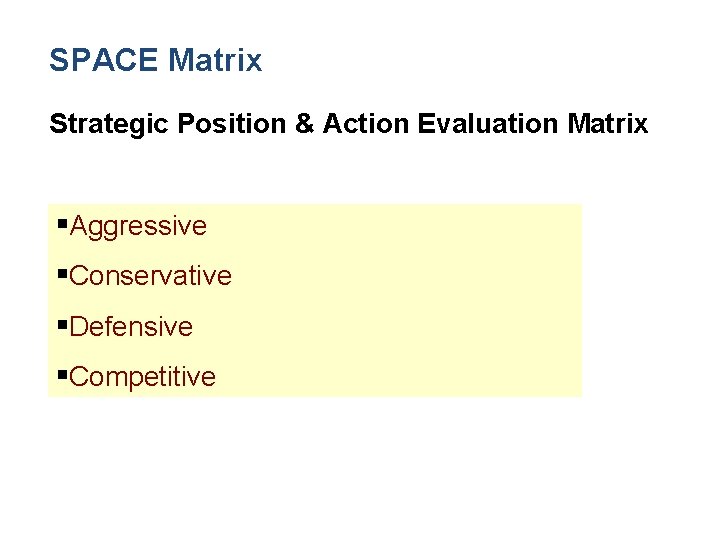
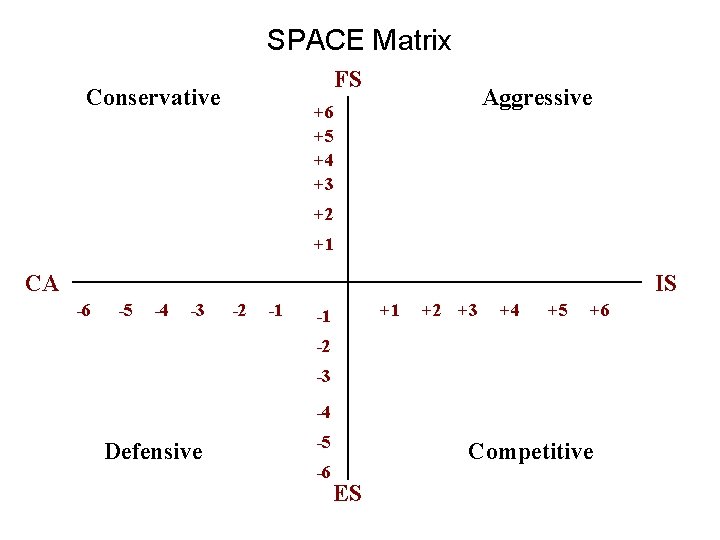
SPACE Matrix Strategic Position & Action Evaluation Matrix §Aggressive §Conservative §Defensive §Competitive
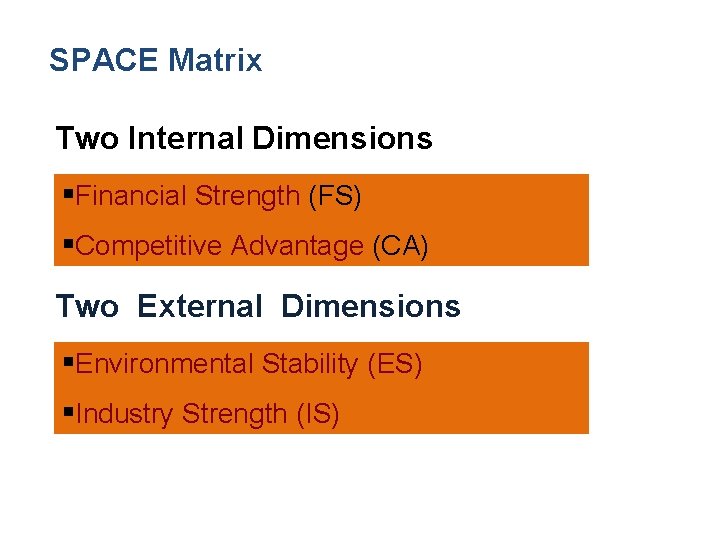
SPACE Matrix Two Internal Dimensions §Financial Strength (FS) §Competitive Advantage (CA) Two External Dimensions §Environmental Stability (ES) §Industry Strength (IS)
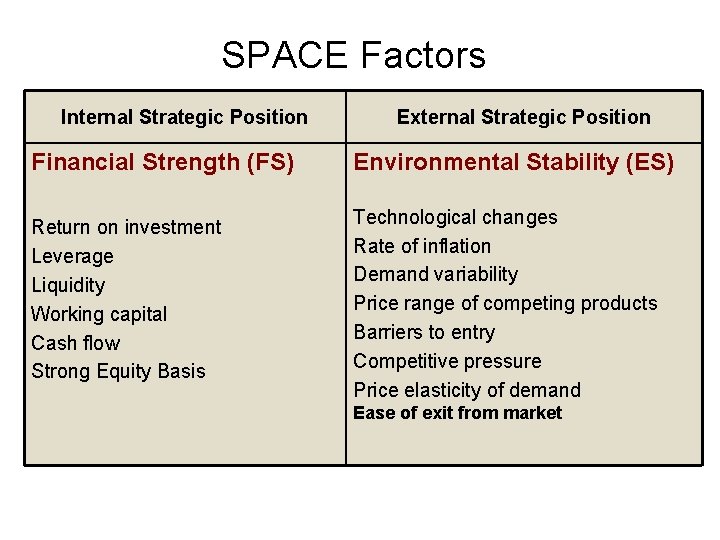
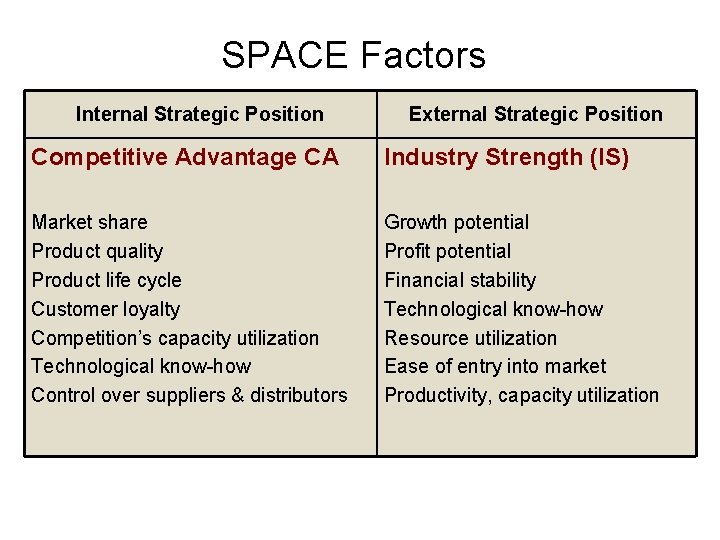
SPACE Factors Internal Strategic Position External Strategic Position Financial Strength (FS) Environmental Stability (ES) Return on investment Leverage Liquidity Working capital Cash flow Strong Equity Basis Technological changes Rate of inflation Demand variability Price range of competing products Barriers to entry Competitive pressure Price elasticity of demand Ease of exit from market
SPACE Factors Internal Strategic Position External Strategic Position Competitive Advantage CA Industry Strength (IS) Market share Product quality Product life cycle Customer loyalty Competition’s capacity utilization Technological know-how Control over suppliers & distributors Growth potential Profit potential Financial stability Technological know-how Resource utilization Ease of entry into market Productivity, capacity utilization
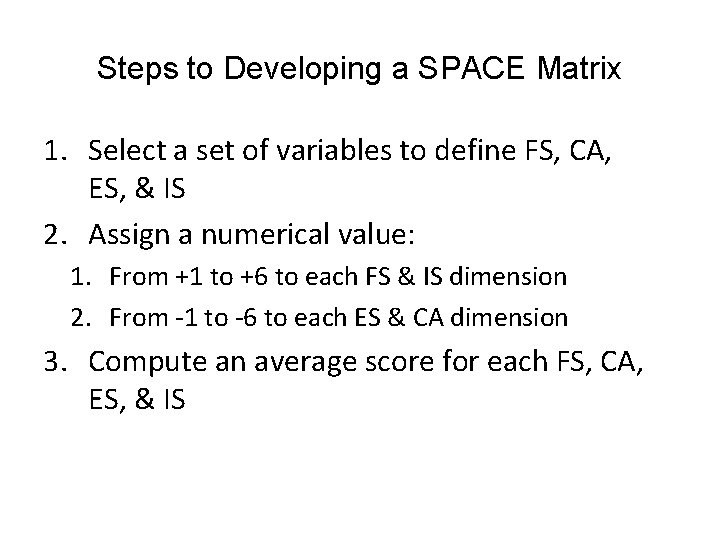
Steps to Developing a SPACE Matrix 1. Select a set of variables to define FS, CA, ES, & IS 2. Assign a numerical value: 1. From +1 to +6 to each FS & IS dimension 2. From -1 to -6 to each ES & CA dimension 3. Compute an average score for each FS, CA, ES, & IS
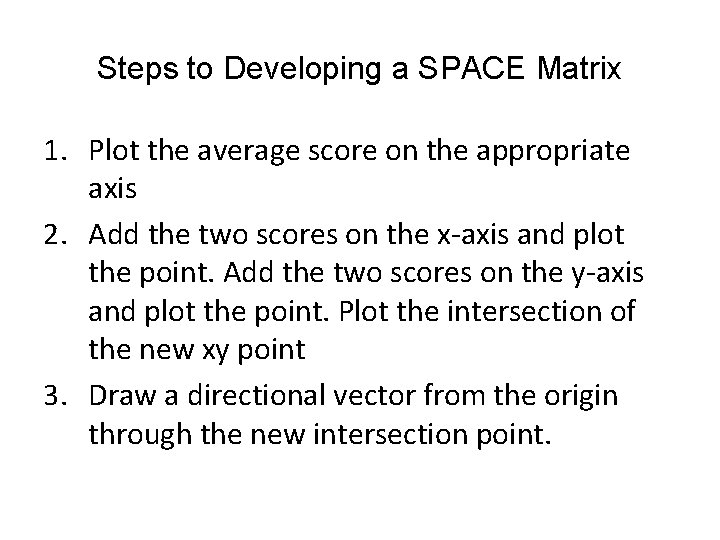
Steps to Developing a SPACE Matrix 1. Plot the average score on the appropriate axis 2. Add the two scores on the x-axis and plot the point. Add the two scores on the y-axis and plot the point. Plot the intersection of the new xy point 3. Draw a directional vector from the origin through the new intersection point.
SPACE Matrix FS Conservative Aggressive +6 +5 +4 +3 +2 +1 CA IS -6 -5 -4 -3 -2 -1 +1 -1 +2 +3 +4 +5 +6 -2 -3 -4 Defensive -5 -6 Competitive ES
Strategy-Formulation Analytical Framework SWOT Matrix SPACE Matrix Stage 2: The Matching Stage BCG Matrix IE Matrix Grand Strategy Matrix
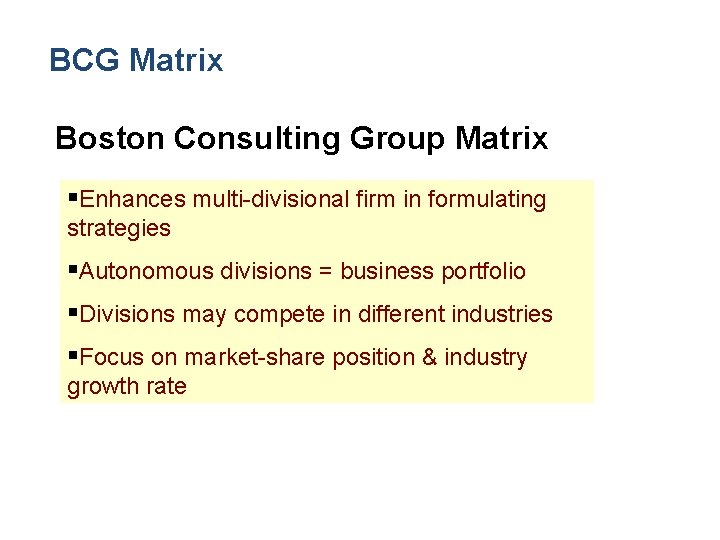
BCG Matrix Boston Consulting Group Matrix §Enhances multi-divisional firm in formulating strategies §Autonomous divisions = business portfolio §Divisions may compete in different industries §Focus on market-share position & industry growth rate
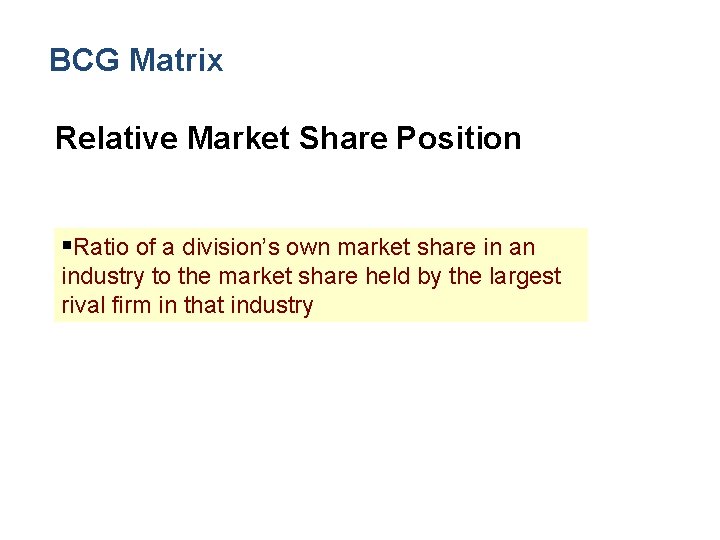
BCG Matrix Relative Market Share Position §Ratio of a division’s own market share in an industry to the market share held by the largest rival firm in that industry
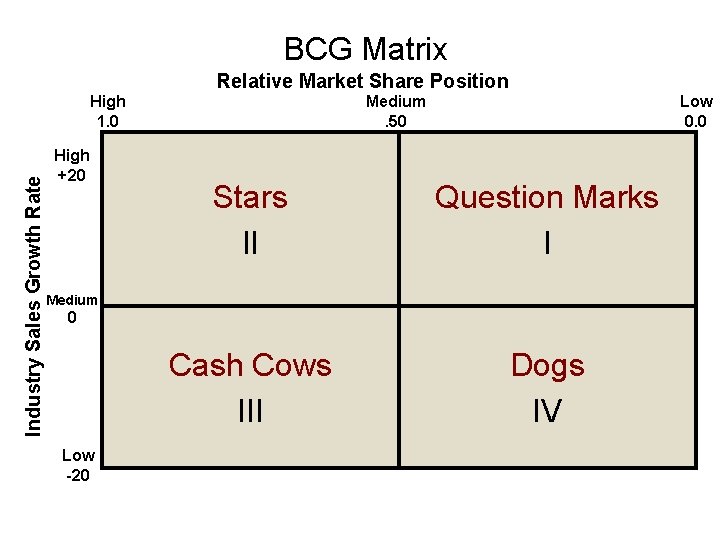
BCG Matrix Relative Market Share Position Industry Sales Growth Rate High 1. 0 High +20 Medium. 50 Low 0. 0 Stars II Question Marks I Cash Cows III Dogs IV Medium 0 Low -20
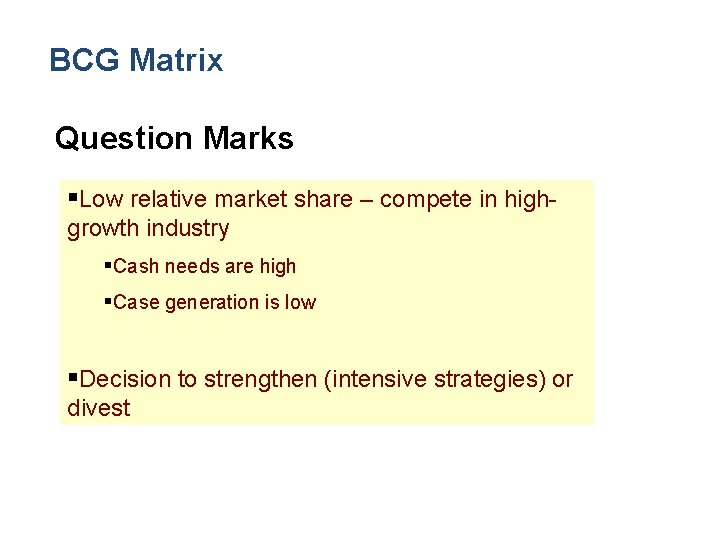
BCG Matrix Question Marks §Low relative market share – compete in highgrowth industry §Cash needs are high §Case generation is low §Decision to strengthen (intensive strategies) or divest
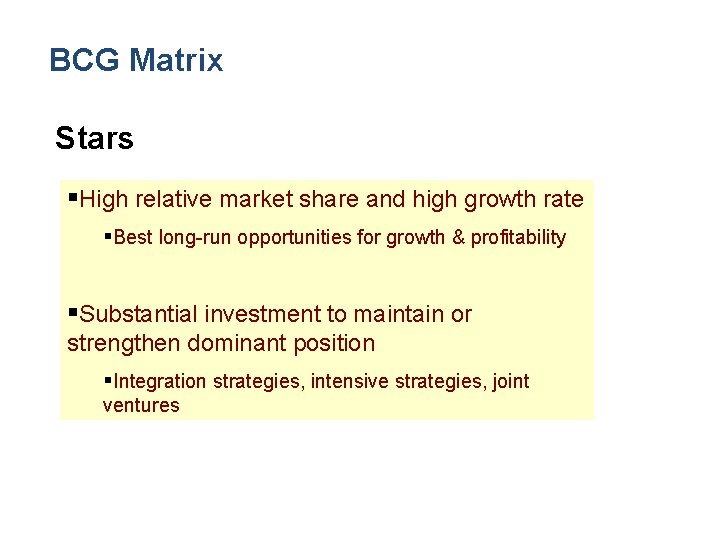
BCG Matrix Stars §High relative market share and high growth rate §Best long-run opportunities for growth & profitability §Substantial investment to maintain or strengthen dominant position §Integration strategies, intensive strategies, joint ventures
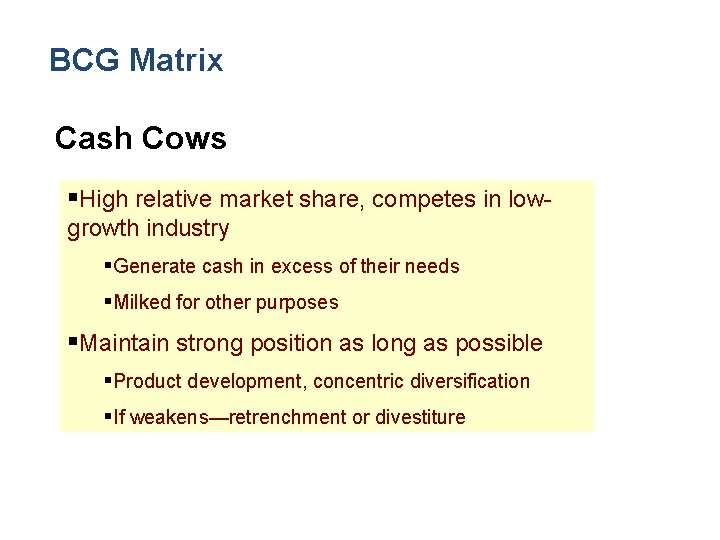
BCG Matrix Cash Cows §High relative market share, competes in lowgrowth industry §Generate cash in excess of their needs §Milked for other purposes §Maintain strong position as long as possible §Product development, concentric diversification §If weakens—retrenchment or divestiture
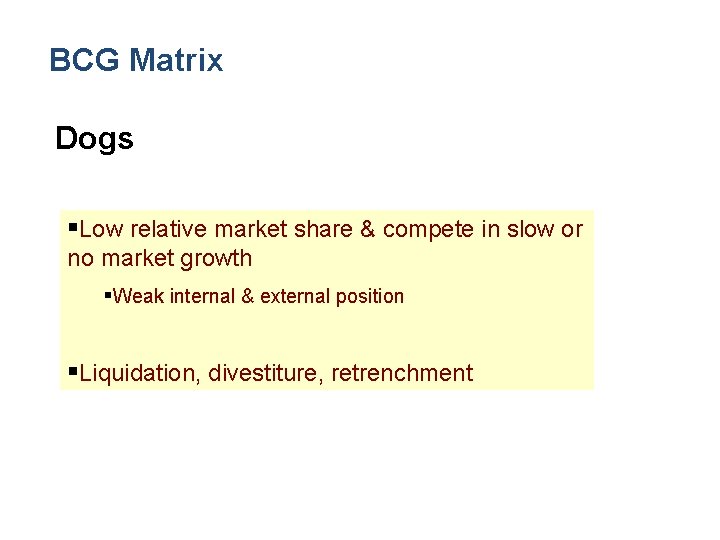
BCG Matrix Dogs §Low relative market share & compete in slow or no market growth §Weak internal & external position §Liquidation, divestiture, retrenchment
Strategy-Formulation Analytical Framework SWOT Matrix SPACE Matrix Stage 2: The Matching Stage BCG Matrix IE Matrix Grand Strategy Matrix
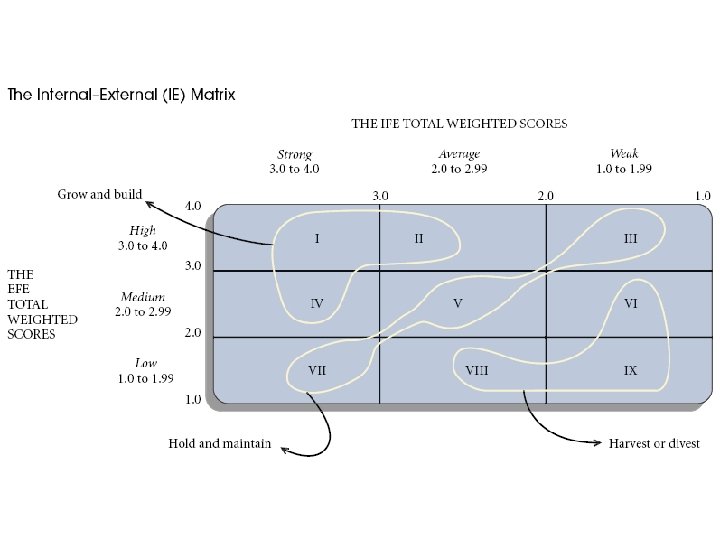
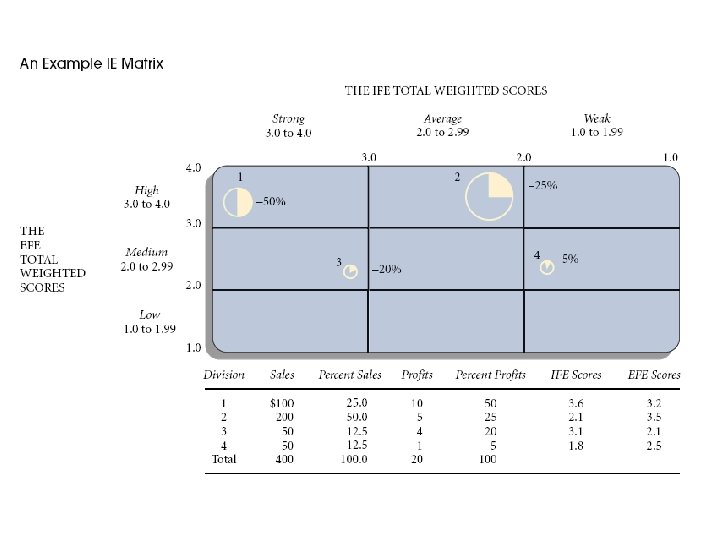
The Internal-External Matrix • Positions an organization’s various divisions in a nine-cell display • Similar to BCG Matrix except the IE Matrix: – Requires more information about the divisions – Strategic implications of each matrix are different
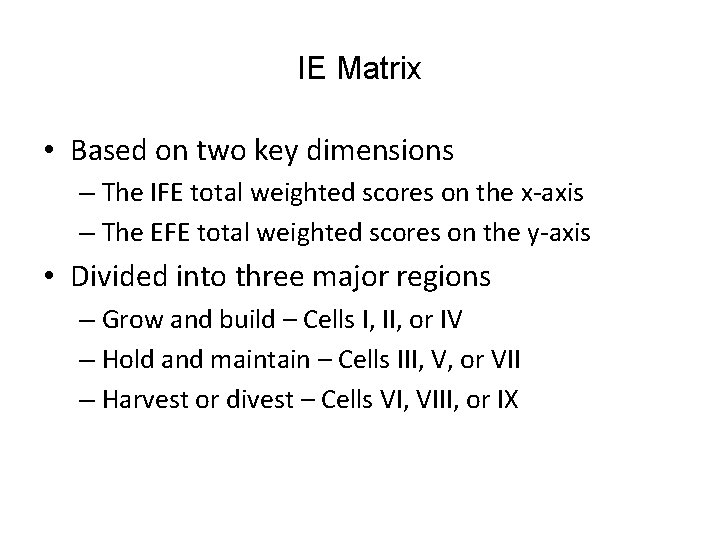
IE Matrix • Based on two key dimensions – The IFE total weighted scores on the x-axis – The EFE total weighted scores on the y-axis • Divided into three major regions – Grow and build – Cells I, II, or IV – Hold and maintain – Cells III, V, or VII – Harvest or divest – Cells VI, VIII, or IX
Strategy-Formulation Analytical Framework SWOT Matrix SPACE Matrix Stage 2: The Matching Stage BCG Matrix IE Matrix Grand Strategy Matrix
Grand Strategy Matrix §Tool formulating alternative strategies §Based on two dimensions §Competitive position §Market growth
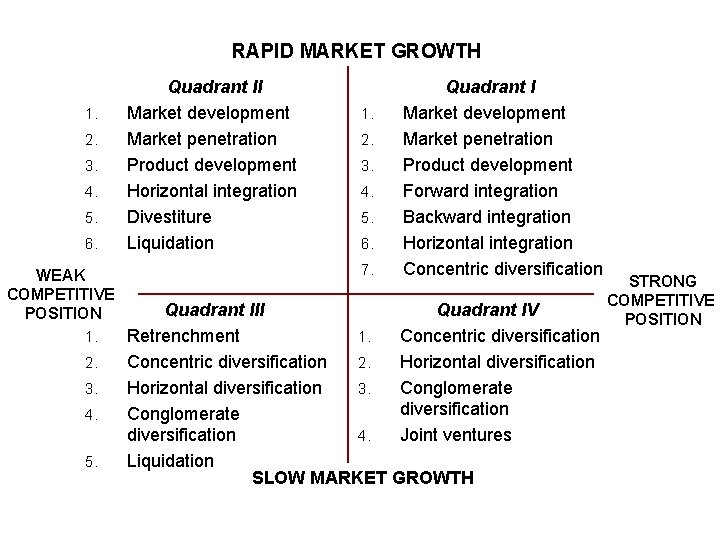
RAPID MARKET GROWTH 1. 2. 3. 4. 5. 6. WEAK COMPETITIVE POSITION 1. 2. 3. 4. 5. Quadrant II Market development Market penetration Product development Horizontal integration Divestiture Liquidation 1. 2. 3. 4. 5. 6. 7. Quadrant I Market development Market penetration Product development Forward integration Backward integration Horizontal integration Concentric diversification Quadrant III Quadrant IV Retrenchment 1. Concentric diversification 2. Horizontal diversification 3. Conglomerate diversification 4. Joint ventures Liquidation SLOW MARKET GROWTH STRONG COMPETITIVE POSITION
Grand Strategy Matrix Quadrant I §Excellent strategic position §Concentration on current markets/products §Take risks aggressively when necessary
Grand Strategy Matrix Quadrant II §Evaluate present approach §How to improve competitiveness §Rapid market growth requires intensive strategy
Grand Strategy Matrix Quadrant III §Compete in slow-growth industries §Weak competitive position §Drastic changes quickly §Cost & asset reduction (retrenchment)
Grand Strategy Matrix Quadrant IV §Strong competitive position §Slow-growth industry §Diversification to more promising growth areas
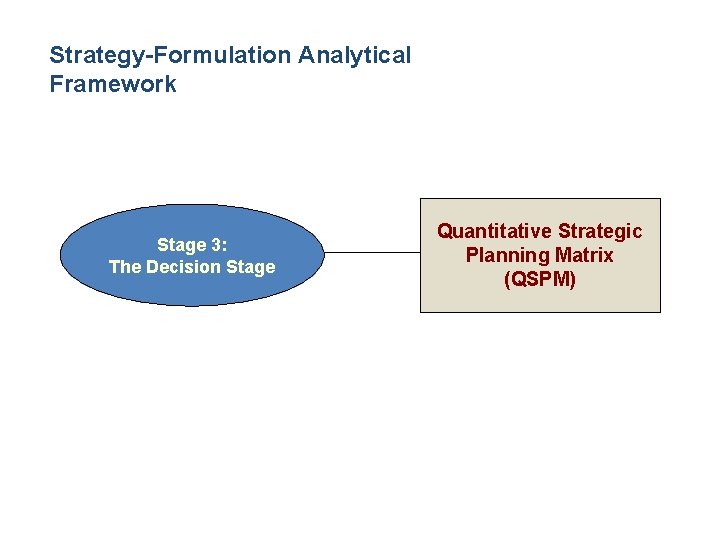
Strategy-Formulation Analytical Framework Stage 3: The Decision Stage Quantitative Strategic Planning Matrix (QSPM)
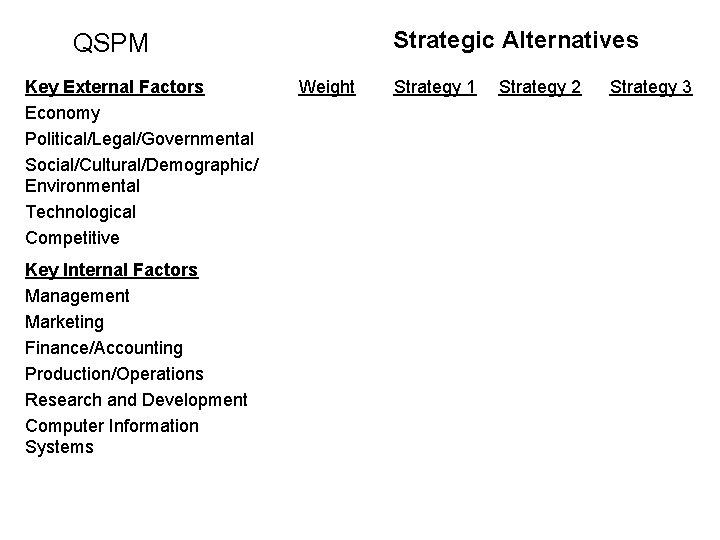
QASP Matrix • The Quantitative Strategic Planning Matrix is a strategic tool which is used to evaluate alternative set of strategies. • The QSPM incorporate earlier stage details in an organized way to calculate the score of multiple strategies in order to find the best matching strategy for the organization.
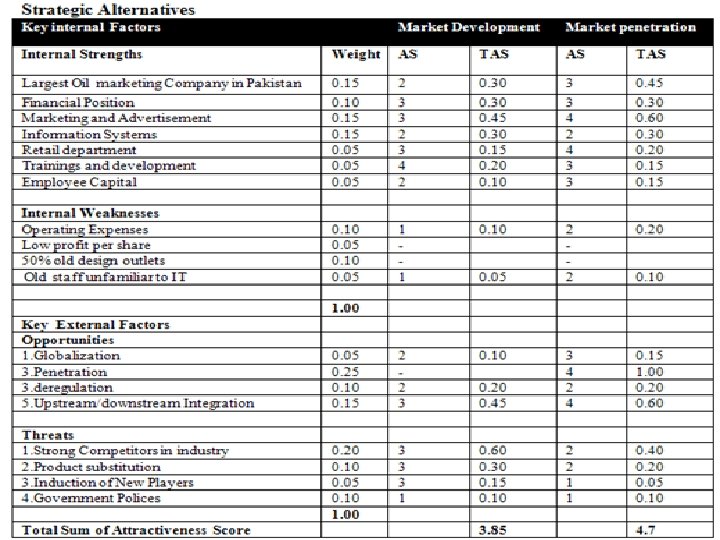
Format of Quantitative Strategic Planning Matrix • There are four main columns in QSPM, the left column list down the key internal and external key factors which are same as in EFE and IFE matrix. • Adjacent column to key factors is Weight (relative importance of the factor) which hold the numeric value obtained from EFE and IFE matrix weight column. • The next to weight is AS stands for attractive score assign priority to key factors using the numeric value 4 for most importance and 1 for least importance and the last column Total attractive score, is the value calculated by multiplying weight by attractive score • One thing important to note for each strategy separate AS and TAS value added in the table, weight remain same for all set of strategies mentioned in QSPM. • The topmost shows the strategies are compared in the QSPM matrix, below mentioned table illustrate the structure of QSPM matrix.
Strategic Alternatives QSPM Key External Factors Economy Political/Legal/Governmental Social/Cultural/Demographic/ Environmental Technological Competitive Key Internal Factors Management Marketing Finance/Accounting Production/Operations Research and Development Computer Information Systems Weight Strategy 1 Strategy 2 Strategy 3
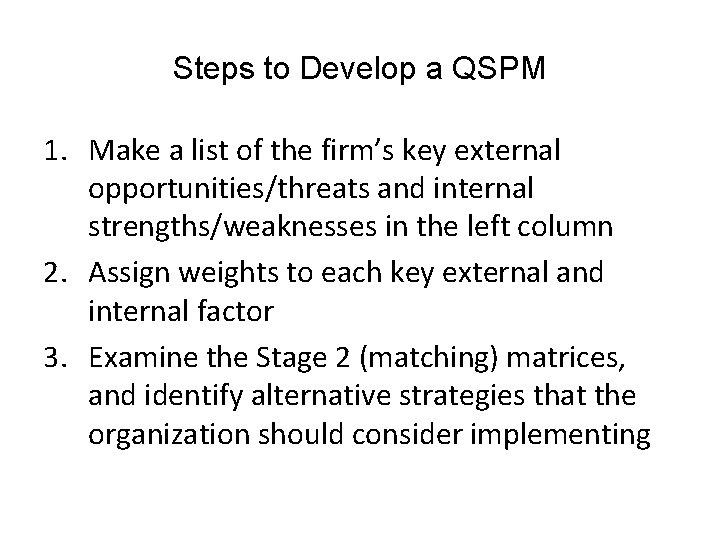
Steps to Develop a QSPM 1. Make a list of the firm’s key external opportunities/threats and internal strengths/weaknesses in the left column 2. Assign weights to each key external and internal factor 3. Examine the Stage 2 (matching) matrices, and identify alternative strategies that the organization should consider implementing
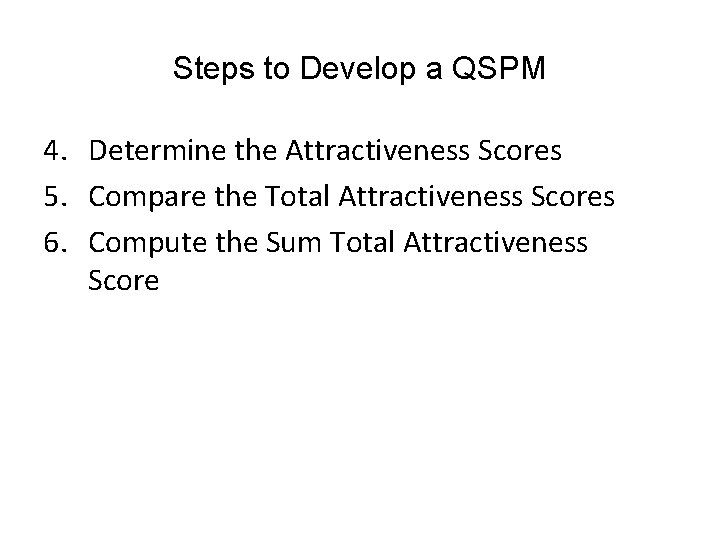
Steps to Develop a QSPM 4. Determine the Attractiveness Scores 5. Compare the Total Attractiveness Scores 6. Compute the Sum Total Attractiveness Score