Strategies for the verification of ensemble weather element

Strategies for the verification of ensemble weather element forecasts Laurence J. Wilson Meteorological Service of Canada Montreal, Quebec

Outline • The ensemble verification problem – Attributes applied to the ensemble distribution • Verification of the ensemble distribution – RPS and CRPS – Wilson 1999 – Rank Histogram • Verification of individual ensemble members • Verification of probability forecasts from the ensemble – Reliability tables – The ROC

Verification of the ensemble • Problem: – how to compare a distribution with an observation • The concept of “consistency”: – For each possible probability distribution f, the a posteriori verifying observations are distributed according to f in those circumstances when the system predicts the distribution f. (Talagrand) – similar to reliability – What is a perfect forecast? • The concept of “non-triviality” – the eps must predict different distributions at different times
 –")
Verification of approximations to the eps distribution • The Rank probability score (RPS) – discrete form, choose categories; samples distribution according to categories • Continuous RPS

CRPS example

Strategy for ensemble verification

Probability scoring method for ensembles of deterministic forecasts Score: Probability of getting observed value given the ensemble distribution • Fit distribution of same type as climatology – Normal for temperature, upper air variables – Gamma for precipitation – Gamma or Weibull for wind • Must choose window for “correct” forecast Skill score: Usual format, apply score to climatological distribution for the date


Ensemble verification - 500 mb

Ensemble verification - 500 mb

Comments on “Wilson” score • Sensitive both to “nearness” of the ensemble mean and to ensemble spread • Verifies the distribution only in the vicinity of the observation; variations outside the window have no impact • Believed to be strictly proper - shown empirically • Related to Brier Score for a single forecast • Can account forecast “difficulty” by choosing window based on climatological variance
 • Preparation – order the members of the ensemble from")
Rank Histogram (Talagrand Diagram) • Preparation – order the members of the ensemble from lowest to highest - identifies n+1 ranges including the two extremes – identify the location of the observation, tally over a large number of cases • Interpretation – Flat indicates ensemble spread about right to represent uncertainty – U-shaped - ensemble spread too small – dome-shaped - ensemble spread too large – assymetric - over- or under-forecasting bias – This is NOT a true verification measure
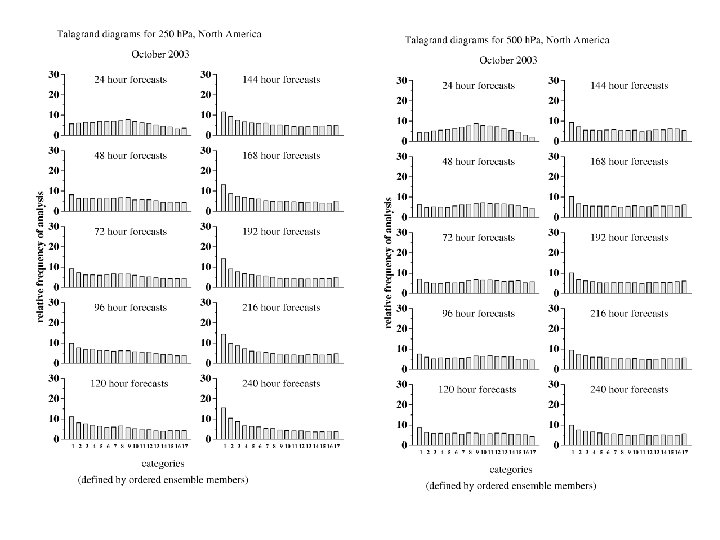

Rank Histogram

Verification of individual members • Preferred for comparison with operational model than verification of ensemble mean • Unperturbed control – compare with full resolution model • Best and worst member – a “posteriori” verification - less use to forecasters – select over a forecast range or individually at each range • Methods – all that apply to continuous fields: RMSE, MAE, bias, anomaly correlation etc. – preferable to verify against data than analysis.
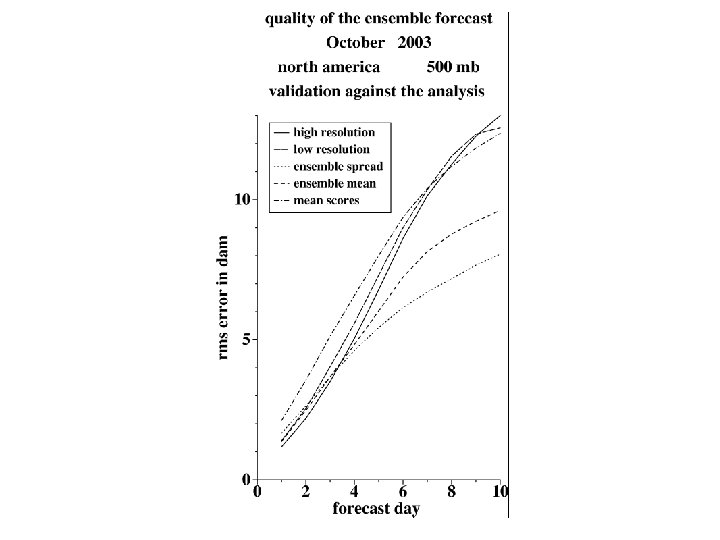

The Ensemble mean • Popular, because scores well with quadratic rules • Should NOT be compared to individual outcomes: – different sampling distribution – not a trajectory of the model

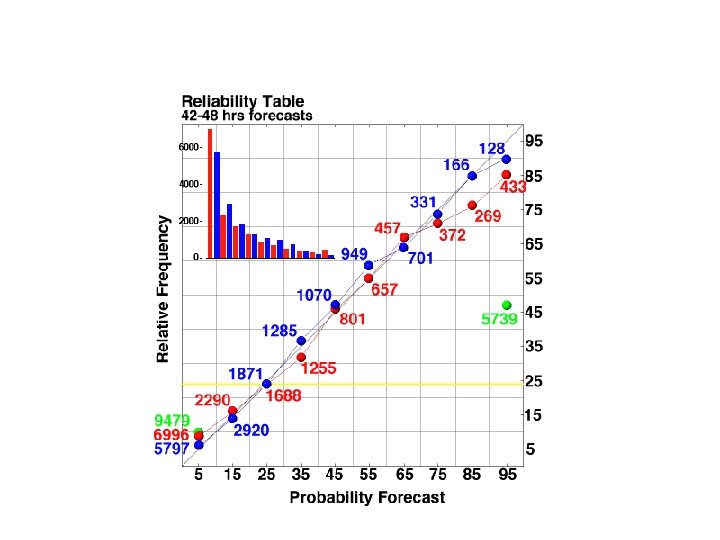
Verification of probability forecasts from the Ensemble • Same as verification of any probability forecasts • Reliability Table (with unconditional distribution of forecasts) + ROC (with likelihood diagram) sufficient for complete diagnostic verification • Reliability table: Distribution conditioned by fcst • ROC: Distribution conditioned by obs. • Attributes: • • reliability sharpness resolution discrimination
")
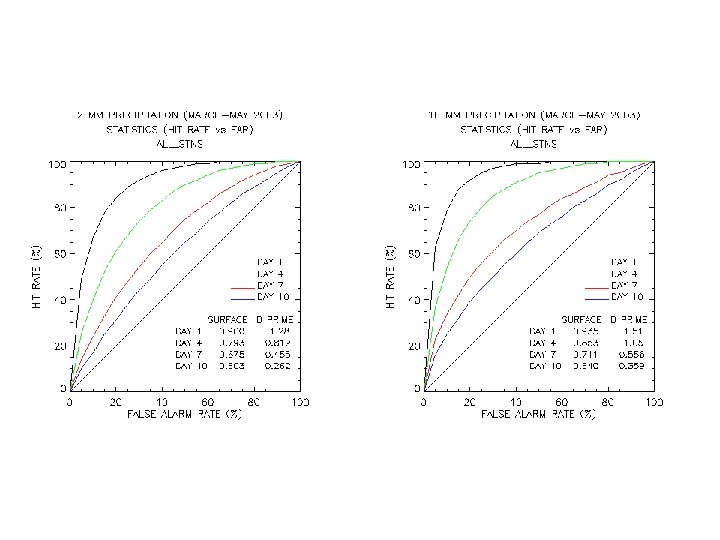
ROC - ECMWF Ensemble Forecasts Temperature 850 mb anomaly <-4 C (vs. analysis)

ROC Issues • Empirical vs. fitted • No. points needed to define the ROC • ROC and value (“potential value”)
")
ROC - threshold variation (Wilson, 2000)


Summary • Verification of the ensemble distribution - depends on how it is to be used by forecaster • Two aspects: verification of distribution vs. verification of probabilities from the distribution • Several measures shown, characteristics identified • Sufficiency of Reliability table and ROC graph for diagnostic verification of probability forecasts

Comprehensive EPS Verification • As probability distribution – Rank probability score – probability score and skill – Talagrand diagrams • Probabilities from the eps – Reliability tables and scores – ROC and scores – Summary scores • Brier Skill • Using fitted distributions to enhance estimates in tails
- Slides: 26