Strategic Support for Struggling Readers Through DataBased Decision

Strategic Support for Struggling Readers Through Data-Based Decision Making <Insert Presenters Names Here> Cohort 7 Middle Schools Fall 2011

Acknowledgements The material for this training day was developed with the efforts of… – – Melissa Nantais Soraya Coccimiglio Claire Mac. Arthur Margie Mc. Glinchey - Cathy Claes - Pam Jones - Steve Goodman Content was based on the work of… – Roland Good, University of Oregon; Dynamic Measurement Group – Ruth Kaminski, Dynamic Measurement Group – Alisa Dorman, Dynamic Measurement Group – Stephanie Stollar, Dynamic Measurement Group – Joe Torgesen, Florida Center for Reading Research – Amelia Van-Name Larson, Pasco County, Florida – Dawn Miller, Shawnee Mission School District, Kansas

1 Objectives – Deepen understanding of the connections between reading and behavior – Expand systems for Strategic Interventions particularly for literacy. – Utilize Progress Monitoring & Data-Based Decision Making to drive instruction and improve student outcomes – Increase School Improvement and MTSS alignment

Celebrations! What’s going well?

Who will do what? Facilitation of Today’s Work ✔ Note Taker ✔ Facilitator for discussions ✔ Timekeeper ALL: What are the big ideas we need to bring back to our whole staff?

Designing School-Wide Support Systems for Student Success Academic Systems Behavioral Systems Intensive, Individual Interventions • Individual Students • Assessment-based • High Intensity Strategic Group Interventions • Some students (at-risk) • High efficiency • Rapid response Universal Interventions • All students • Preventive, proactive 1 -5% 5 -10% 80 -90% Intensive, Individual Interventions • Individual Students • Assessment-based • Intense, durable procedures 1 -5% 5 -10% 80 -90% Strategic Group Interventions • Some students (at-risk) • High efficiency • Rapid response Universal Interventions • All settings, all students • Preventive, proactive

Quote Corners Read through the quotes about reading instruction in your participant workbook and decide which is most powerful for you. Move to the corner that matches your identified quote. Share your perspectives with one other person in your corner.

Meeting Inventory 1. Are you currently meeting regularly to discuss literacy data in your building, either by grade level, or by grade span? 2. How do you currently apply results of your data analysis to instructional planning? to assessment planning? 3. Is there another meeting schedule you already have into which you could incorporate SMARTI literacy data, maybe a SIT or a PLC? 4. If you choose to keep the meetings separate, what feedback loop is in place to be sure the results of all analyses are shared? 5. Do you have a common agenda you use at each meeting to ensure productivity resulting in student gains?

2. 0 Start with the Core Cohort 7 Middle Schools Fall 2011

Instruction for Struggling Readers 1. Whatever instruction they have had in the past has not been strong enough to help them meet grade-level expectations in reading; 2. They have probably not been doing very much reading for some time, and are likely to be very discouraged about being able to read well; and 3. They are a very diverse group who struggle to meet grade-level standards in reading for many different reasons. (Torgesen, Houston, & Rissman, 2007)

Research-Based Instructional Strategies For Improving ALL Students’ Reading Skills • • • Comprehension strategies Discussion High Standards Reading-Writing Connection Motivation and Engagement Content Learning (Torgesen, Houston, & Rissman, 2007)

CCSS addresses the need for “shared responsibility for students’ literacy development” across all content areas. (CCSS p. 4)

Content Literacy Strategies “Approximately 8. 7 million fourth through 12 th grade students struggle with the reading and writing tasks that are required of them in school. ” (Kamil, 2003) “to address this problem, all educators, including content-area teachers, need information about how to incorporate effective literacy learning strategies into the content-area curriculum. ” (National Institute for Literacy, 2007)

Comprehension Successful Readers Continuously monitor reading for understanding. Struggling Readers Fail to use meta-cognitive strategies as they read. May not be aware when understanding breaks down. Link content with their prior knowledge. May lack subject-specific prior knowledge. Do not readily make connections between what they are learning and what they already know. Use a variety of effective reading strategies before, during, and after reading. Have limited knowledge and use of strategies for gaining information from text. Set a purpose for reading and adjust their rate and strategy use depending on the text and content. Often do not enjoy reading and lack understanding of the utility of reading. (Boardman et al. , 2008. Adapted from Denton et al. , 2007; Pressley, 2006. )

Comprehension is the ultimate purpose of reading.

Comprehension is the ability to construct meaning and learn from text using a variety of applied strategies.

To teach students to construct meaning from text, teachers need a firm grasp of – Strategies that successful readers use when creating meaning from text; and – Effective instructional methods to teach successful strategies (National Reading Panel, 2000).

Reading Apprenticeship: Overview, Rationale, and Reminders

Text and Task Analysis • • • Take three minutes and talk to the text Questions on four columns? Practice – whole group Practice – small group Practice – individual (if time)

4. 0 Establishing Systems for Strategic Intervention Cohort 7 Middle Schools Fall 2011

Why Can’t We Just Learn About Different Interventions? “Keeping Rt. I On Track” Focus on Intervention Management, not Intervention Selection

50 -55 “This guide offers specific recommendations to help educators identify students in need of intervention and implement evidencebased interventions to promote their reading achievement. ” (Gersten, et al. , 2008)

50 -55 Activity Jigsaw Reading Work with a partner at your table. Read the assigned portion of Recommendation 3 in the IES Practice Guide. After reading, share the “Big Ideas” with your partner.

50 -55 Activity Jigsaw Reading Partner 1 Reads: “Recommendation 3…” to “Implement this Program…” Partner 2 Reads: “Implement this Program…” to the end When directed, Partner 1 shares “Big Ideas” with Partner 2 and then Partner 2 shares with Partner 1.

Some important questions for reflection If large numbers of your students continue to struggle to make expected yearly growth, have you considered increasing the length of the reading block? Do students who struggle receive time for intervention instruction that is proportional to their difficulties? Do some students receive as much as 60 -90 minutes of intervention every day?

“Catch-up growth is driven primarily by proportional increases in direct instructional time. Catch-up growth is so difficult to achieve that it can be the product only of quality instruction in great quantity. ” Annual growth for all students, Catch-Up growth for those who are behind” Fielding, Kerr & Rosier (2007) New Foundation Press.

Teacher quality x time = growth “This is why the primary and immediate strategy for catch-up growth is proportional increase in direct instructional time. Catch-up growth rarely occurs unless principals and teachers have good data, know each student’s learning needs, and schedule proportional increases in direct instructional time. ” Annual growth for all students, Catch-Up growth for those who are behind” Fielding, Kerr & Rosier (2007) New Foundation Press

Activity Jigsaw Reading Working in groups of three at your table, read the assigned portion of article, “The Devil is in the Details: The Logistics of Tier 2 Interventions. ” After reading, share the “Big Ideas” from each section of the article with your full team.

Additional resources for strategic interventions • Florida Center for Reading Research www. fcrr. org • Oregon Reading First oregonreadingfirst. uoregon. edu

Implementation Fidelity Without fidelity of implementation…teams will be unable to determine if a student failed to respond to a well-implemented intervention or failed to respond because the intervention was implemented inaccurately or inconsistently. (Cook et al. , 2010)

LUNCH

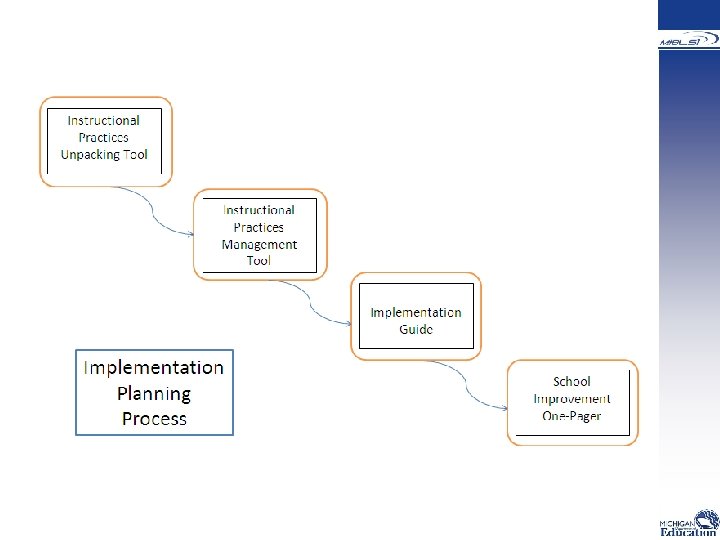
School Improvement Alignment • Tiered goals: two types 1. Same strategy, three tiers 2. Three tiers, different strategies • Sample goal (type 2)

5. 0 Progress Monitoring & Data-Based Decision Making Cohort 7 Elementary Schools Fall 2011

Progress monitoring is… • a scientifically based practice • used to assess students’ academic performance • Used to evaluate the effectiveness of instruction. Progress monitoring can be implemented with individual students or an entire class.

Using Universal Screening Data to Make Instructional Decisions The practice of providing high quality instruction and intervention matched to needs of students Using data over time to make important educational decisions Steps 1 & 2 Identify & Validate Need Strategic Fall Winter Spring Step 3 Steps 4 & 5 Plan Support Evaluate Support & Outcomes Individual Diagnostic Universal Screening/ Benchmark Intensive Core 1 -5% Instructional Grouping 5 -15% 80 -90% None Individualized Intensive & Continue With Core Weekly Small Group Differentiated by Skill & Continue 1 -2 x Per Month with Core Continue With Core Instruction Grades, Classroom Assessments, MEAP (adapted from Van-Name Larson, 2011 & DMG, 2011)

Plan Support • What do you need to know? – How will students be grouped for support? – What specific skills will you teach? – What curriculum and/or instructional program will you use? – What materials/strategies will you use? • What data can you use? – Scores & Percentiles Report (AIMSweb) – Individual protocols (look at error patterns) (adapted from DMG, 2011)

Plan Support • What do we mean by “instructional grouping? ” – Students are grouped according to specific needs for support (not based on instructional recommendation or composite score) – Instructional groups are dynamic and flexible • Why group students for instruction? – Instruction that groups students according to skills allows instruction focused on their needs – Grouping according to skills results in improved achievement (DMG, 2011)

Plan Support • How will students be grouped? – Students with the same status do not necessarily have the same instructional needs – Students with scores within the same range on a measure do not necessarily have the same instructional needs – You know more than a computer about your students – Some thinking is required! – If you use a supplemental program that has a placement test, use the placement test for instructional grouping. – Based on similar instructional needs (DMG, 2011)

Plan Support • Grouping Worksheets provide initial suggestions for instructional groups – Teachers will revise groupings based on other information about students’ skill levels, resources, behavior, etc. – Four groups formed initially based on: • Performance on two key indicators • Scores at or above versus below/well below benchmark or some/at risk (DMG, 2011)

Benefits of Progress Monitoring “Students whose teachers collect progress-monitoring data learn more than students whose teachers do not collect these data. ” (Fuchs & Fuchs, 1986) “Teachers’ graphing of student data is associated with more student learning than is collecting but not graphing the data. ” (Hixson, Christ, & Bradley-Johnson, 2008) “Students whose teachers use data-based decision rules learn more than students whose teachers rely on their own judgment for making decisions about students performance. ” (Hixson, Christ, & Bradley-Johnson, 2008)

Progress Monitoring as an Intervention “The most powerful single modification that enhances achievement is feedback. The simplest prescription for improving education must be ‘dollops of feedback’” (Hattie, 1992)

Progress Monitoring Minimal Expectation Instructional Recommendation Progress Monitoring Frequency Benchmark/ Core Support Strategic Support 3 times/year (Sep. , Jan. , May) Monthly Intensive Support Weekly

Steps for Implementing Progress Monitoring • Identify Students who will be progress monitored and which indicator(s) will be used • Conduct frequent progress monitoring probes (1 x/month for strategic, 1 x/ week for intensive) • Set a goal for the student • Chart student progress on graph with aim line and goal • Review progress frequently • Make instructional decisions based on student performance data

Key Components to a Graph • Baseline Data: data collected prior to any intervention • Phase Line: vertical line indicating an instructional/intervention change was made • Goal Line: identifies the goal • Aim Line: diagonal line that represents the progress a student needs to make to meet his/her goal • Intervention Data: data collected after the introduction or modification of an intervention

Phase Line Goal Line Aim Line Intervention Data Points Baseline Data Point

Progress-Monitoring: Data-Based Decision Making • Number of Baseline Data Points – Gold Standard: At least 3 data points – Acceptable Alternative: 1 data point • Number of Intervention Data Points – Gold Standard: At least 3 -4 data points – Acceptable Alternative: At least 2 -3 data points

Progress-Monitoring: Decision Rules • If 2 or 3 of the last data points fall at or above the aim line consider raising the goal or fading the intervention. • If 2 or 3 of the last data points are on the aim line, continue the intervention. • If 2 or 3 of the last data points are below the aim line, modify the intervention.

Progress-Monitoring: Decision Rules If you are monitoring progress monthly does this mean that you wait 2 -3 months before making a change? NO! If a student’s progress is being monitored monthly and a data point falls below the aim line, switch to weekly progress monitoring so that you have enough data to make a sound instructional decision in a reasonable amount of time.
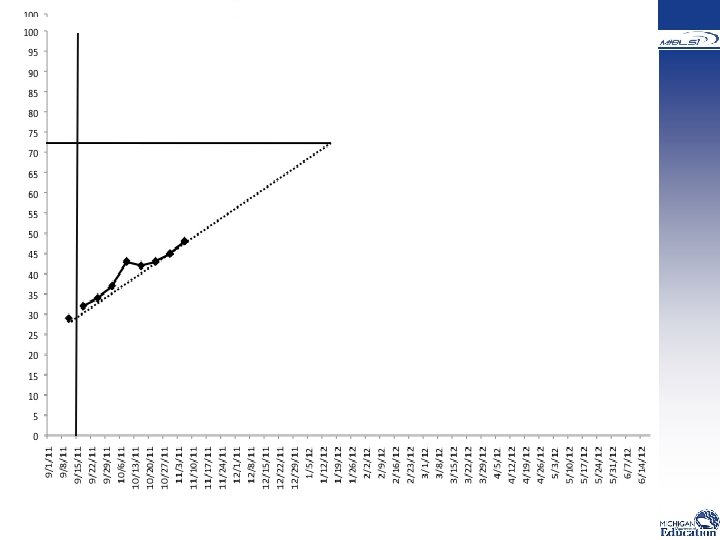

Chart Student Progress

Progress-Monitoring Using AIMSweb Directions for setting up Progress Monitoring in AIMSweb are available on the Mi. BLSi website at http: //miblsi. cenmi. org

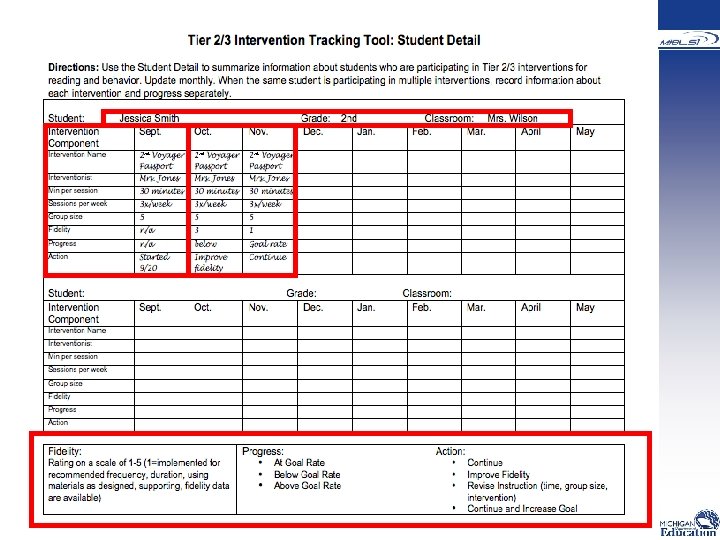
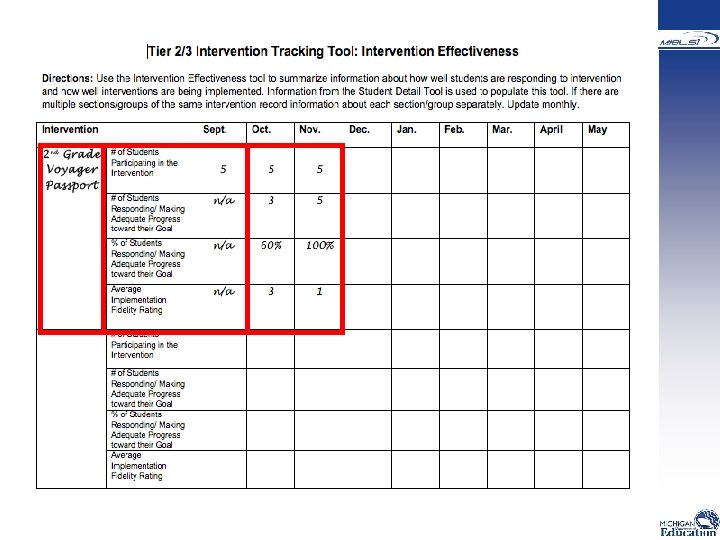
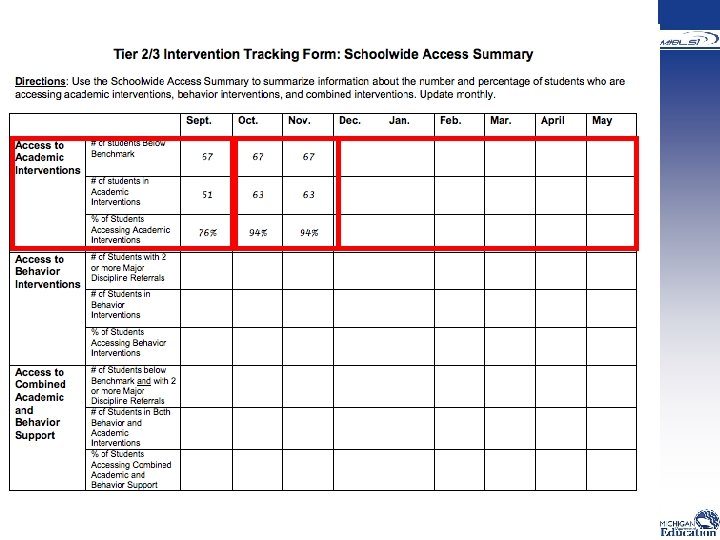
Tier Two/Tier Three Intervention Tracking Forms • Student Detail • Intervention Effectiveness • Schoolwide Access
- Slides: 56