
STRATEGIC ROADMAP Brian Economaki Gabriel Gaspar Harald Tolleshaug

STRATEGIC ROADMAP Brian Economaki Gabriel Gaspar Harald Tolleshaug Tran Thi Thu Huong 1
Presentation Agenda A. Perspectives 1. ITO and BPO Industry size across the globe 2. The Evolution of BPO solutions B. Growth 1. v. Customer 2. Shaping the new Strategy 3. Going International C. Plan 1. Implementation Roadmap 2. Financial Status 2

[ perspectives ] The competitive Landscape 3
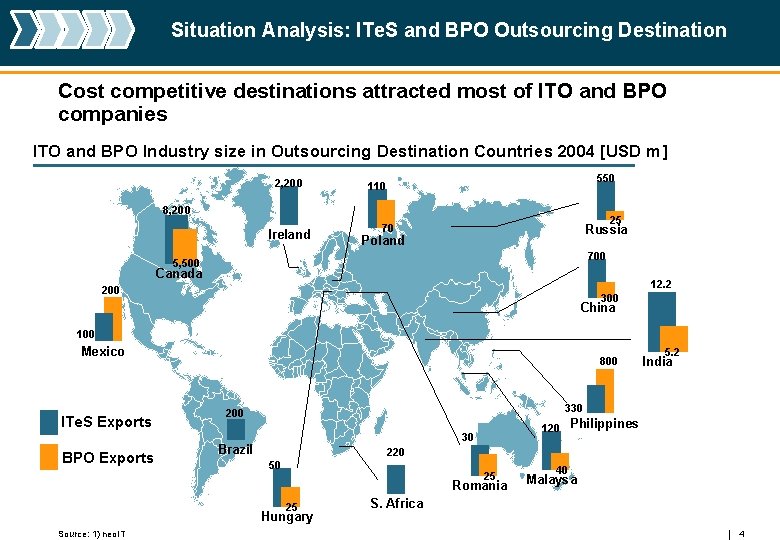
Situation Analysis: ITe. S and BPO Outsourcing Destination Cost competitive destinations attracted most of ITO and BPO companies ITO and BPO Industry size in Outsourcing Destination Countries 2004 [USD m] 2, 200 550 110 8, 200 Ireland 25 Russia 70 Poland 700 5, 500 Canada 12. 2 200 300 China 100 Mexico ITe. S Exports BPO Exports 800 330 200 120 Philippines 30 Brazil 220 50 25 Romania 25 Hungary Source: 1) neo. IT 5. 2 India 40 Malaysa S. Africa 4
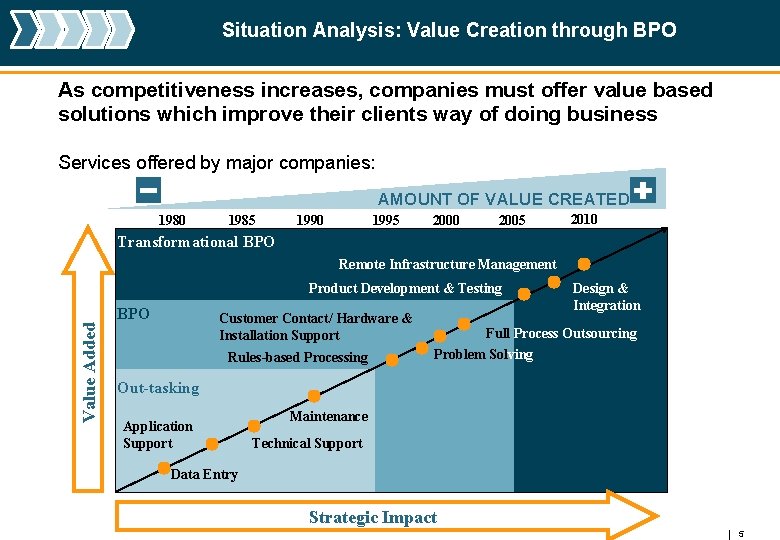
Situation Analysis: Value Creation through BPO As competitiveness increases, companies must offer value based solutions which improve their clients way of doing business Services offered by major companies: AMOUNT OF VALUE CREATED 1980 1985 1990 1995 2000 2005 2010 Transformational BPO Remote Infrastructure Management Value Added Product Development & Testing BPO Customer Contact/ Hardware & Installation Support Rules-based Processing Design & Integration Full Process Outsourcing Problem Solving Out-tasking Application Support Maintenance Technical Support Data Entry Strategic Impact 5
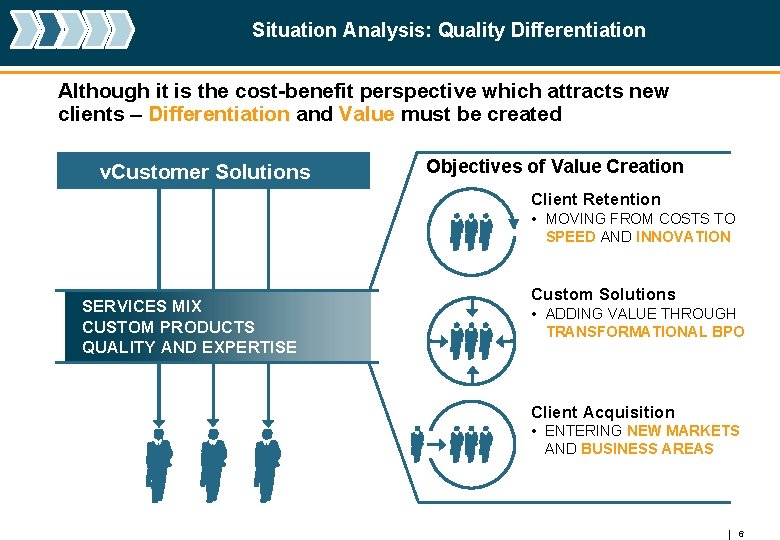
Situation Analysis: Quality Differentiation Although it is the cost-benefit perspective which attracts new clients – Differentiation and Value must be created v. Customer Solutions Objectives of Value Creation Client Retention • MOVING FROM COSTS TO SPEED AND INNOVATION SERVICES MIX CUSTOM PRODUCTS QUALITY AND EXPERTISE Custom Solutions • ADDING VALUE THROUGH TRANSFORMATIONAL BPO Client Acquisition • ENTERING NEW MARKETS AND BUSINESS AREAS 6

[ growth ] Geographical Expansion 7
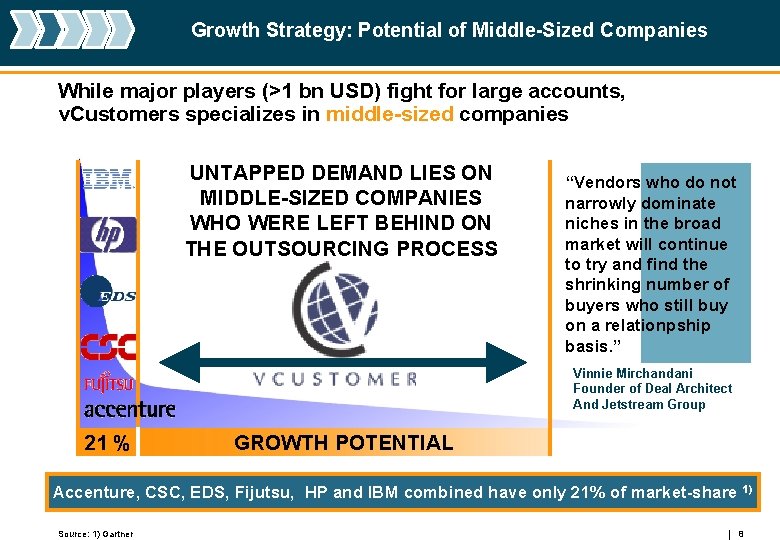
Growth Strategy: Potential of Middle-Sized Companies While major players (>1 bn USD) fight for large accounts, v. Customers specializes in middle-sized companies UNTAPPED DEMAND LIES ON MIDDLE-SIZED COMPANIES WHO WERE LEFT BEHIND ON THE OUTSOURCING PROCESS “Vendors who do not narrowly dominate niches in the broad market will continue to try and find the shrinking number of buyers who still buy on a relationpship basis. ” Vinnie Mirchandani Founder of Deal Architect And Jetstream Group 21 % GROWTH POTENTIAL Accenture, CSC, EDS, Fijutsu, HP and IBM combined have only 21% of market-share 1) Source: 1) Gartner 8
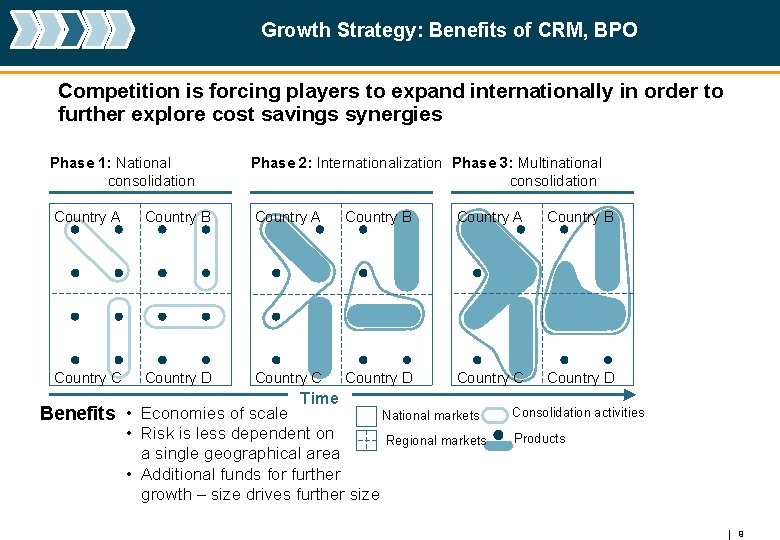
Growth Strategy: Benefits of CRM, BPO Competition is forcing players to expand internationally in order to further explore cost savings synergies Phase 1: National consolidation Country A Country B Phase 2: Internationalization Phase 3: Multinational consolidation Country A Country B Country C Country D Country C Time • Economies of scale National markets Benefits • Risk is less dependent on Regional markets a single geographical area • Additional funds for further growth – size drives further size Country D Consolidation activities Products 9
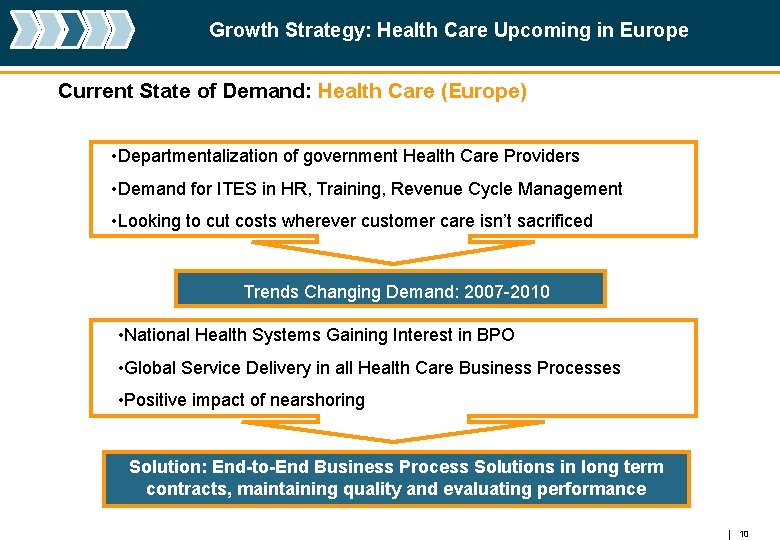
Growth Strategy: Health Care Upcoming in Europe Current State of Demand: Health Care (Europe) • Departmentalization of government Health Care Providers • Demand for ITES in HR, Training, Revenue Cycle Management • Looking to cut costs wherever customer care isn’t sacrificed Trends Changing Demand: 2007 -2010 • National Health Systems Gaining Interest in BPO • Global Service Delivery in all Health Care Business Processes • Positive impact of nearshoring Solution: End-to-End Business Process Solutions in long term contracts, maintaining quality and evaluating performance 10
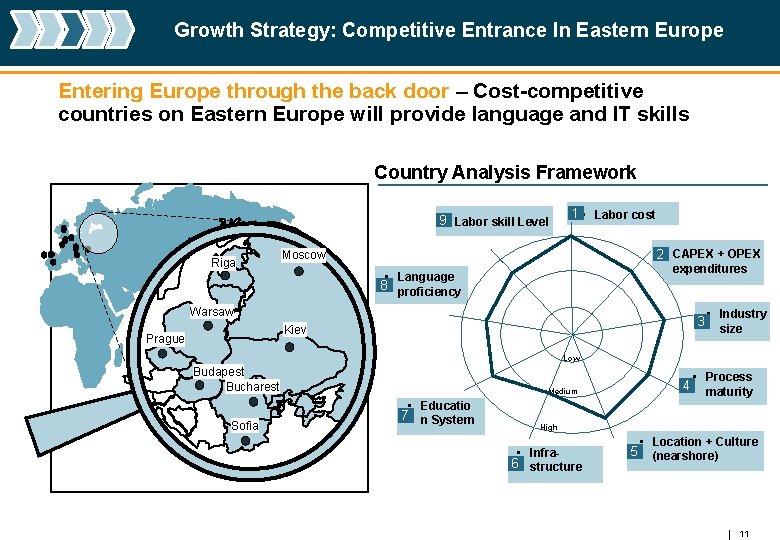
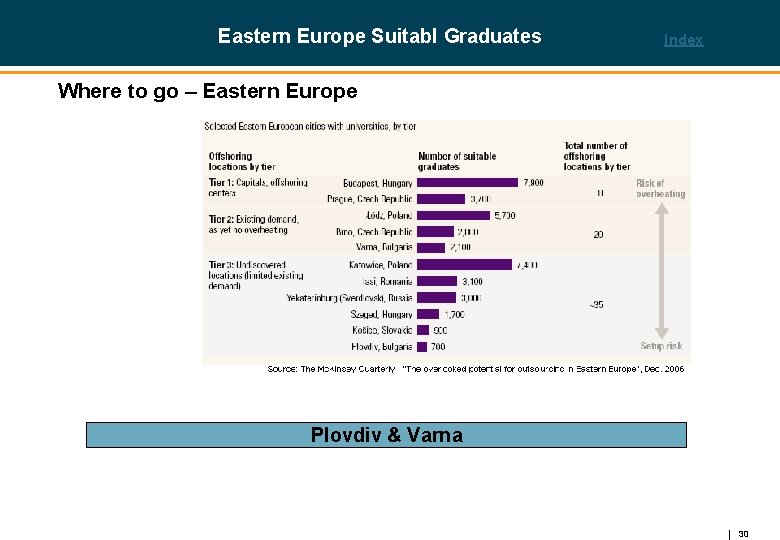
Growth Strategy: Competitive Entrance In Eastern Europe Entering Europe through the back door – Cost-competitive countries on Eastern Europe will provide language and IT skills Country Analysis Framework 9 • Labor skill Level Riga 1 • Labor cost 2 • CAPEX + OPEX Moscow expenditures • Language 8 proficiency Warsaw 3 Kiev Prague • Industry size Low Budapest Bucharest Sofia 4 Medium • Educatio 7 n System • Process maturity High • Infra 6 structure 5 • Location + Culture (nearshore) 11
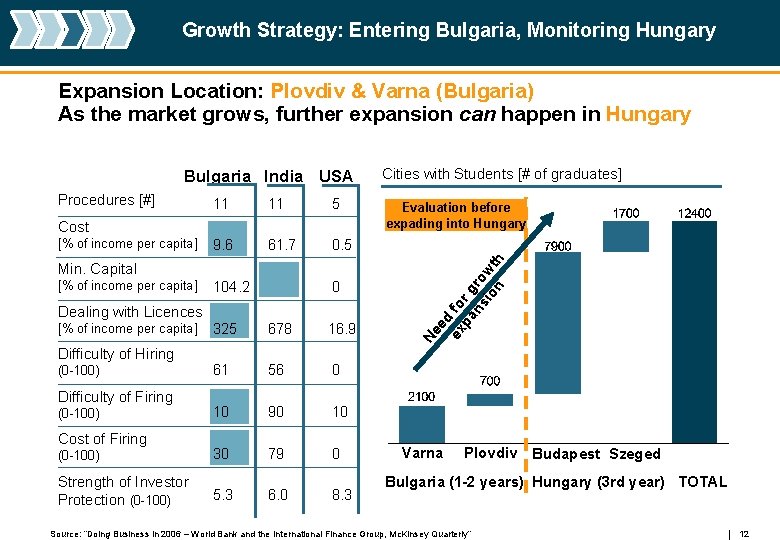
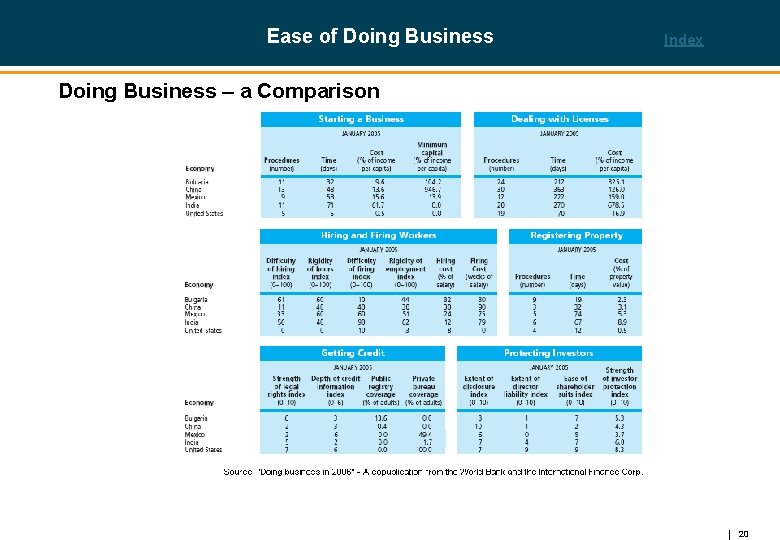
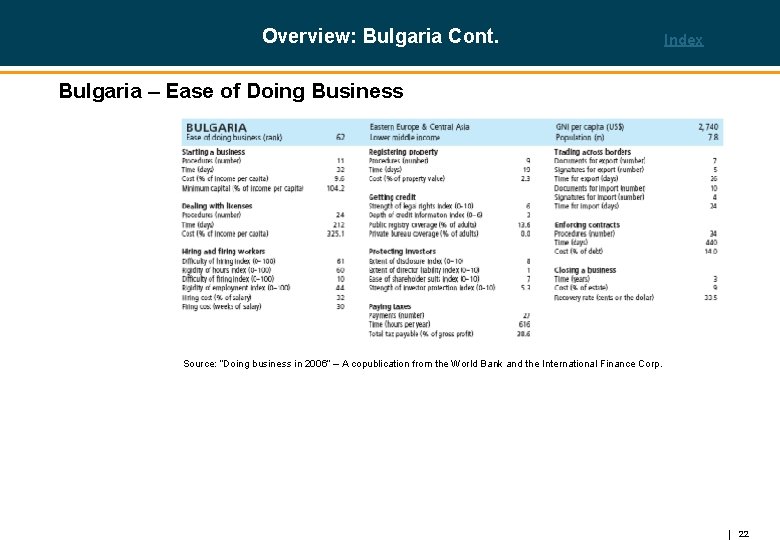
Growth Strategy: Entering Bulgaria, Monitoring Hungary Expansion Location: Plovdiv & Varna (Bulgaria) As the market grows, further expansion can happen in Hungary 11 11 5 9. 6 61. 7 0. 5 104. 2 0 0 325 678 16. 9 61 56 0 10 90 10 30 79 0 Cost [% of income per capita] Min. Capital [% of income per capita] Dealing with Licences [% of income per capita] Difficulty of Hiring (0 -100) Difficulty of Firing (0 -100) Cost of Firing (0 -100) Strength of Investor Protection (0 -100) 5. 3 6. 0 8. 3 Evaluation before expading into Hungary ed ex fo pa r g ns ro io wt n h Procedures [#] Cities with Students [# of graduates] Ne Bulgaria India USA Varna Plovdiv Budapest Szeged Bulgaria (1 -2 years) Hungary (3 rd year) TOTAL Source: “Doing Business in 2006 – World Bank and the International Finance Group, Mc. Kinsey Quarterly” 12
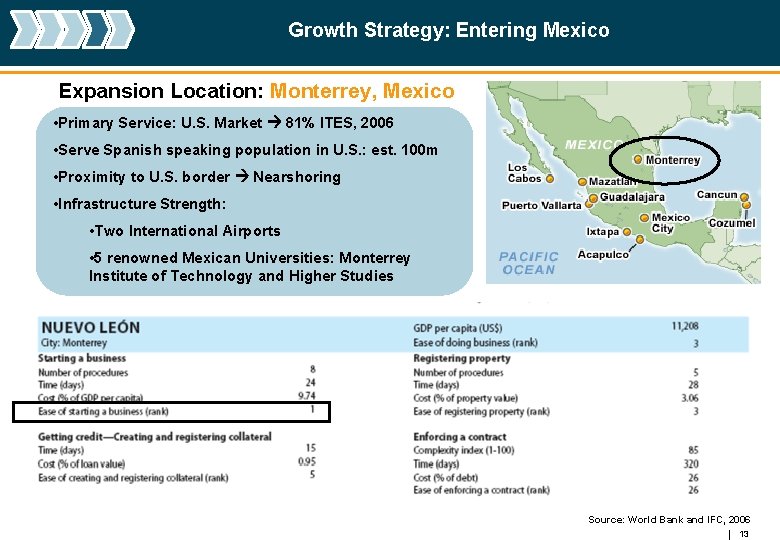
Growth Strategy: Entering Mexico Expansion Location: Monterrey, Mexico • Primary Service: U. S. Market 81% ITES, 2006 • Serve Spanish speaking population in U. S. : est. 100 m • Proximity to U. S. border Nearshoring • Infrastructure Strength: • Two International Airports • 5 renowned Mexican Universities: Monterrey Institute of Technology and Higher Studies Source: World Bank and IFC, 2006 13
[ plan ] Implementation Roadmap 14
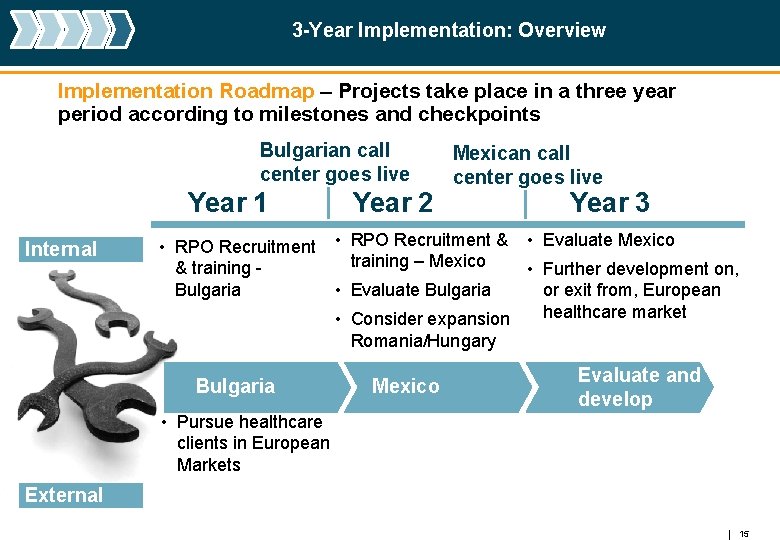
3 -Year Implementation: Overview Implementation Roadmap – Projects take place in a three year period according to milestones and checkpoints Bulgarian call center goes live Year 1 Internal Year 2 Mexican call center goes live Year 3 • RPO Recruitment & • Evaluate Mexico training – Mexico & training - • Further development on, Bulgaria • Evaluate Bulgaria or exit from, European • Consider expansion healthcare market Romania/Hungary Bulgaria Mexico Evaluate and develop • Pursue healthcare clients in European Markets External 15
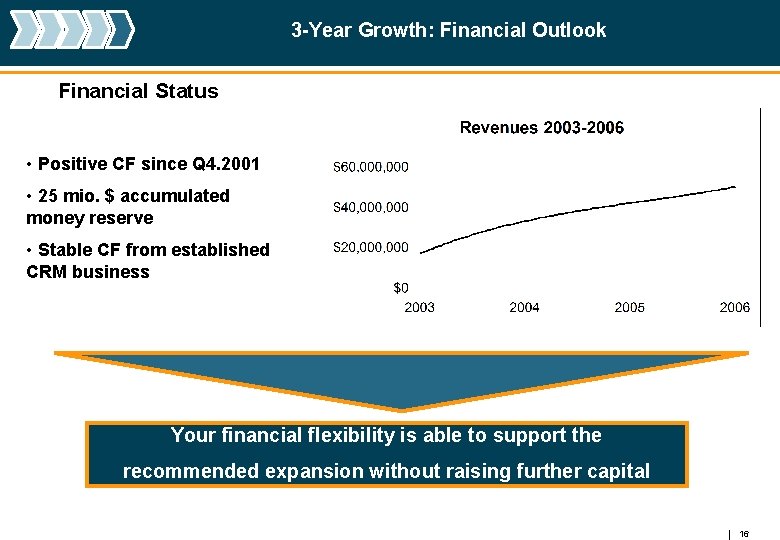
3 -Year Growth: Financial Outlook Financial Status • Positive CF since Q 4. 2001 • 25 mio. $ accumulated money reserve • Stable CF from established CRM business Your financial flexibility is able to support the recommended expansion without raising further capital 16
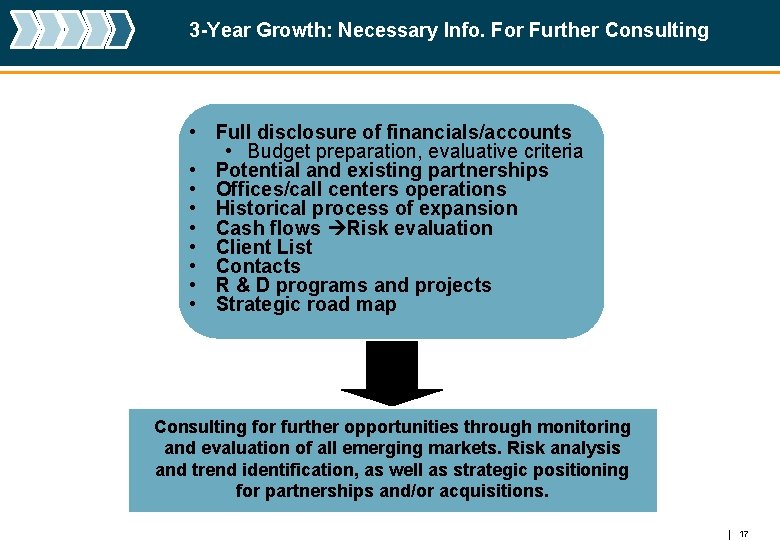
3 -Year Growth: Necessary Info. For Further Consulting • Full disclosure of financials/accounts • Budget preparation, evaluative criteria • Potential and existing partnerships • Offices/call centers operations • Historical process of expansion • Cash flows Risk evaluation • Client List • Contacts • R & D programs and projects • Strategic road map Consulting for further opportunities through monitoring and evaluation of all emerging markets. Risk analysis and trend identification, as well as strategic positioning for partnerships and/or acquisitions. 17
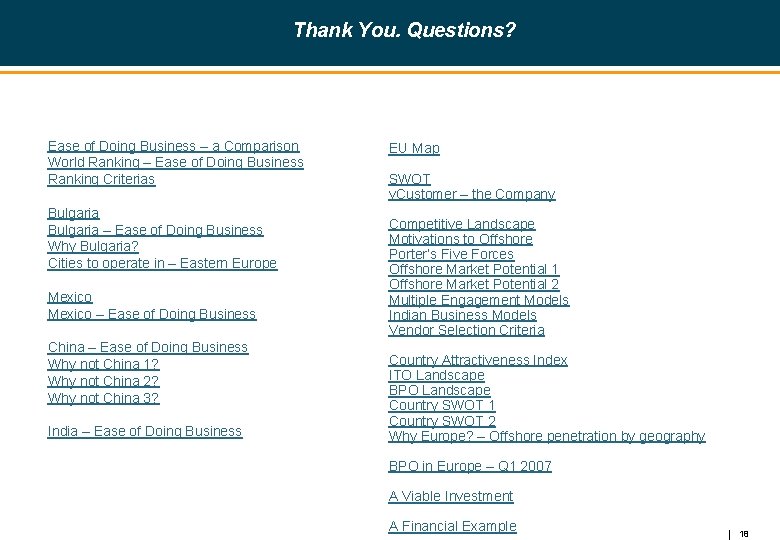
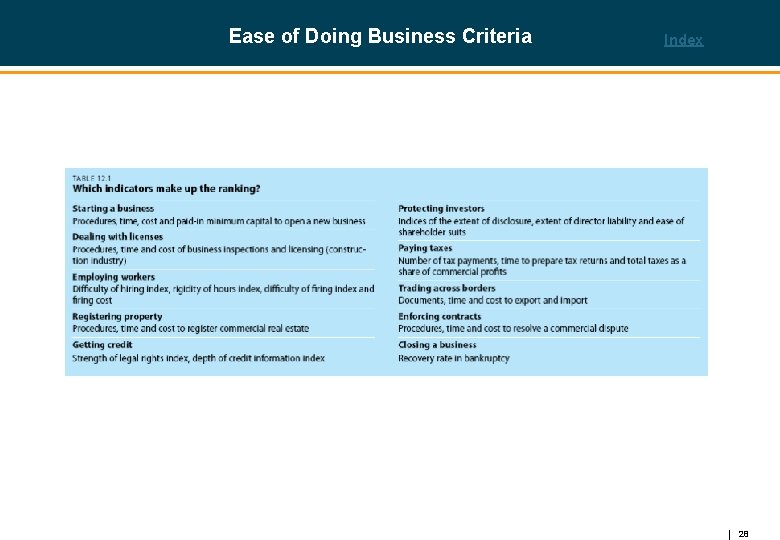
Thank You. Questions? Ease of Doing Business – a Comparison World Ranking – Ease of Doing Business Ranking Criterias Bulgaria – Ease of Doing Business Why Bulgaria? Cities to operate in – Eastern Europe Mexico – Ease of Doing Business China – Ease of Doing Business Why not China 1? Why not China 2? Why not China 3? India – Ease of Doing Business EU Map SWOT v. Customer – the Company Competitive Landscape Motivations to Offshore Porter’s Five Forces Offshore Market Potential 1 Offshore Market Potential 2 Multiple Engagement Models Indian Business Models Vendor Selection Criteria Country Attractiveness Index ITO Landscape BPO Landscape Country SWOT 1 Country SWOT 2 Why Europe? – Offshore penetration by geography BPO in Europe – Q 1 2007 A Viable Investment A Financial Example 18
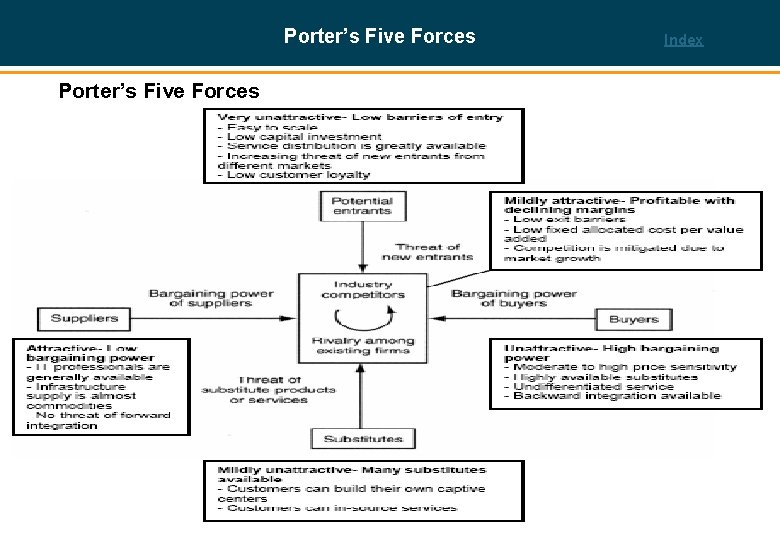
Porter’s Five Forces Index Porter’s Five Forces 19
Ease of Doing Business Index Doing Business – a Comparison 20
Overview: Bulgaria Index Bulgaria • member of the EU since 1. 1. 2007 • inflation rate of 6, 5% in 2006 • flat corporate income tax 15% (no other European country beats this) • established time limits on issuing licenses • ranks 62 on the World Bank’s ‘Ease of Doing Business Ranking’, China ranks 91, India ranks 116 and US ranks 3 Source: “Doing business in 2006” – A copublication from the World Bank and the International Finance Corp. , and “The World Factbook” - CIA 21
Overview: Bulgaria Cont. Index Bulgaria – Ease of Doing Business Source: “Doing business in 2006” – A copublication from the World Bank and the International Finance Corp. 22
Overview: Mexico Index Mexico • corporate income tax 30% • Inflation rate of 3. 4% in 2006 • ranks 73 on the World Bank’s ‘Ease of Doing Business Ranking’, China ranks 91, India ranks 116 and US ranks 3. • nearshore to the US Source: “Doing business in 2006” – A copublication from the World Bank and the International Finance Corp. , and “The World Factbook” - CIA 23
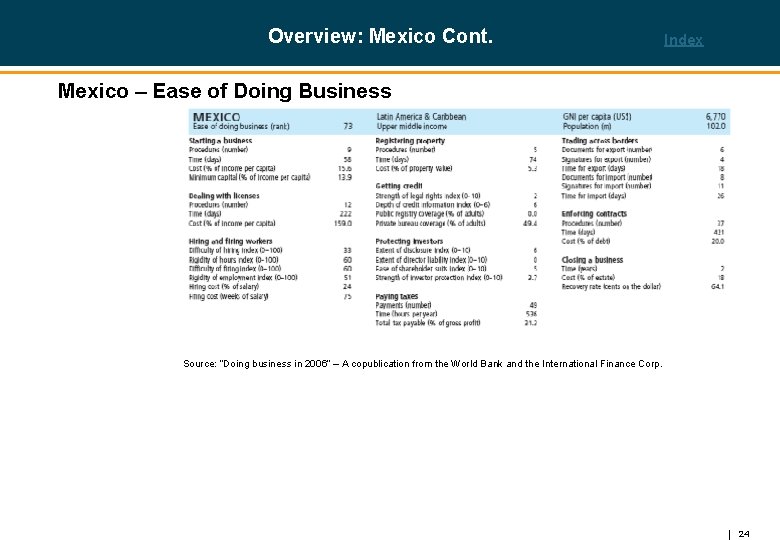
Overview: Mexico Cont. Index Mexico – Ease of Doing Business Source: “Doing business in 2006” – A copublication from the World Bank and the International Finance Corp. 24
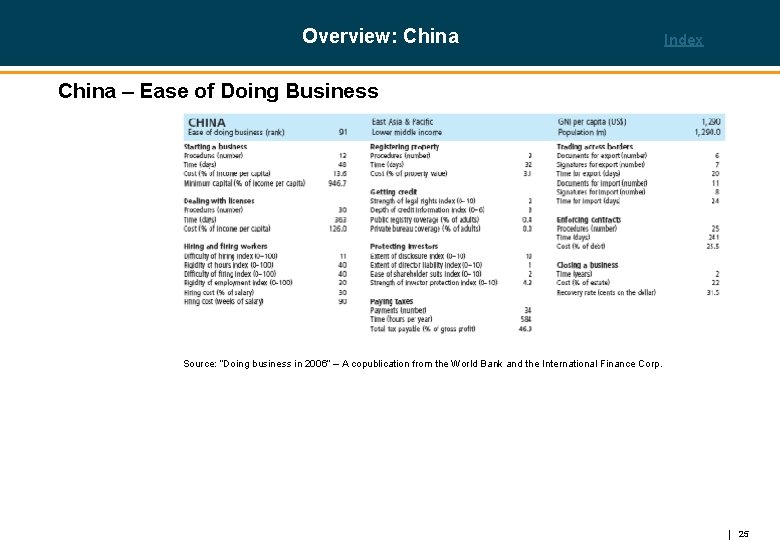
Overview: China Index China – Ease of Doing Business Source: “Doing business in 2006” – A copublication from the World Bank and the International Finance Corp. 25
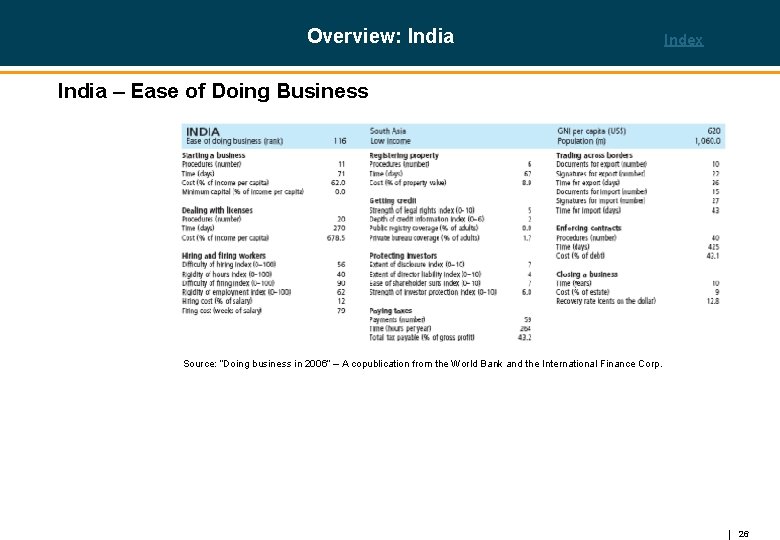
Overview: India Index India – Ease of Doing Business Source: “Doing business in 2006” – A copublication from the World Bank and the International Finance Corp. 26
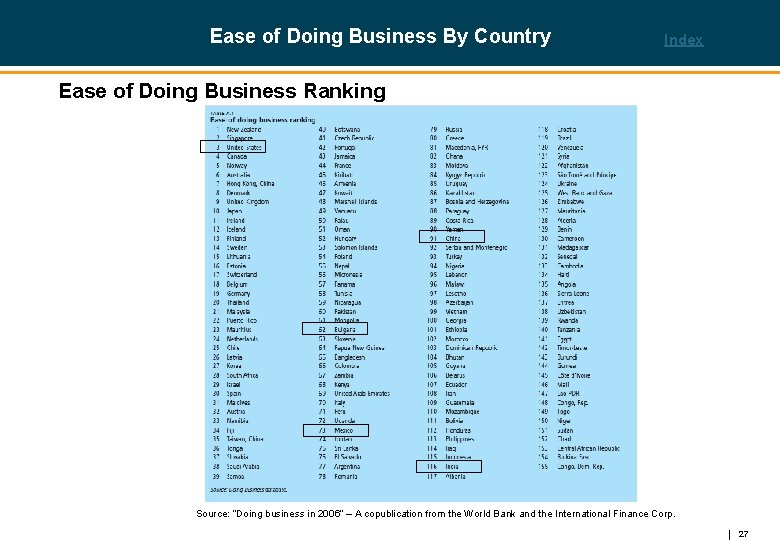
Ease of Doing Business By Country Index Ease of Doing Business Ranking Source: “Doing business in 2006” – A copublication from the World Bank and the International Finance Corp. 27
Ease of Doing Business Criteria Index 28
Map of EU Index 29
Eastern Europe Suitabl Graduates Index Where to go – Eastern Europe Plovdiv & Varna 30
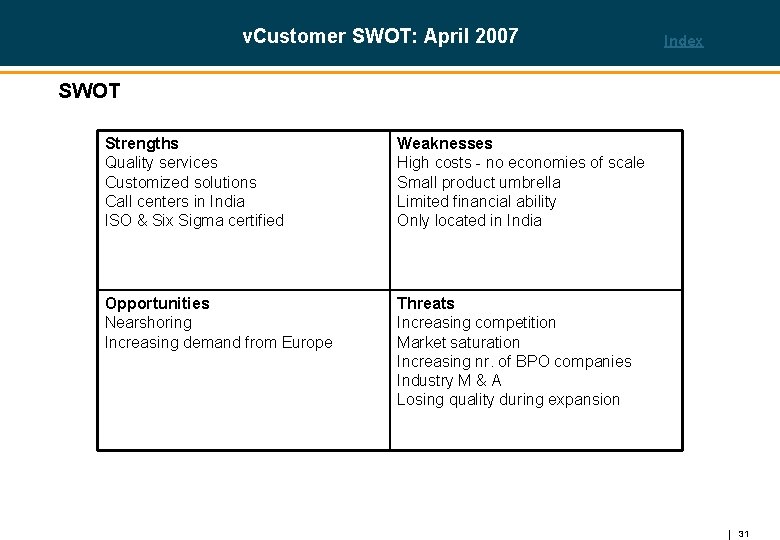
v. Customer SWOT: April 2007 Index SWOT Strengths Quality services Customized solutions Call centers in India ISO & Six Sigma certified Weaknesses High costs - no economies of scale Small product umbrella Limited financial ability Only located in India Opportunities Nearshoring Increasing demand from Europe Threats Increasing competition Market saturation Increasing nr. of BPO companies Industry M & A Losing quality during expansion 31
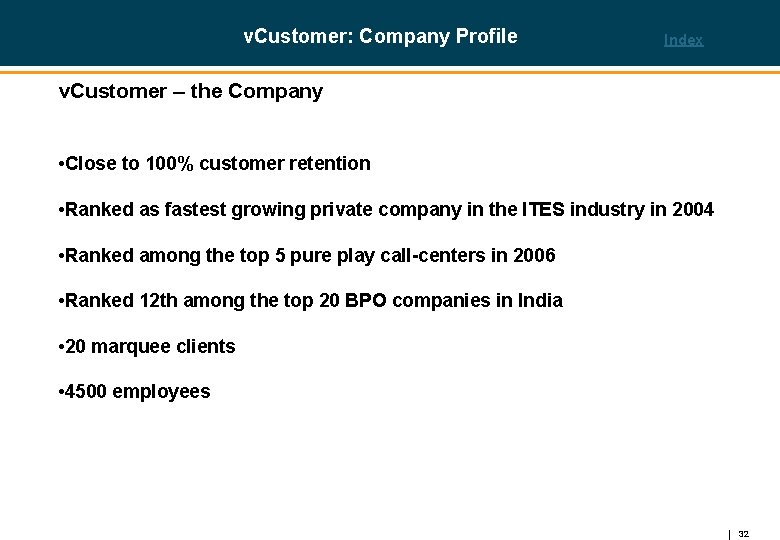
v. Customer: Company Profile Index v. Customer – the Company • Close to 100% customer retention • Ranked as fastest growing private company in the ITES industry in 2004 • Ranked among the top 5 pure play call-centers in 2006 • Ranked 12 th among the top 20 BPO companies in India • 20 marquee clients • 4500 employees 32
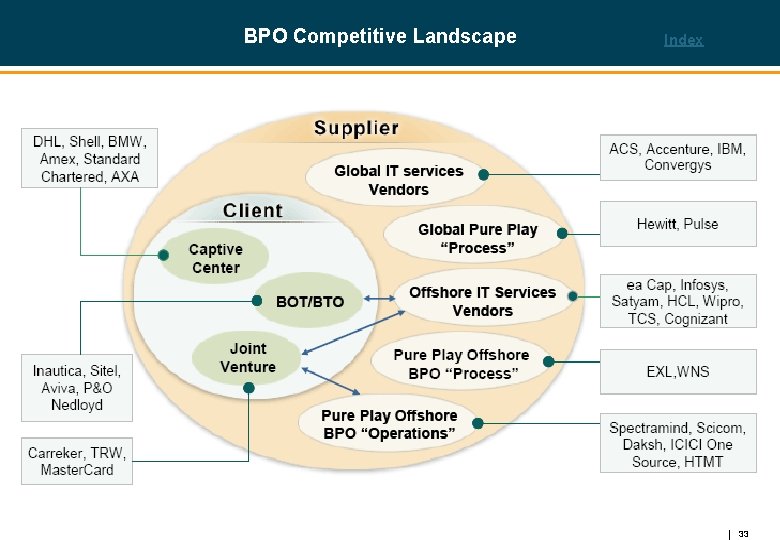
BPO Competitive Landscape Index 33
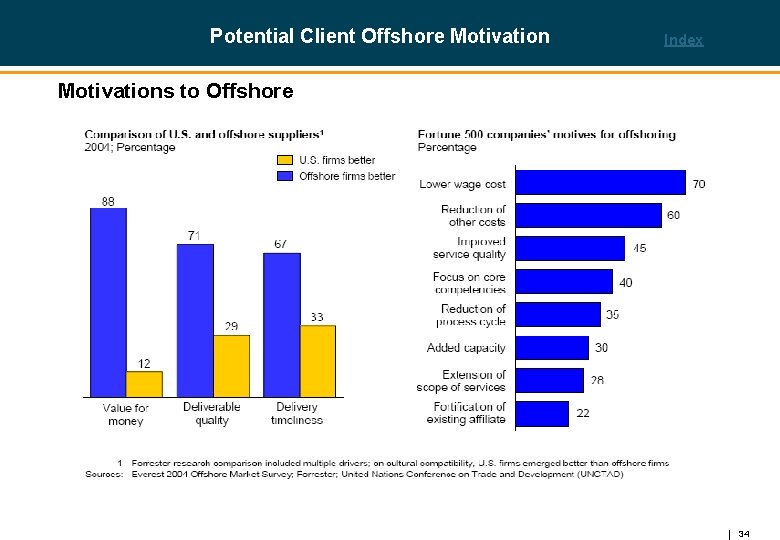
Potential Client Offshore Motivation Index Motivations to Offshore 34
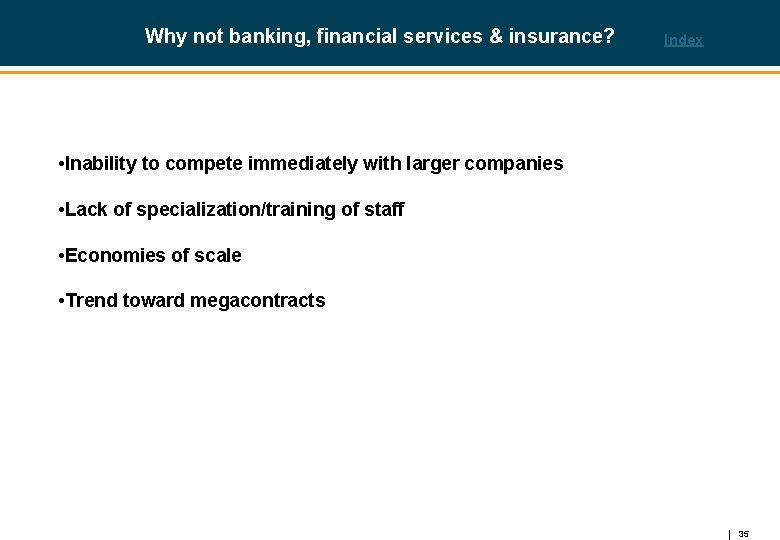
Why not banking, financial services & insurance? Index • Inability to compete immediately with larger companies • Lack of specialization/training of staff • Economies of scale • Trend toward megacontracts 35
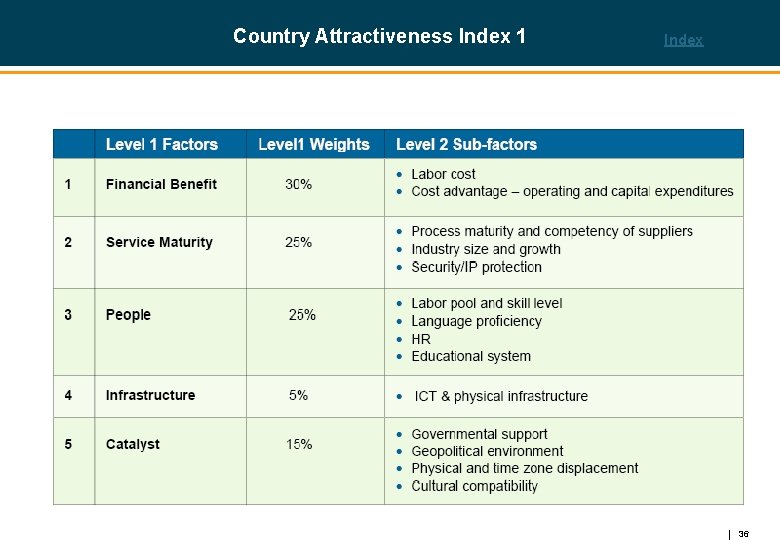
Country Attractiveness Index 1 Index 36
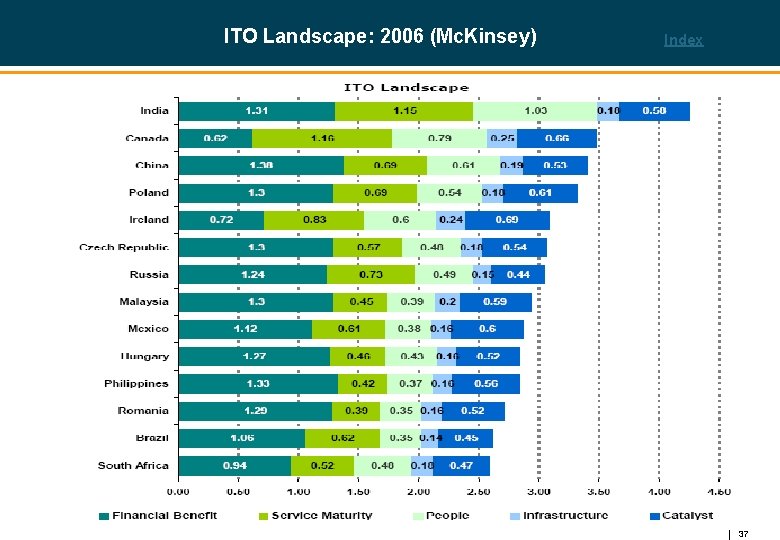
ITO Landscape: 2006 (Mc. Kinsey) Index Country Attractiveness Index 2 - ITO 37
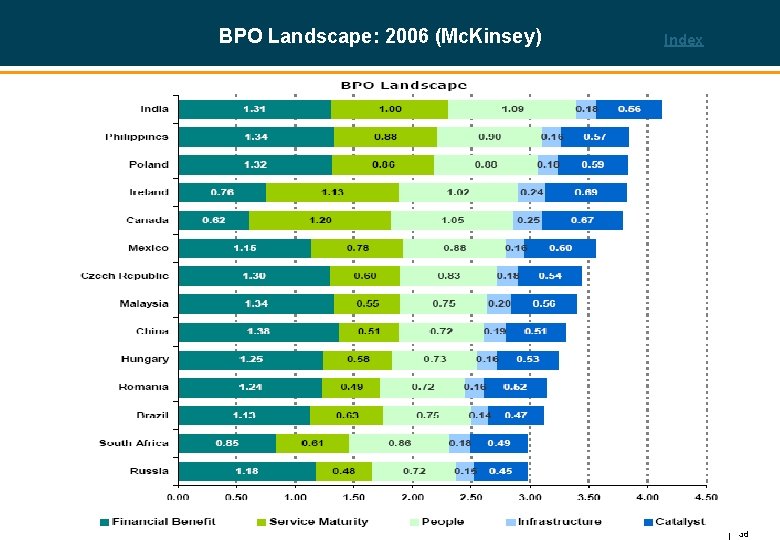
BPO Landscape: 2006 (Mc. Kinsey) Index 38
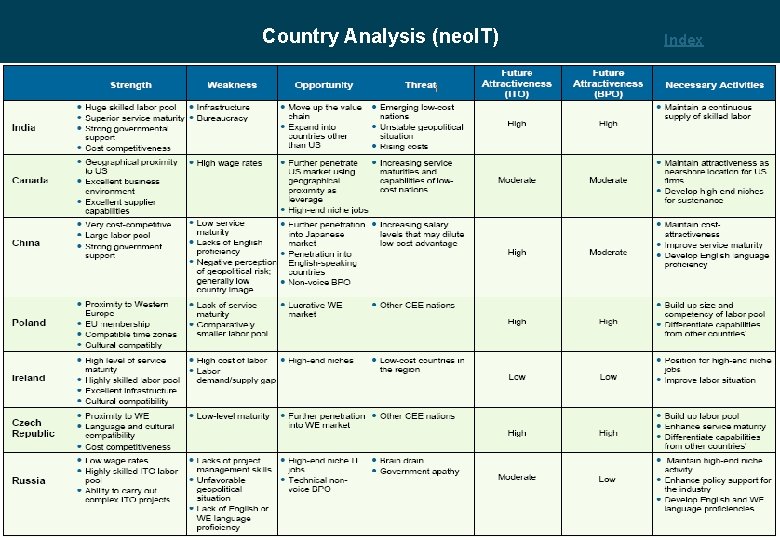
Country Analysis (neo. IT) Index Country SWOT 1 39
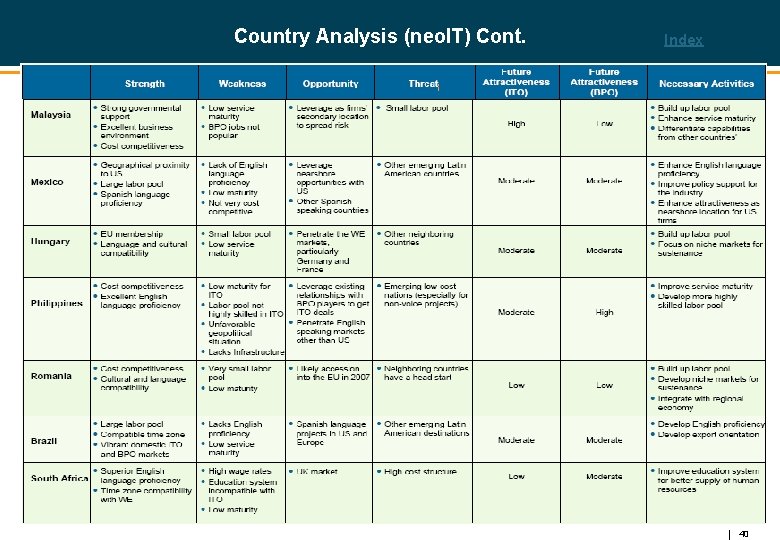
Country Analysis (neo. IT) Cont. Index Country SWOT 2 40
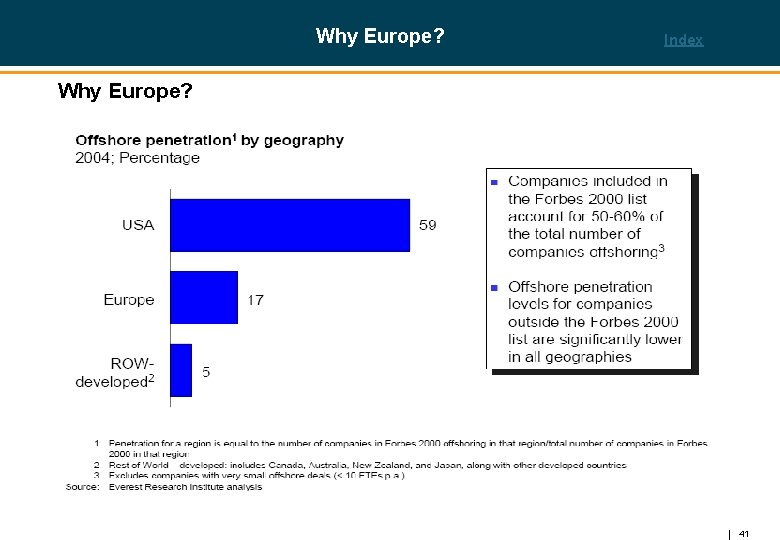
Why Europe? Index Why Europe? 41
Why India? Index • Current competitive strength • Foundation of company, developed infrastructure of operations • Despite rising labor costs, relatively low with other viable options • Potential for growth still high • Competitive advantage expertise of all business practices in country v. Customer needs to continually monitor India during all future evaluation periods. Competitive advantage with familiarity can lead to positioning in numerous circumstances, including partnerships, mergers, or any offerings of strategic buyouts. 42
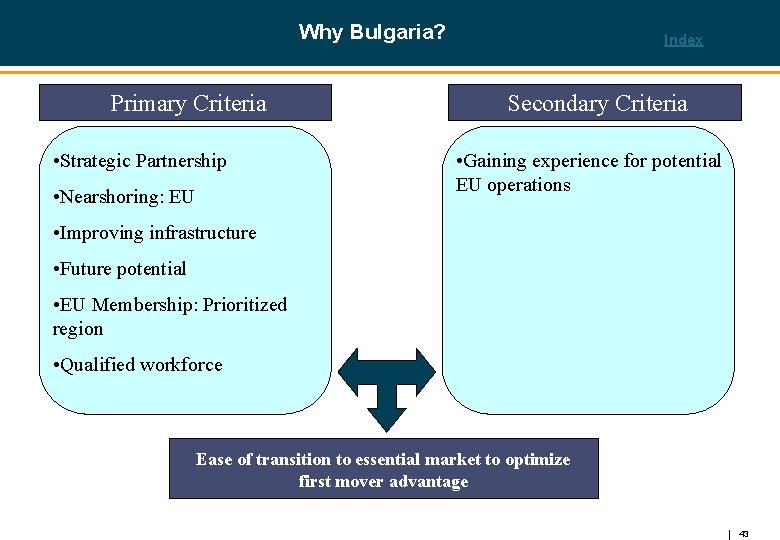
Why Bulgaria? Primary Criteria • Strategic Partnership • Nearshoring: EU Index Secondary Criteria • Gaining experience for potential EU operations • Improving infrastructure • Future potential • EU Membership: Prioritized region • Qualified workforce Ease of transition to essential market to optimize first mover advantage 43
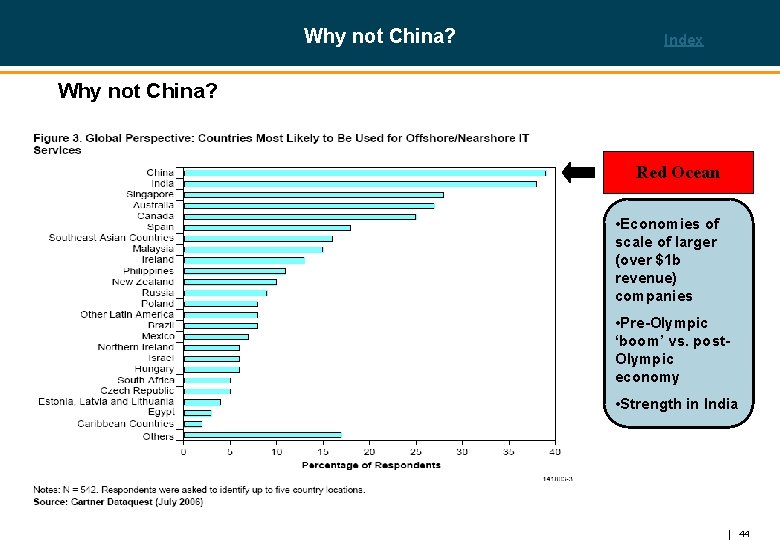
Why not China? Index Why not China? Red Ocean • Economies of scale of larger (over $1 b revenue) companies • Pre-Olympic ‘boom’ vs. post. Olympic economy • Strength in India 44
Why not China? Cont. Index Why not China? • Lack of English speaking employees, high cost of internet connectivity, workforce immaturity. • Unfamiliarity with culture • Economic advantages of EU and NAFTA • Not looking solely for cost advantages China needs to be continually monitored as an expansion option to 2010 and beyond 45
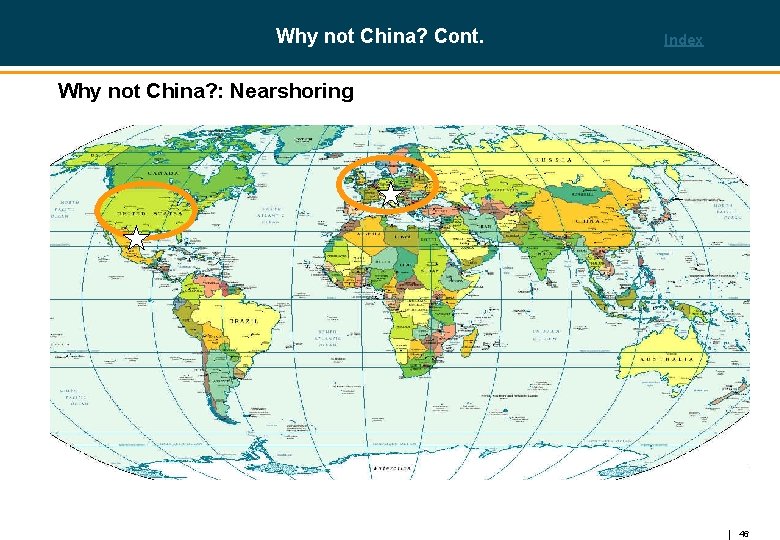
Why not China? Cont. Index Why not China? : Nearshoring 46
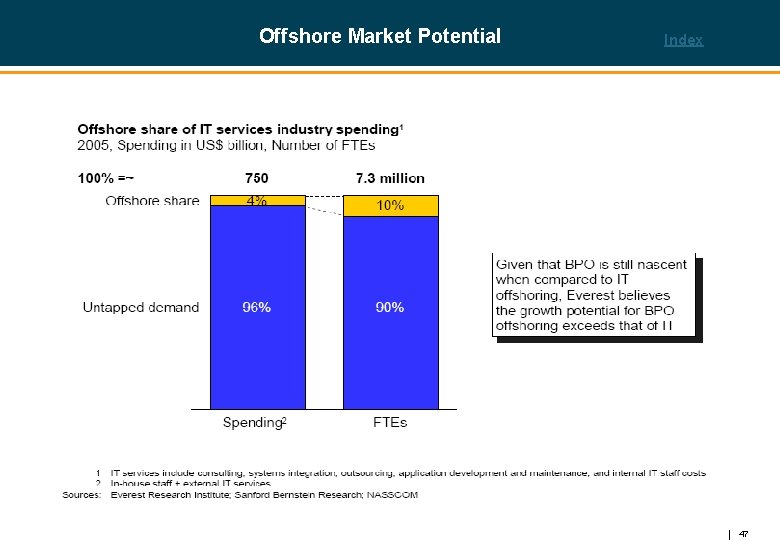
Offshore Market Potential Index 47
ITO/BPO Industry Outlooks: 2005 Index Offshore Market Potential 2 48
Multiple Engagement Models From primarily captive… Index …to a hybrid model Indian best-ofbreed vendor Outsource to Global brand Feasibility of outsourcing the process Indian best-ofbreed vendor JV/ Alliance Delay JV/ Alliance Captive Delay Captive Cross-border operation sophistication Source: Mc. Kinsey Analysis 49
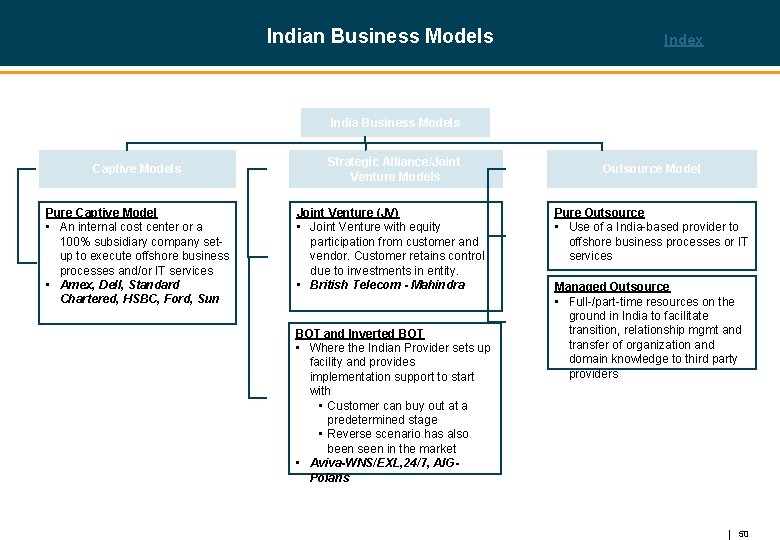
Indian Business Models Index India Business Models Captive Models Pure Captive Model • An internal cost center or a 100% subsidiary company setup to execute offshore business processes and/or IT services • Amex, Dell, Standard Chartered, HSBC, Ford, Sun Strategic Alliance/Joint Venture Models Joint Venture (JV) • Joint Venture with equity participation from customer and vendor. Customer retains control due to investments in entity. • British Telecom - Mahindra BOT and Inverted BOT • Where the Indian Provider sets up facility and provides implementation support to start with • Customer can buy out at a predetermined stage • Reverse scenario has also been seen in the market • Aviva-WNS/EXL, 24/7, AIGPolaris Outsource Model Pure Outsource • Use of a India-based provider to offshore business processes or IT services Managed Outsource • Full-/part-time resources on the ground in India to facilitate transition, relationship mgmt and transfer of organization and domain knowledge to third party providers 50
Criteria for Vendor Selection Index 51
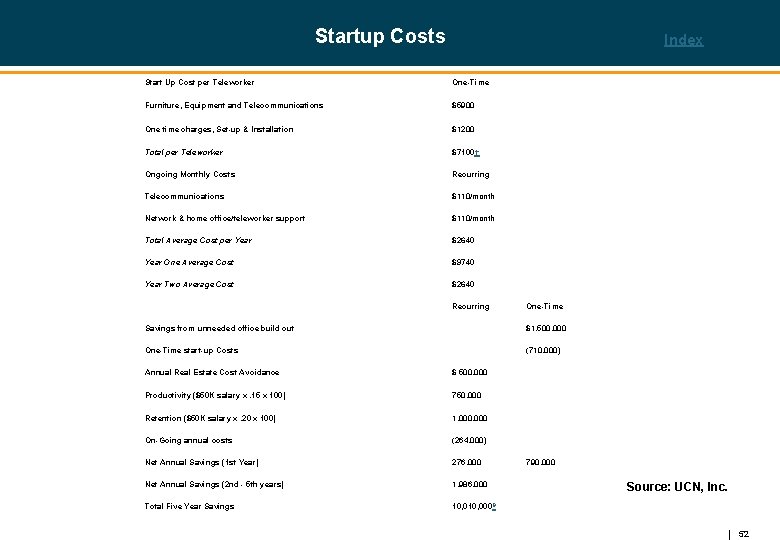
Startup Costs Index Start Up Cost per Teleworker One-Time Furniture, Equipment and Telecommunications $5900 One time charges, Set-up & Installation $1200 Total per Teleworker $7100† Ongoing Monthly Costs Recurring Telecommunications $110/month Network & home office/teleworker support $110/month Total Average Cost per Year $2640 Year One Average Cost $9740 Year Two Average Cost $2640 Recurring One-Time Savings from unneeded office build out $1, 500, 000 One-Time start-up Costs (710, 000) Annual Real Estate Cost Avoidance $ 500, 000 Productivity ($50 K salary x. 15 x 100) 750, 000 Retention ($50 K salary x. 20 x 100) 1, 000 On-Going annual costs (264, 000) Net Annual Savings (1 st Year) 276, 000 790, 000 Net Annual Savings (2 nd - 5 th years) 1, 986, 000 Total Five Year Savings 10, 000 8 Source: UCN, Inc. 52
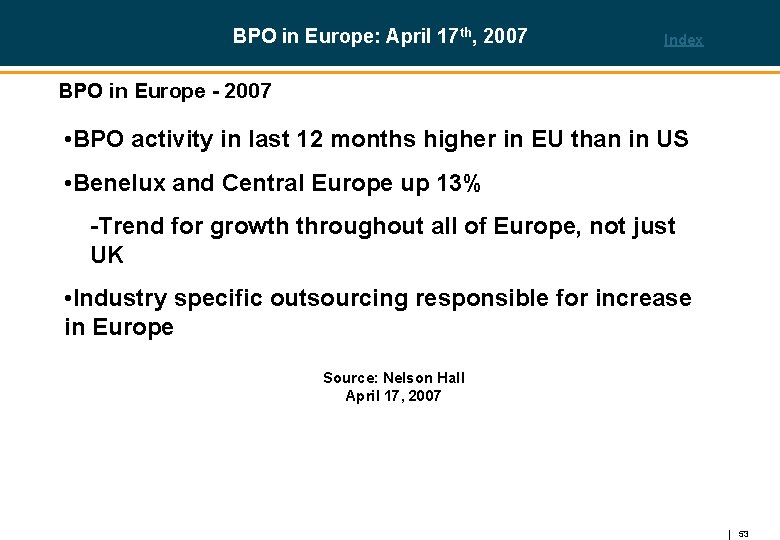
BPO in Europe: April 17 th, 2007 Index BPO in Europe - 2007 • BPO activity in last 12 months higher in EU than in US • Benelux and Central Europe up 13% -Trend for growth throughout all of Europe, not just UK • Industry specific outsourcing responsible for increase in Europe Source: Nelson Hall April 17, 2007 53
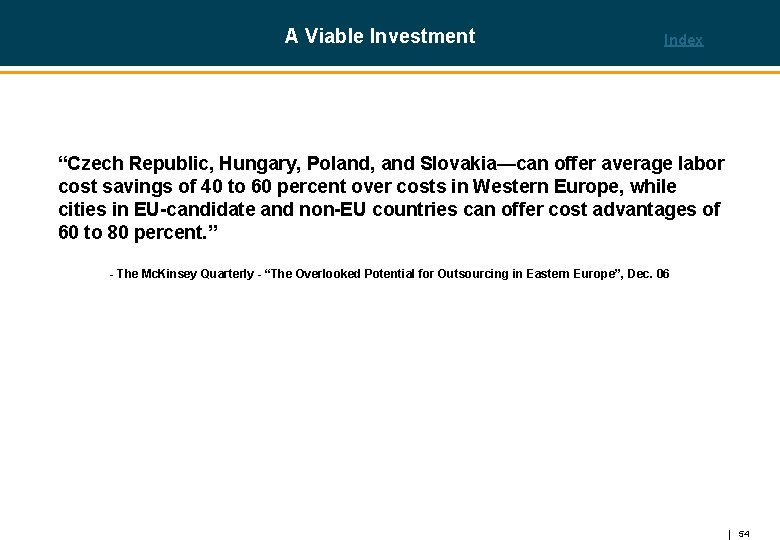
A Viable Investment Index “Czech Republic, Hungary, Poland, and Slovakia—can offer average labor cost savings of 40 to 60 percent over costs in Western Europe, while cities in EU-candidate and non-EU countries can offer cost advantages of 60 to 80 percent. ” - The Mc. Kinsey Quarterly - “The Overlooked Potential for Outsourcing in Eastern Europe”, Dec. 06 54
- Slides: 54