
Strategic RD Value Lifecycle Management Doug Bodner Bill
Strategic R&D Value Lifecycle Management Doug Bodner, Bill Rouse and Mike Pennock Tennenbaum Institute Georgia Tech © 2005. All rights reserved. 1
Outline • R&D value and value lifecycle • Value levers • Simulation-based approach – Process model and results – Product model and integration • Future work 2
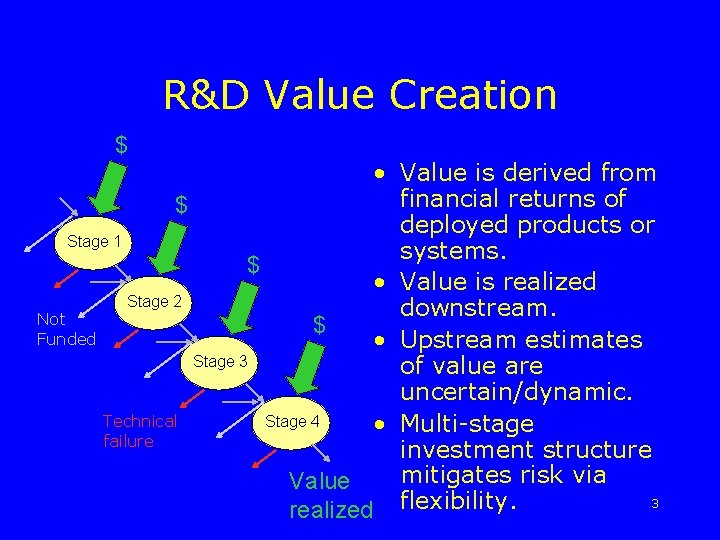
R&D Value Creation $ • Value is derived from financial returns of $ deployed products or Stage 1 systems. $ • Value is realized Stage 2 downstream. Not $ Funded • Upstream estimates Stage 3 of value are uncertain/dynamic. Stage 4 Technical • Multi-stage failure investment structure mitigates risk via Value 3 realized flexibility.
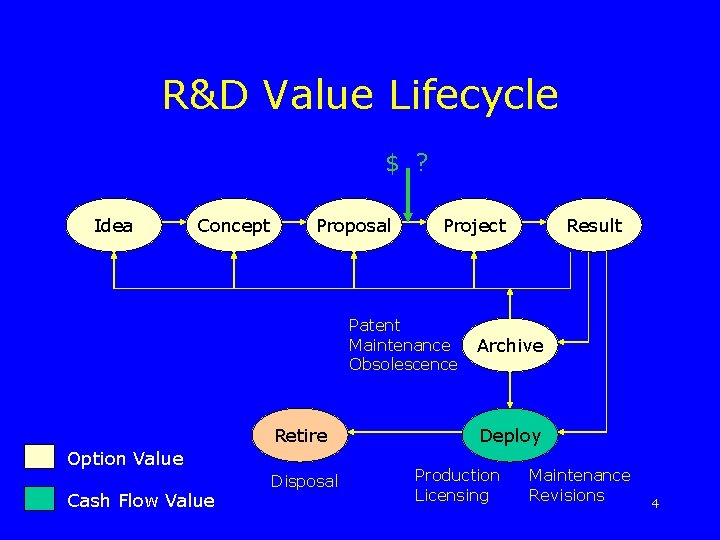
R&D Value Lifecycle $ ? Idea Concept Proposal Project Patent Maintenance Obsolescence Retire Option Value Cash Flow Value Disposal Result Archive Deploy Production Licensing Maintenance Revisions 4
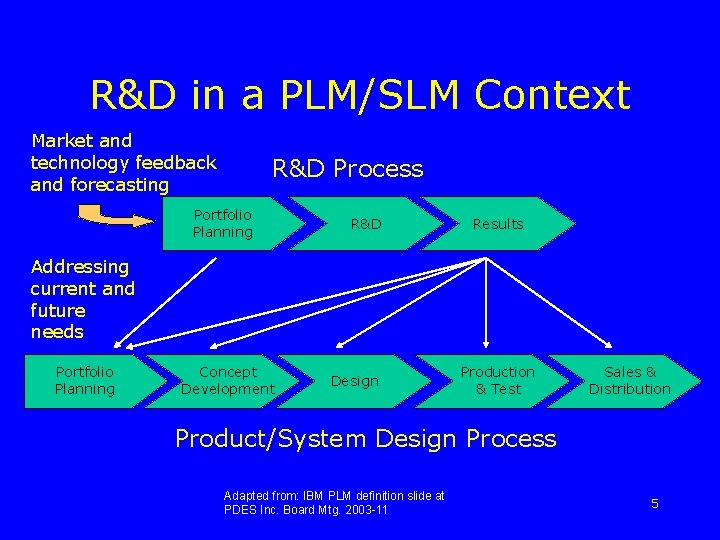
R&D in a PLM/SLM Context Market and technology feedback and forecasting R&D Process Portfolio Planning R&D Results Addressing current and future needs Portfolio Planning Concept Development Design Production & Test Sales & Distribution Product/System Design Process Adapted from: IBM PLM definition slide at PDES Inc. Board Mtg. 2003 -11 5
Goals • Identify value levers that can be manipulated to improve value creation • Understand quantitative effects in relation to enterprise parameters • Provide what-if analysis capability for strategic decision-making 6
Value Levers • Enterprise operation – How to valuate R&D products – How to allocate budget among stages/programs – Portfolio management • Enterprise design – How many R&D stages – Outsourcing R&D – Organizational structure 7
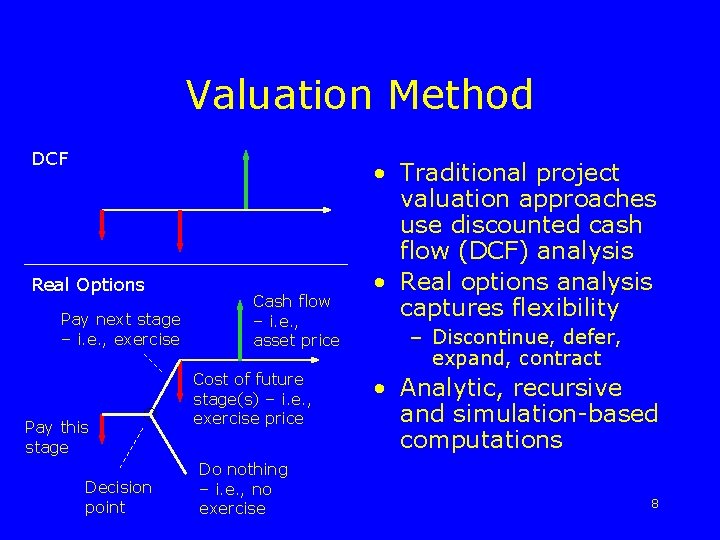
Valuation Method DCF Real Options Pay next stage – i. e. , exercise Pay this stage Decision point Cash flow – i. e. , asset price Cost of future stage(s) – i. e. , exercise price Do nothing – i. e. , no exercise • Traditional project valuation approaches use discounted cash flow (DCF) analysis • Real options analysis captures flexibility – Discontinue, defer, expand, contract • Analytic, recursive and simulation-based computations 8
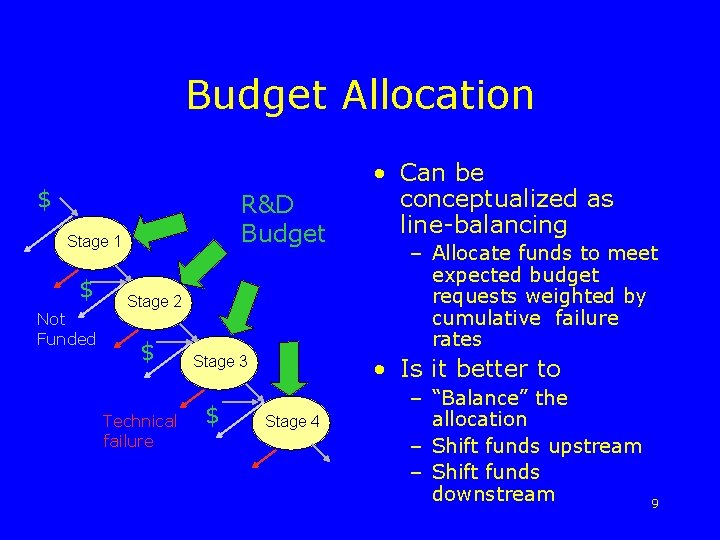
Budget Allocation $ R&D Budget Stage 1 Not Funded Stage 2 $ $ Technical failure Stage 3 $ • Can be conceptualized as line-balancing – Allocate funds to meet expected budget requests weighted by cumulative failure rates • Is it better to Stage 4 – “Balance” the allocation – Shift funds upstream – Shift funds downstream 9
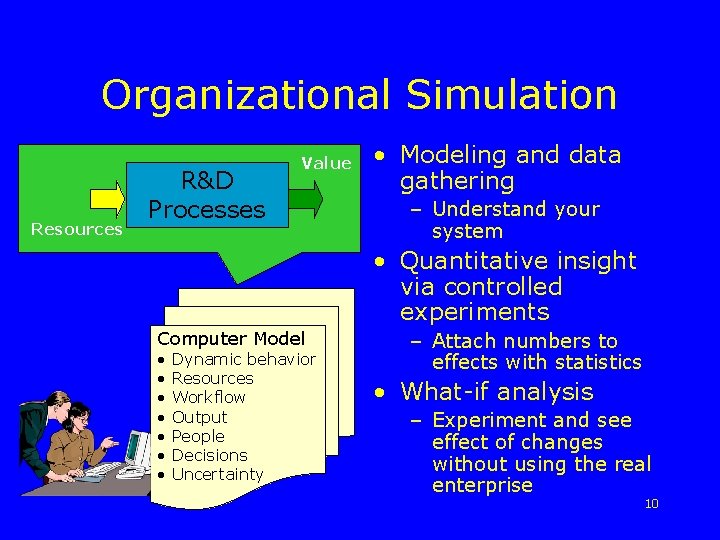
Organizational Simulation Resources R&D Processes Value • Modeling and data gathering – Understand your system • Quantitative insight via controlled experiments Computer Model • • Dynamic behavior Resources Workflow Output People Decisions Uncertainty – Attach numbers to effects with statistics • What-if analysis – Experiment and see effect of changes without using the real enterprise 10
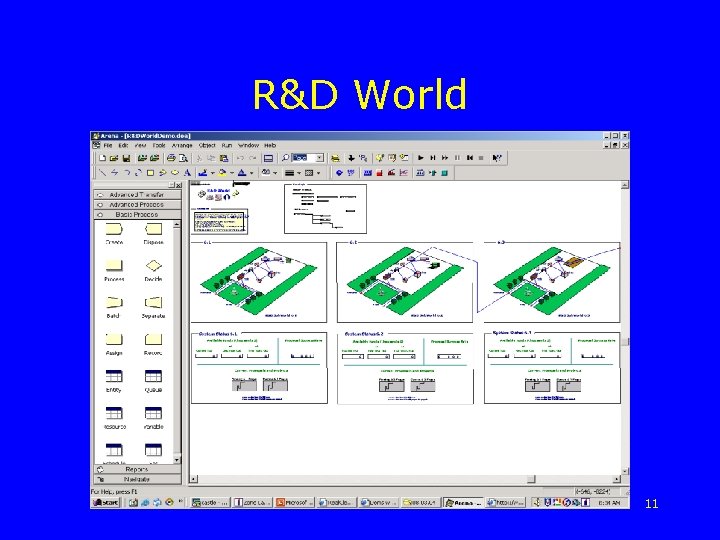
R&D World 11
Model Description • R&D process model (four stages) • R&D modeled as lines that traverse through each stage • Budget requests per stage increase by factor of 2 • Technical failure rates decrease as stages are traversed • Estimated deployed value varies lognormally over time • Value realized after successful deployment 12
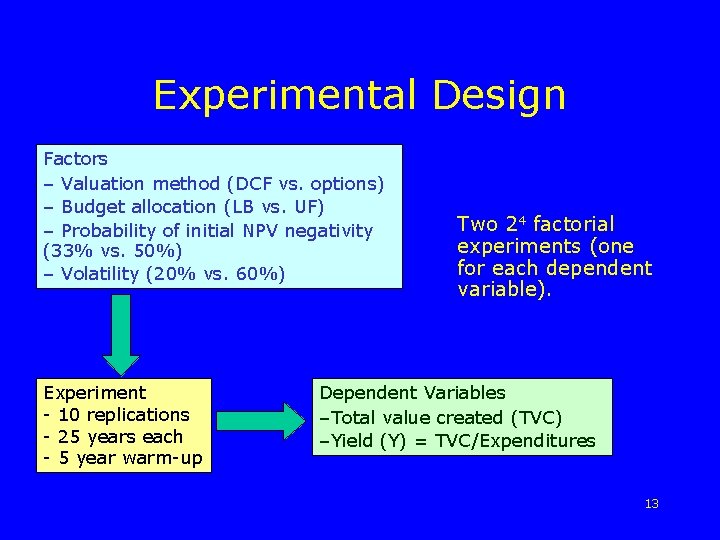
Experimental Design Factors – Valuation method (DCF vs. options) – Budget allocation (LB vs. UF) – Probability of initial NPV negativity (33% vs. 50%) – Volatility (20% vs. 60%) Experiment - 10 replications - 25 years each - 5 year warm-up Two 24 factorial experiments (one for each dependent variable). Dependent Variables –Total value created (TVC) –Yield (Y) = TVC/Expenditures 13
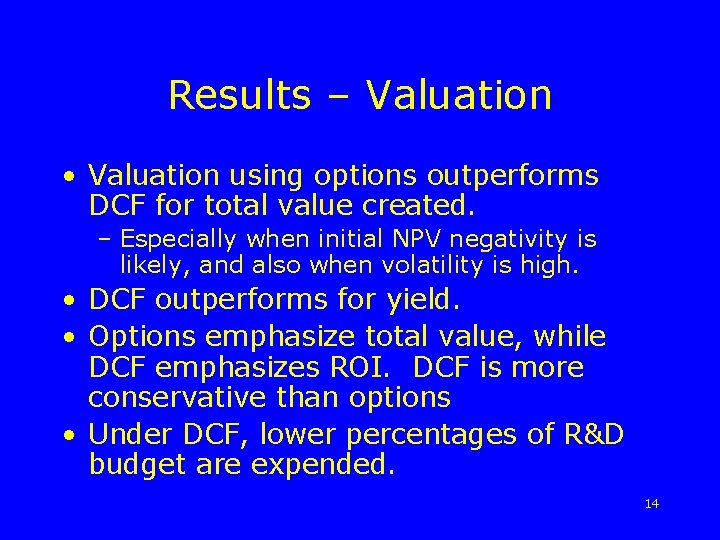
Results – Valuation • Valuation using options outperforms DCF for total value created. – Especially when initial NPV negativity is likely, and also when volatility is high. • DCF outperforms for yield. • Options emphasize total value, while DCF emphasizes ROI. DCF is more conservative than options • Under DCF, lower percentages of R&D budget are expended. 14
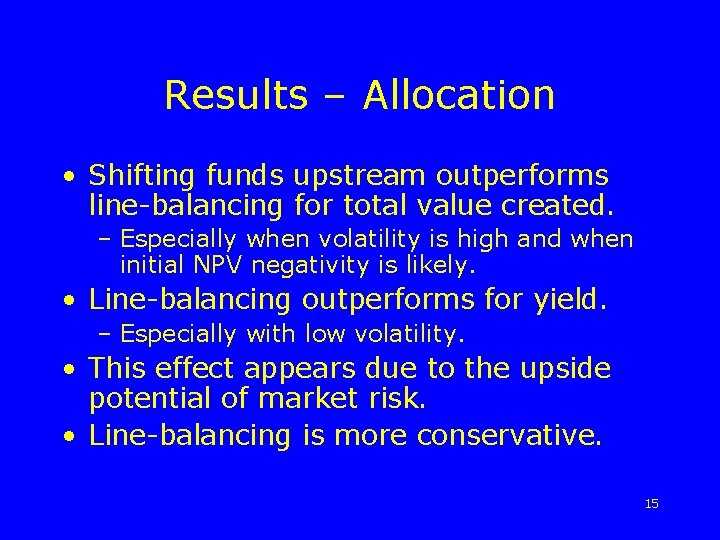
Results – Allocation • Shifting funds upstream outperforms line-balancing for total value created. – Especially when volatility is high and when initial NPV negativity is likely. • Line-balancing outperforms for yield. – Especially with low volatility. • This effect appears due to the upside potential of market risk. • Line-balancing is more conservative. 15
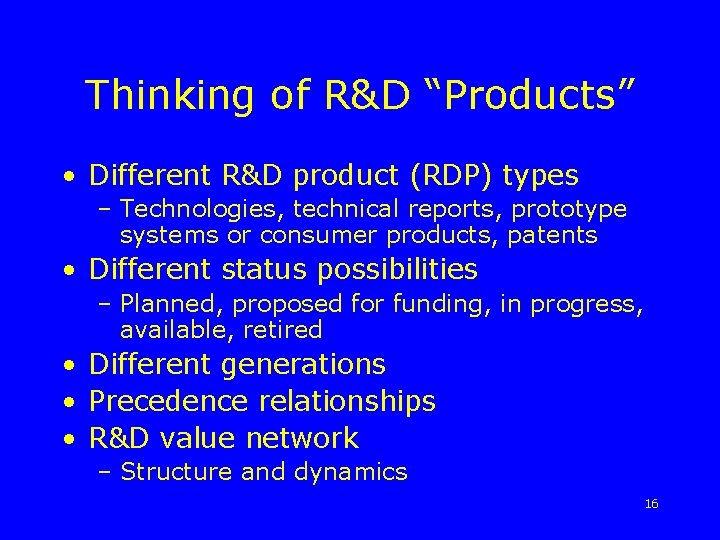
Thinking of R&D “Products” • Different R&D product (RDP) types – Technologies, technical reports, prototype systems or consumer products, patents • Different status possibilities – Planned, proposed for funding, in progress, available, retired • Different generations • Precedence relationships • R&D value network – Structure and dynamics 16
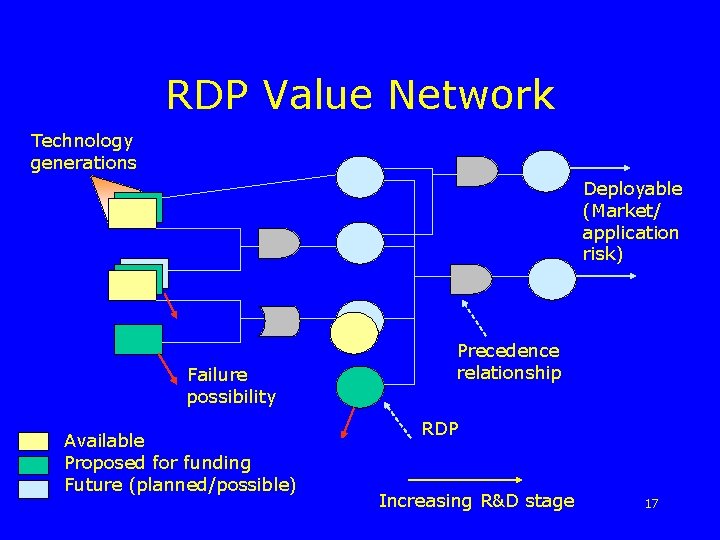
RDP Value Network Technology generations Deployable (Market/ application risk) Failure possibility Available Proposed for funding Future (planned/possible) Precedence relationship RDP Increasing R&D stage 17
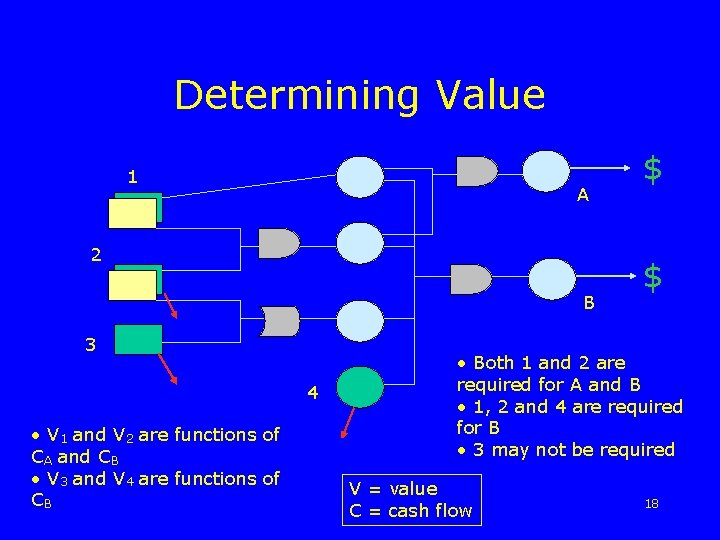
Determining Value 1 A 2 B 3 4 • V 1 and V 2 are functions of CA and CB • V 3 and V 4 are functions of CB $ $ • Both 1 and 2 are required for A and B • 1, 2 and 4 are required for B • 3 may not be required V = value C = cash flow 18
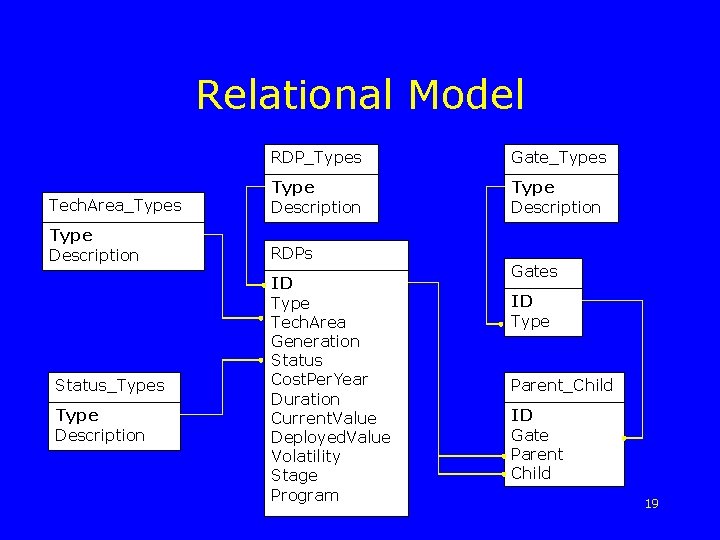
Relational Model RDP_Types Gate_Types Tech. Area_Types Type Description RDPs Status_Types Type Description ID Type Tech. Area Generation Status Cost. Per. Year Duration Current. Value Deployed. Value Volatility Stage Program Gates ID Type Parent_Child ID Gate Parent Child 19
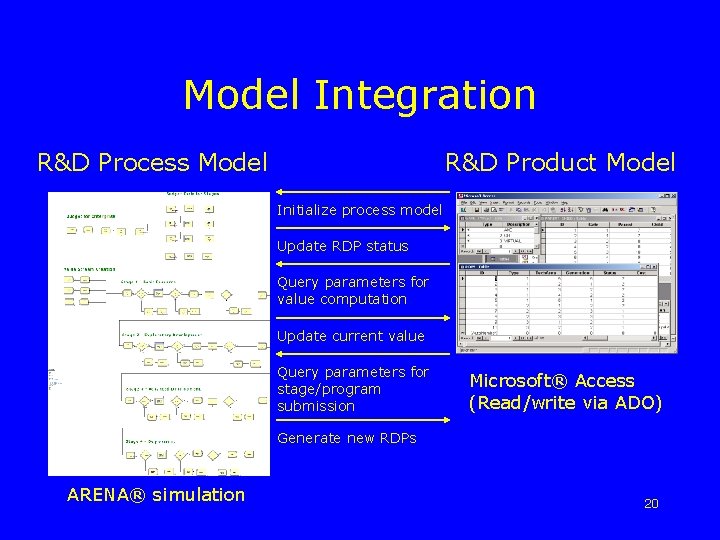
Model Integration R&D Process Model R&D Product Model Initialize process model Update RDP status Query parameters for value computation Update current value Query parameters for stage/program submission Microsoft® Access (Read/write via ADO) Generate new RDPs ARENA® simulation 20
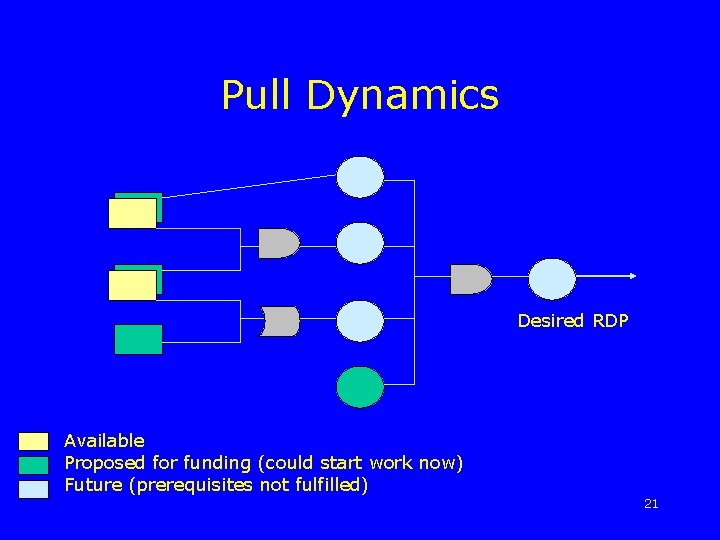
Pull Dynamics Desired RDP Available Proposed for funding (could start work now) Future (prerequisites not fulfilled) 21
Future Research • Model more complex decision logic in process model • Specify computationally efficient valuation methods for RDPs in complex value networks • Enhance knowledge management in product model • Enhance and validate via case studies • Explore integration with strategic design 22
Questions? ? ? 23
Further Reading • Bodner, Rouse and Pennock, 2005, Using simulation to analyze R&D value creation, Winter Simulation Conference, submitted. • Hansen, Weiss and Kwak, 1999, Allocating R&D resources: a quantitative aid to management insight. Research Technology Management 42: 44 -50. • Rouse and Boff, 2003, Value streams in science & technology: a case study of value creation and intelligent tutoring systems, Systems Engineering 6: 7691. • Rouse and Boff, 2005, Organizational simulation. New York: Wiley-Interscience. • Trigeorgis, 1996, Real options: managerial flexibility and strategy in resource allocation. Cambridge, MA: The MIT Press. 24
- Slides: 24