Strain Suppressed Equilibration in One Dimensional Atomic Chains

Strain Suppressed Equilibration in One Dimensional Atomic Chains Samuel Powers Donald Priour

Practical Applications • Some materials are 1 -D chains of molecules. • Such chains are under consideration for use in new electronic devices. • Equilibration controlled through strain could operate switches on a microscopic scale.

Applicable Materials • Carbyne: string of carbon atoms in single and triple bonds • C C C • Cumulene: string of carbon atoms in double bonds • C C C
 R R")
Harmonic Model for Interatomic Potentials V(R) R R

Symmetric versus Antisymmetric Example • Consider the two mass system in 1 -D. • There are two modes, the symmetric mode, and the antisymmetric mode. • Symmetric Mode: masses oscillate in unison in the same direction • Antisymmetric Mode: masses oscillate in unison in the opposite direction

Normal Modes: General Characteristics • Motion in a purely harmonic system may be described with normal modes. • Normal modes never exchange energy. • Energy is evenly spread through equilibration. • A purely harmonic system will never equilibrate.

Anharmonic Effects •

Transverse Motion •

FPU Oscillations • The chains of molecules we consider resemble the Fermi-Pasta-Ulam system, a chain of coupled oscillators. • In 1954; Fermi, Pasta, and Ulam simulated a chain of coupled oscillators that did not appear to equilibrate. • A later study by Kantz, Livi, and Ruffo found a critical energy above which the FPU system equilibrated. 1 • 1 J. D. Luca and A. J. Lichtenberg, Phys. Rev. E 51, 2877 (1995)

Molecular Dynamics •
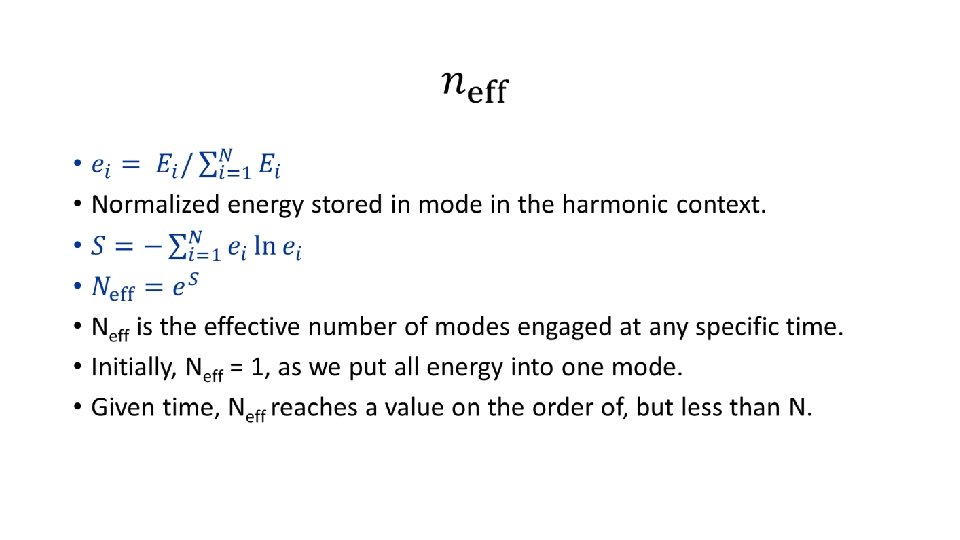

neff •

neff Energy per Site Graphs for FPU System Low energy: no apparent equilibration Higher energy: equilibration after some time

Fast Dynamics in FPU System above energy per site threshold. Equilibration occurs much sooner

neff Energy per Site Graphs for 3 -D Motion
")
neff Energy per Site Graphs for 3 -D Motion Mean Equilibrium value Minimum (baseline) value

Slow Equilibration

Fast Equilibration
 vs. Log(Strain) Slow Dynamics Fast")
Strain Threshold Graphs Energy/site vs Strain Slow Dynamics Log(Energy/site) vs. Log(Strain) Slow Dynamics Fast Dynamics
 and slow equilibration")
Strain Threshold • Graphs represent a boundary between fast equilibration (left) and slow equilibration (right). • Curves are scaled by multiplying by their corresponding system sizes. • In 3 -D, strain is a degree of freedom that allows switching between fast and slow equilibration. • Dynamics depend on energy per site, strain, and number of masses • implied that a larger system size means less strain is needed to trigger slow equilibration

Conclusion • We have simulated anharmonic effects in a realistic context, with chains in a 3 D environment, where the anharmonicity is intrinsic to the geometry instead of terms in the interatomic potential. • Increasing strain slows equilibration. • There appears to be an abrupt strain threshold at which the system shifts from slow dynamics to rapid equilibration.
. Energy transitions and time")
References • Luca, J. D. , & Lichtenberg, A. (1995). Energy transitions and time scales to equipartition in the Fermi-Pasta-Ulam oscillator chain. Physical Review E, 51(4). • Luca, J. D. , & Lichtenberg, A. (2002). Transitions and time scales to equipartition in oscillator chains: Low-frequency initial conditions. Physical Review E, 66, . doi: 10. 1103/Phys. Rev. E. 66. 026206
- Slides: 22