Strace Blktrace Strace Introduction strace is a diagnostic

Strace & Blktrace

Strace
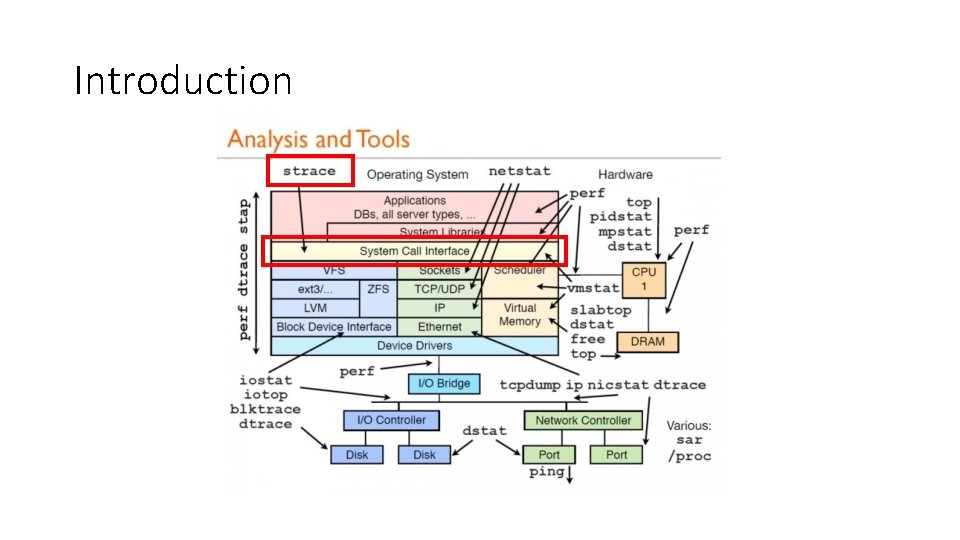
Introduction • strace is a diagnostic, debugging and instructional userspace utility for Linux. • The program strace is very handy when you want to debug the execution of a program. • It catches and states all the system calls performed called by a process. • It will also catch and state any inter-process signals received by this process.
Introduction • Strace Overview strace can be seen as a light weight debugger. It allows a programmer / user to quickly find out how a program is interacting with the OS. It does this by monitoring system calls and signals. • Uses Good for when you don't have source code or don't want to be bothered to really go through it.
Introduction
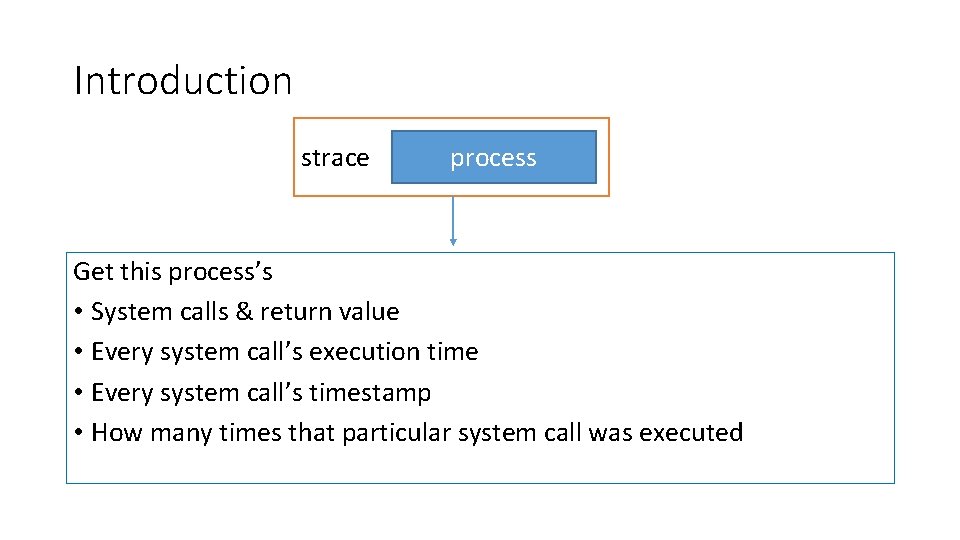
Introduction strace process Get this process’s • System calls & return value • Every system call’s execution time • Every system call’s timestamp • How many times that particular system call was executed
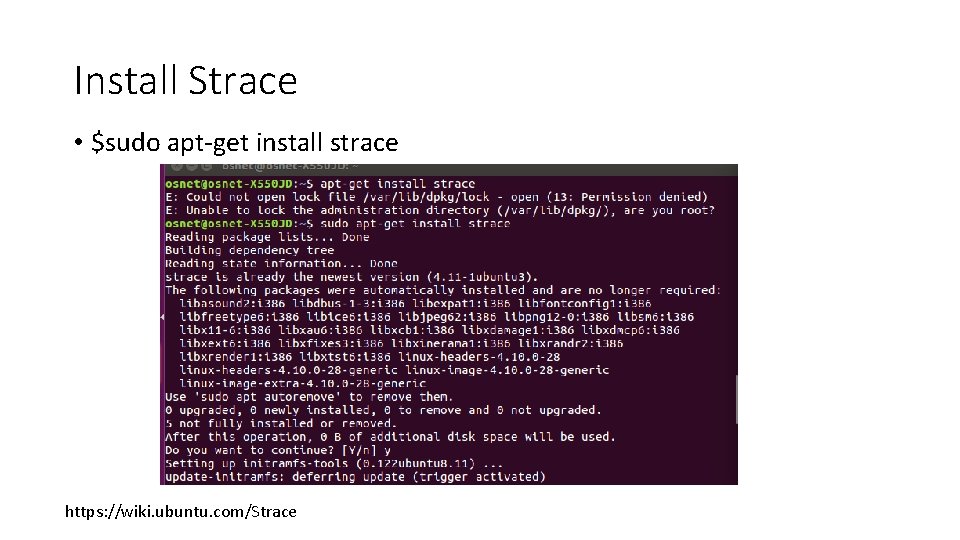
Install Strace • $sudo apt-get install strace https: //wiki. ubuntu. com/Strace
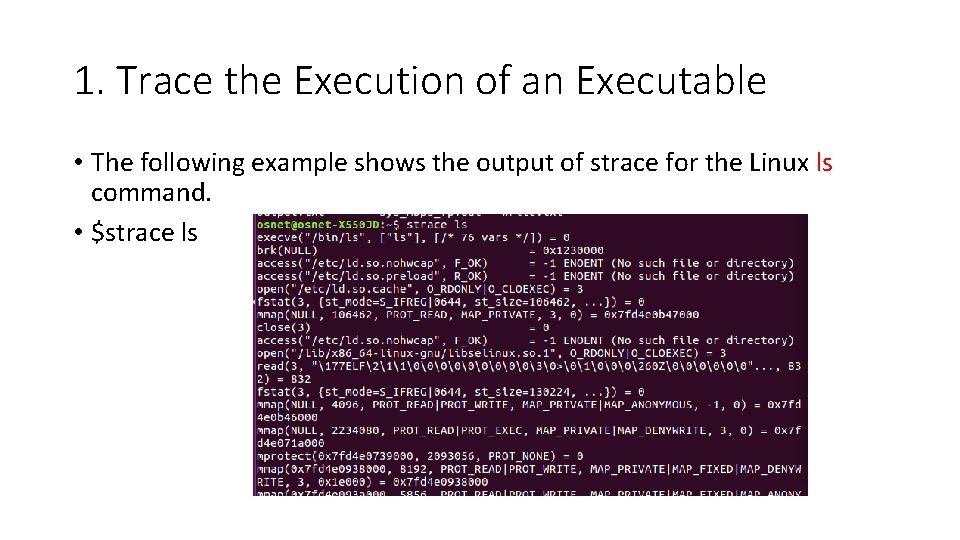
1. Trace the Execution of an Executable • The following example shows the output of strace for the Linux ls command. • $strace ls
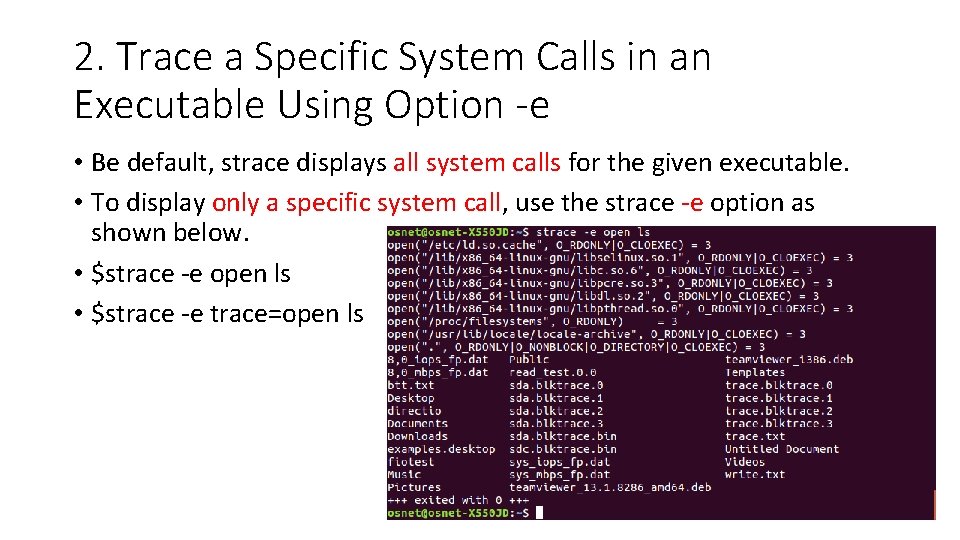
2. Trace a Specific System Calls in an Executable Using Option -e • Be default, strace displays all system calls for the given executable. • To display only a specific system call, use the strace -e option as shown below. • $strace -e open ls • $strace -e trace=open ls
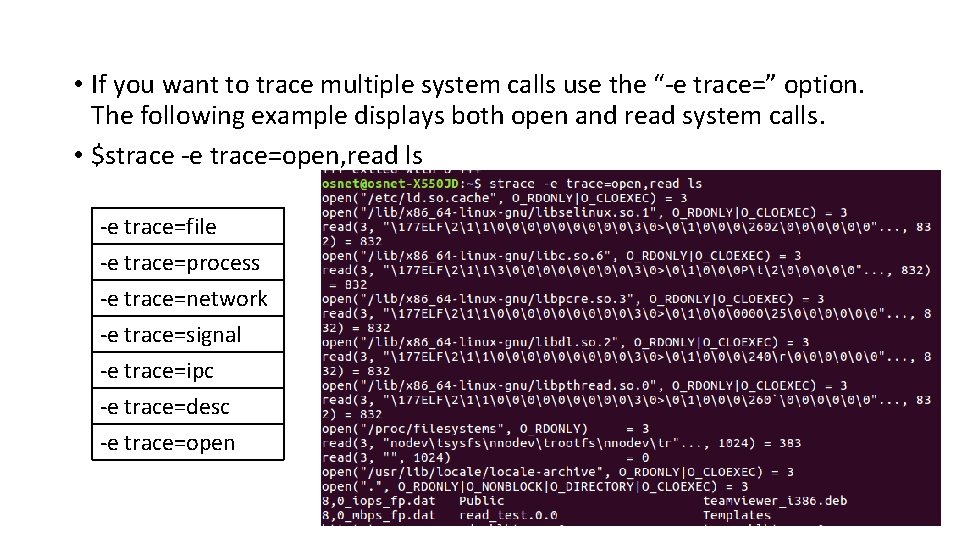
• If you want to trace multiple system calls use the “-e trace=” option. The following example displays both open and read system calls. • $strace -e trace=open, read ls -e trace=file -e trace=process -e trace=network -e trace=signal -e trace=ipc -e trace=desc -e trace=open
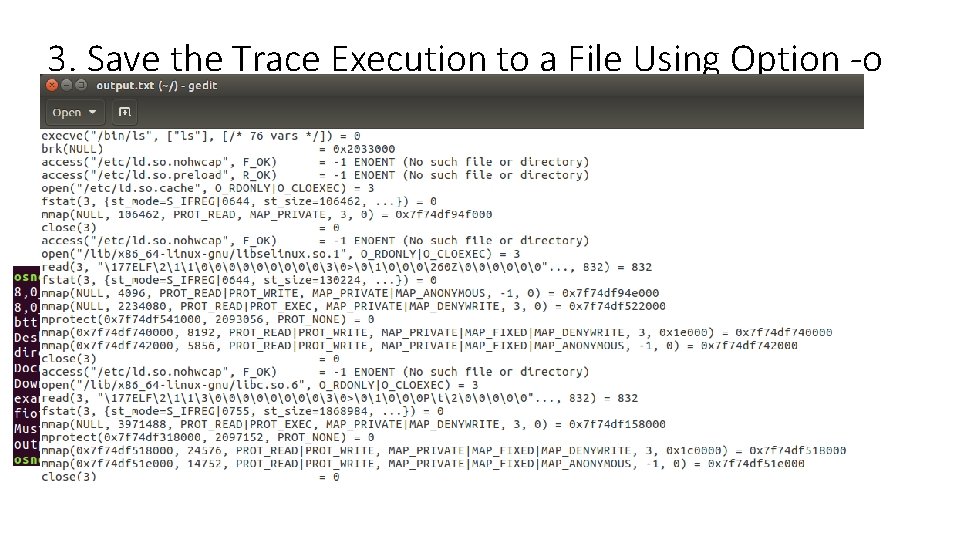
3. Save the Trace Execution to a File Using Option -o • The following examples stores the strace output to output. txt file. • $strace -o output. txt ls
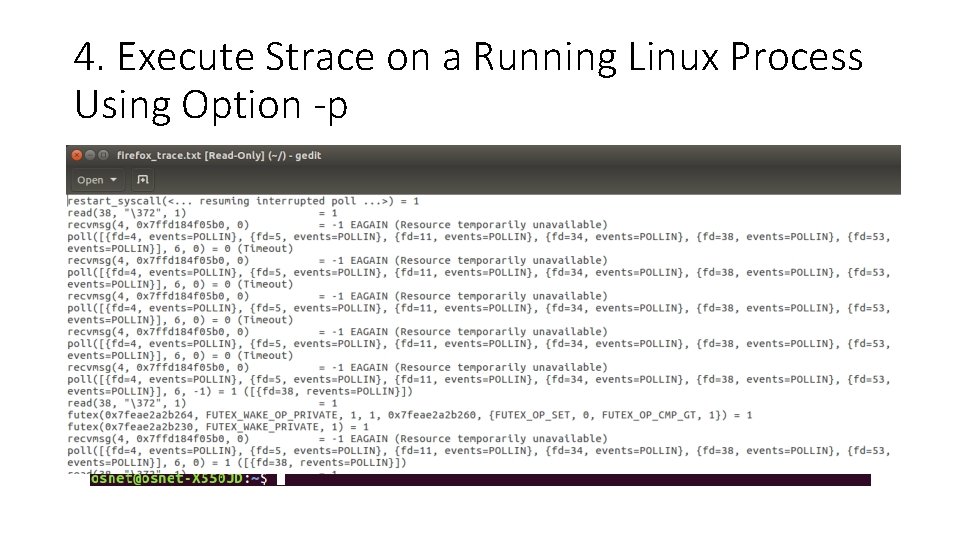
4. Execute Strace on a Running Linux Process Using Option -p • You could execute strace on a program that is already running using the process id. First, identify the PID of a program using ps command. • $ps ax | grep firefox • $sudo strace -p 2750 -o firefox_trace. txt
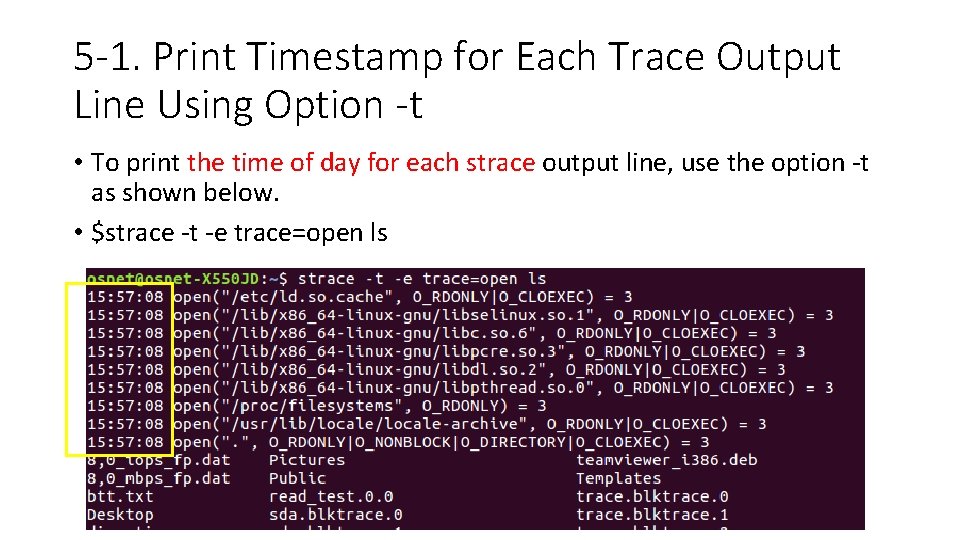
5 -1. Print Timestamp for Each Trace Output Line Using Option -t • To print the time of day for each strace output line, use the option -t as shown below. • $strace -t -e trace=open ls
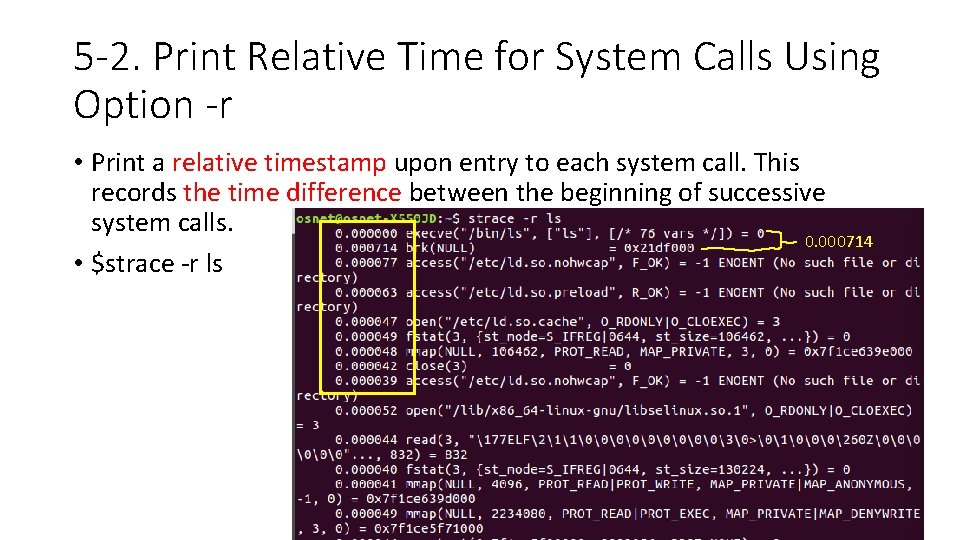
5 -2. Print Relative Time for System Calls Using Option -r • Print a relative timestamp upon entry to each system call. This records the time difference between the beginning of successive system calls. 0. 000714 • $strace -r ls
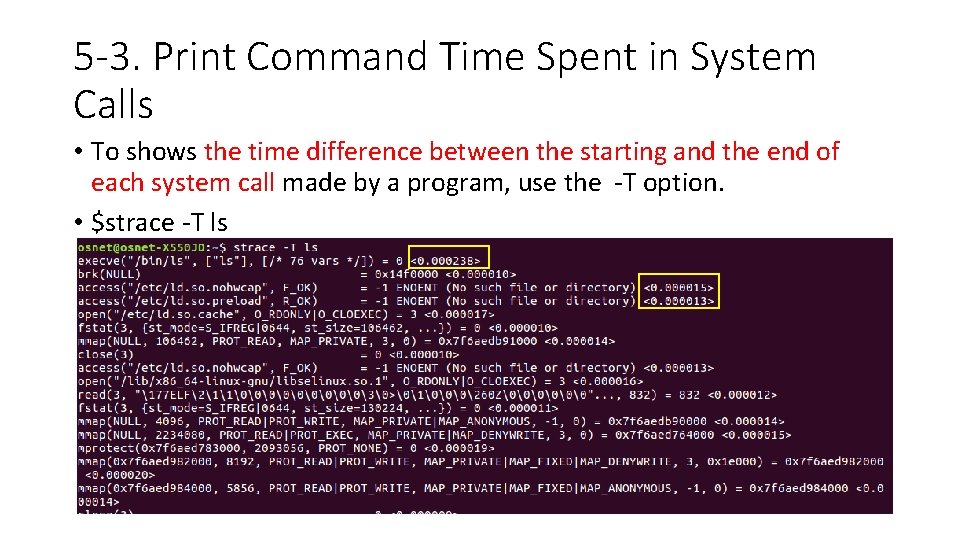
5 -3. Print Command Time Spent in System Calls • To shows the time difference between the starting and the end of each system call made by a program, use the -T option. • $strace -T ls
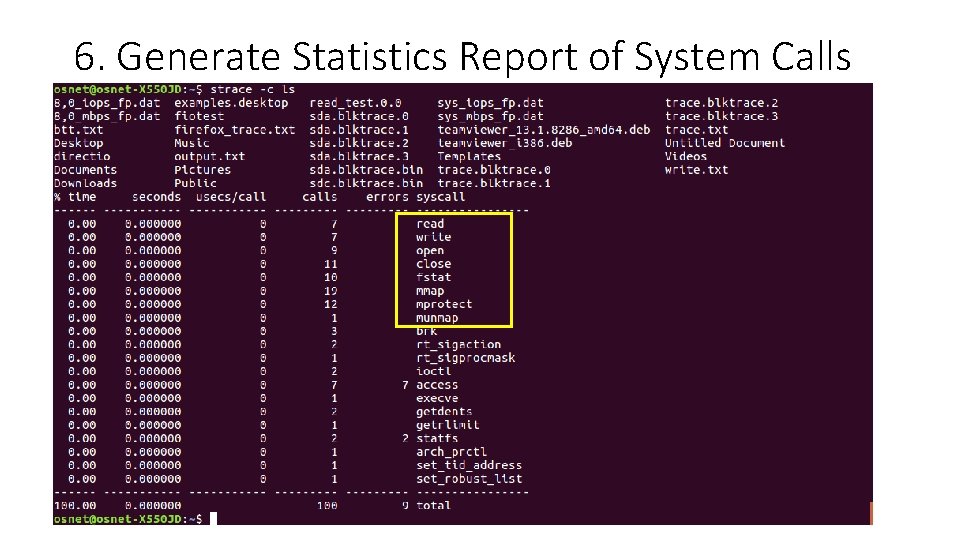
6. Generate Statistics Report of System Calls Using Option -c • Using the -c flag, you can generate a report of total time, calls, and errors for each system call, as follows. • $strace -c ls
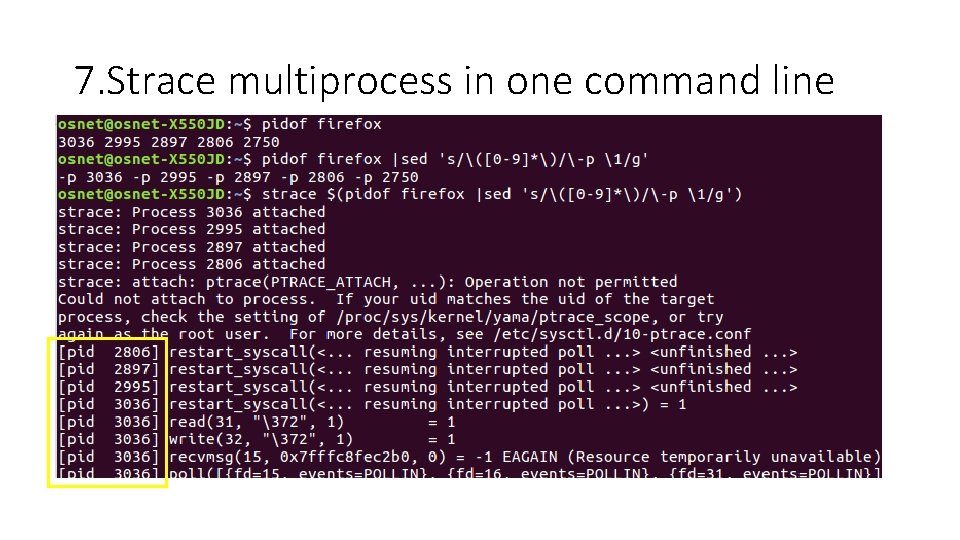
7. Strace multiprocess in one command line • Observe the output of pidof $ pidof firefox • Wrap with sed to create multiple -p switches. $ pidof firefox |sed 's/([0 -9]*)/-p 1/g‘ • Now combine with strace. $ strace $(pidof firefox |sed 's/([0 -9]*)/-p 1/g')

Blktrace
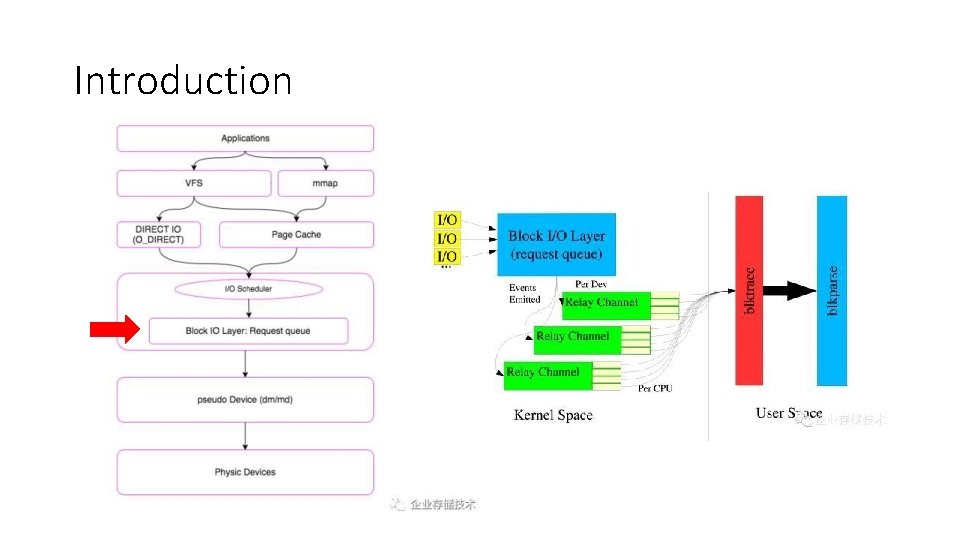
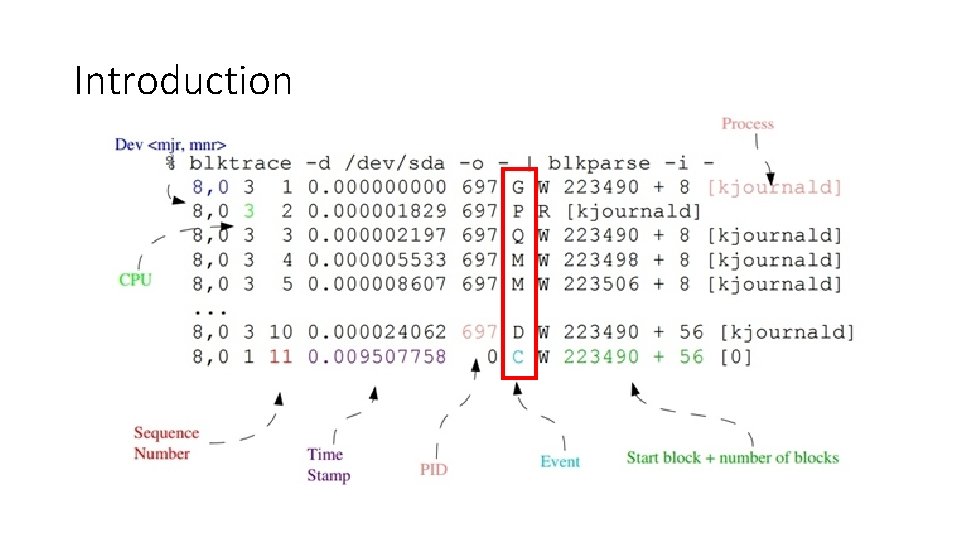
Introduction • blktrace is a block layer IO tracing mechanism which provides detailed information about request queue operations up to user space.
Introduction
Introduction
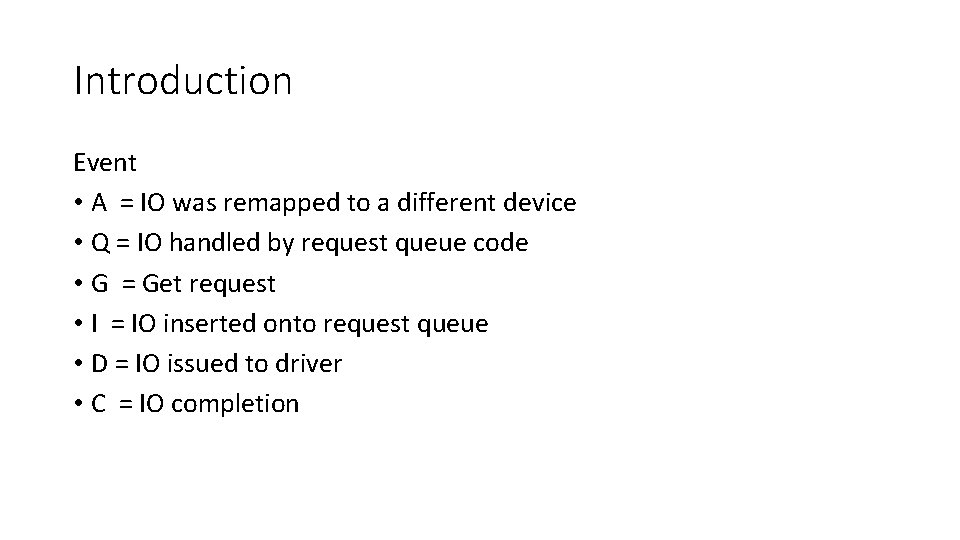
Introduction Event • A = IO was remapped to a different device • Q = IO handled by request queue code • G = Get request • I = IO inserted onto request queue • D = IO issued to driver • C = IO completion
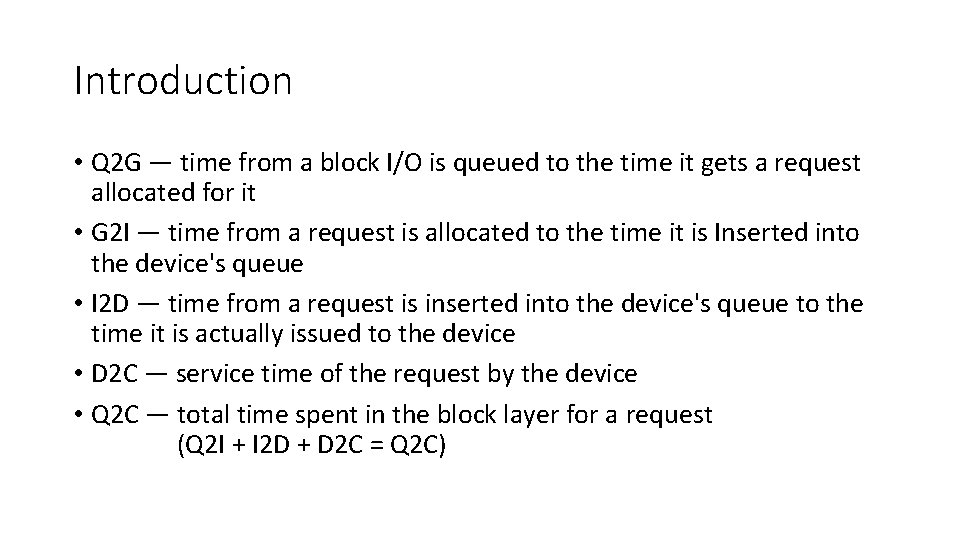
Introduction • Q 2 G — time from a block I/O is queued to the time it gets a request allocated for it • G 2 I — time from a request is allocated to the time it is Inserted into the device's queue • I 2 D — time from a request is inserted into the device's queue to the time it is actually issued to the device • D 2 C — service time of the request by the device • Q 2 C — total time spent in the block layer for a request (Q 2 I + I 2 D + D 2 C = Q 2 C)
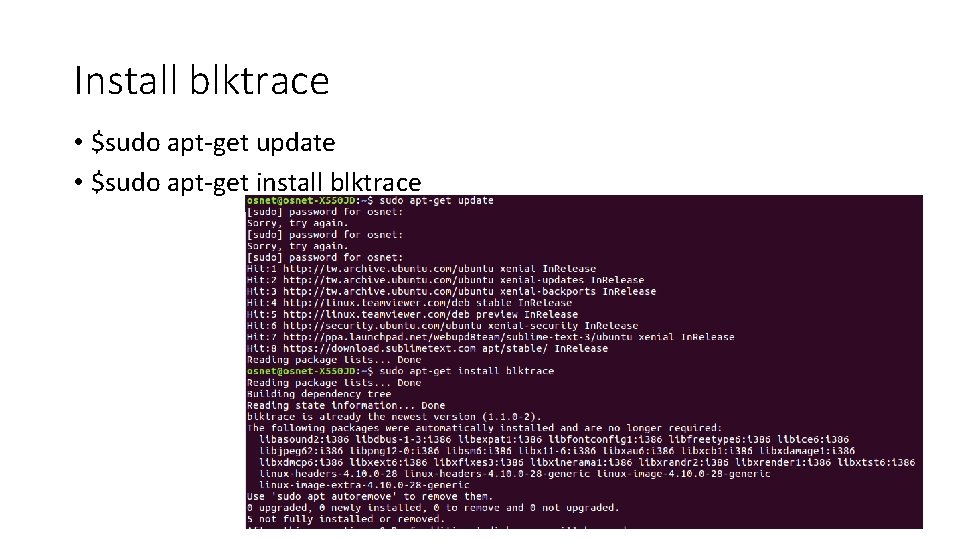
Install blktrace • $sudo apt-get update • $sudo apt-get install blktrace
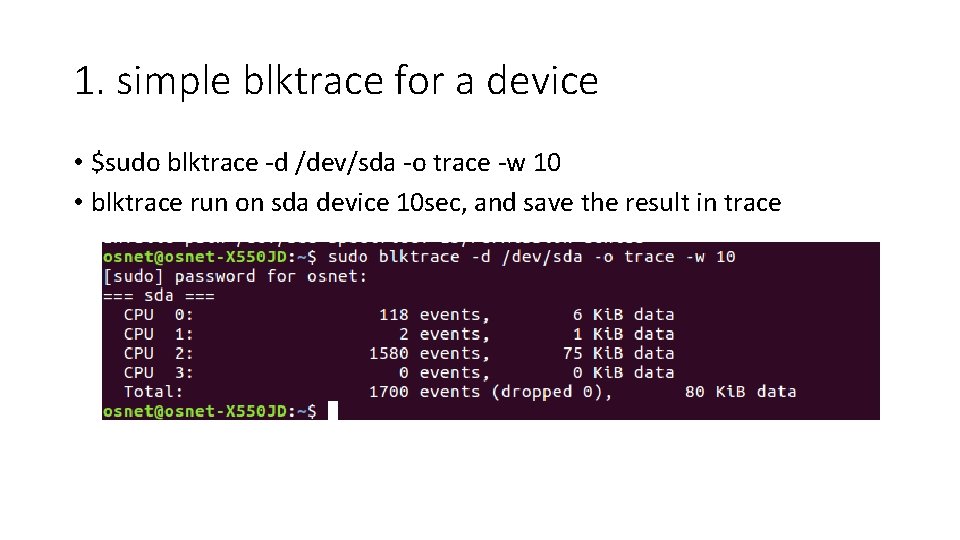
1. simple blktrace for a device • $sudo blktrace -d /dev/sda -o trace -w 10 • blktrace run on sda device 10 sec, and save the result in trace
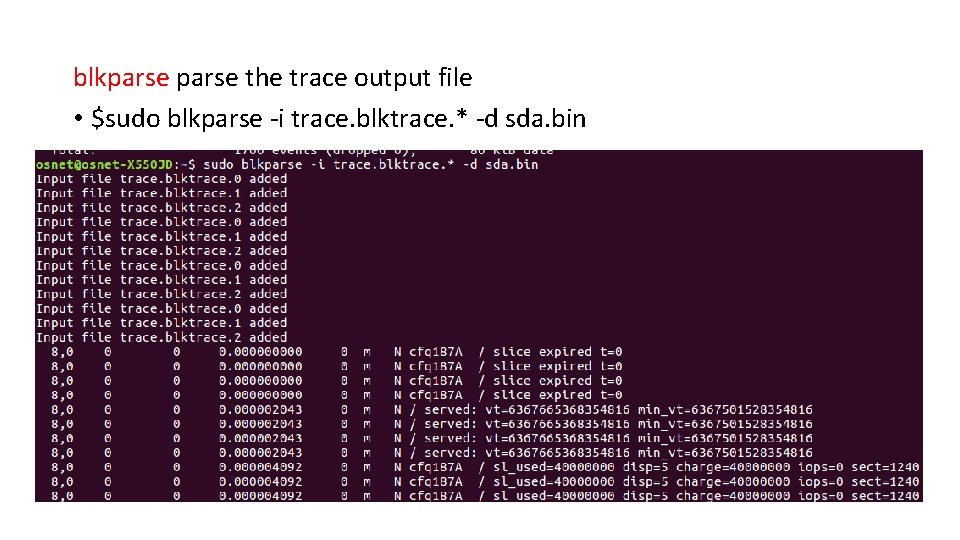
blkparse the trace output file • $sudo blkparse -i trace. blktrace. * -d sda. bin
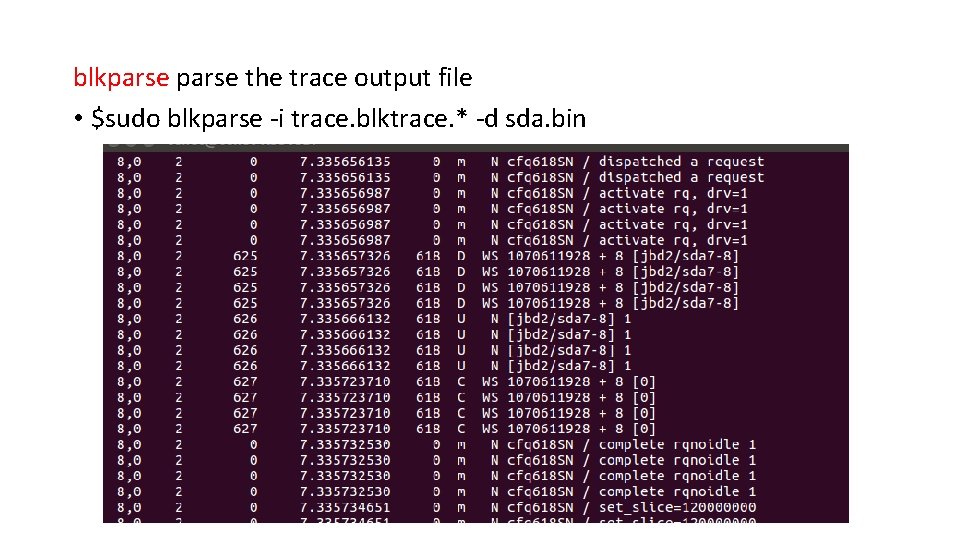
blkparse the trace output file • $sudo blkparse -i trace. blktrace. * -d sda. bin
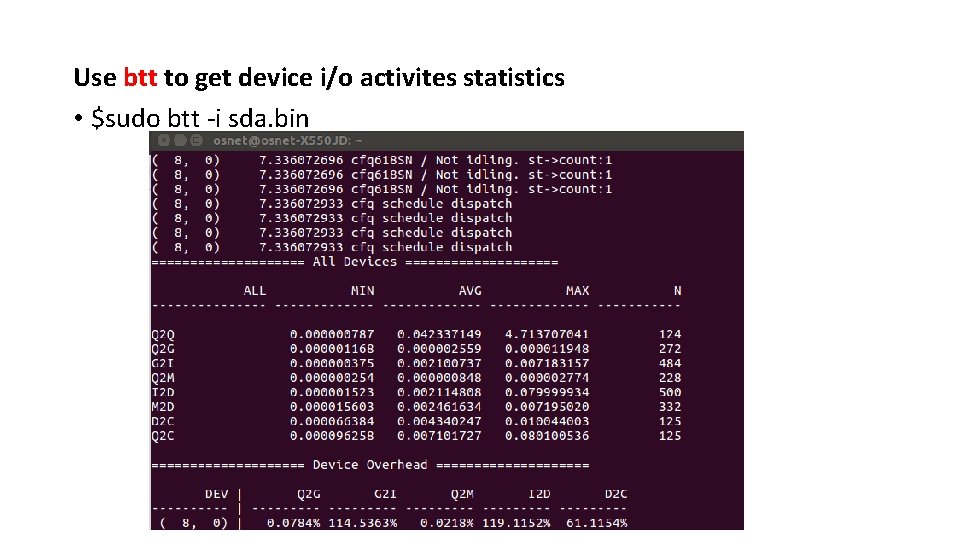
Use btt to get device i/o activites statistics • $sudo btt -i sda. bin

Strace&Blktrace on direct write
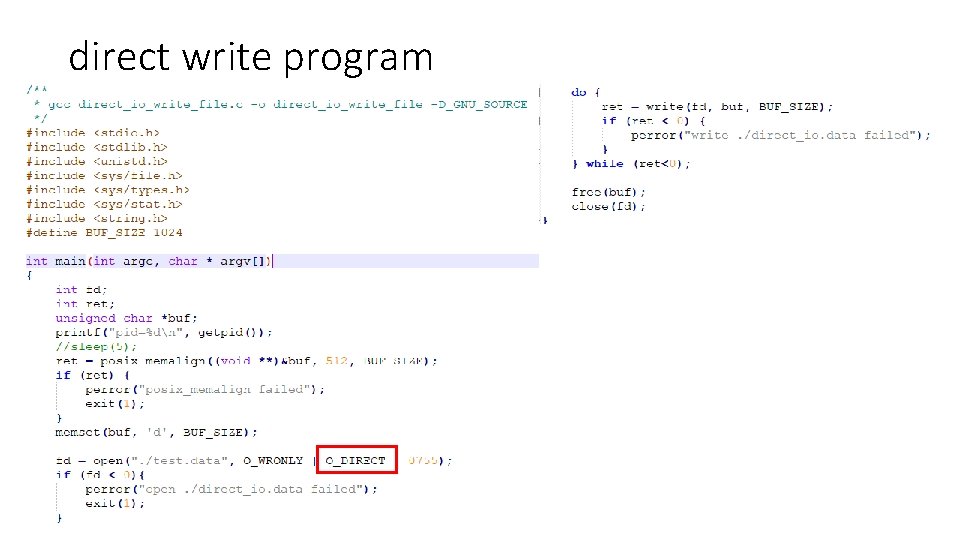
direct write program
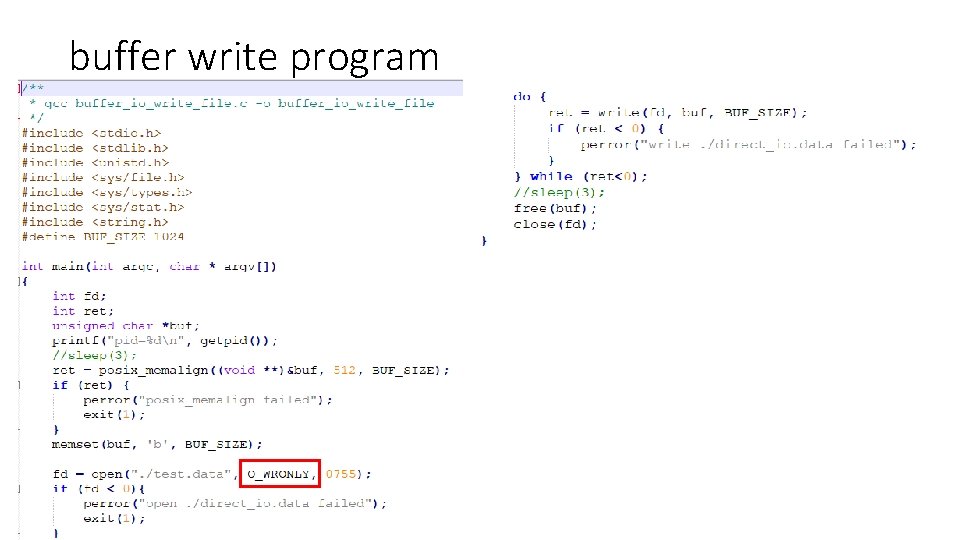
buffer write program
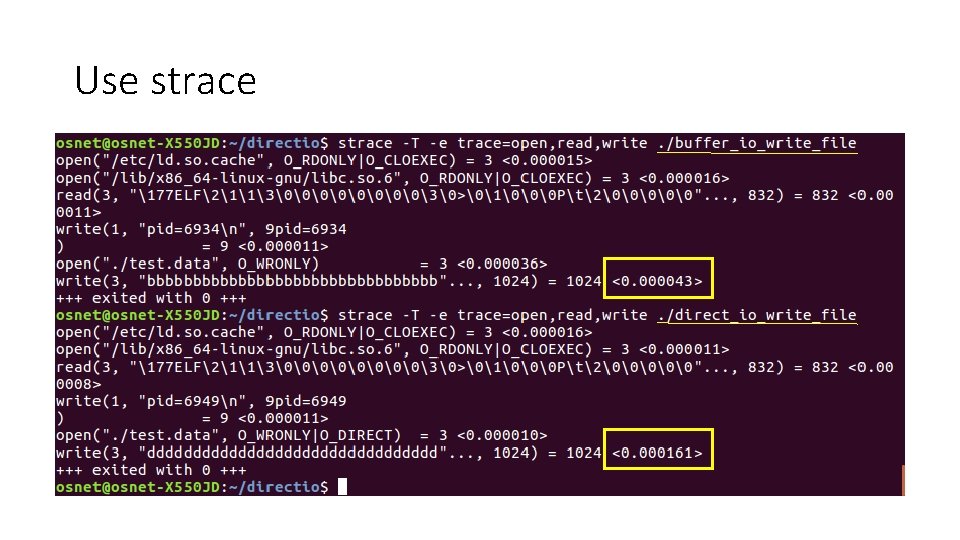
Use strace
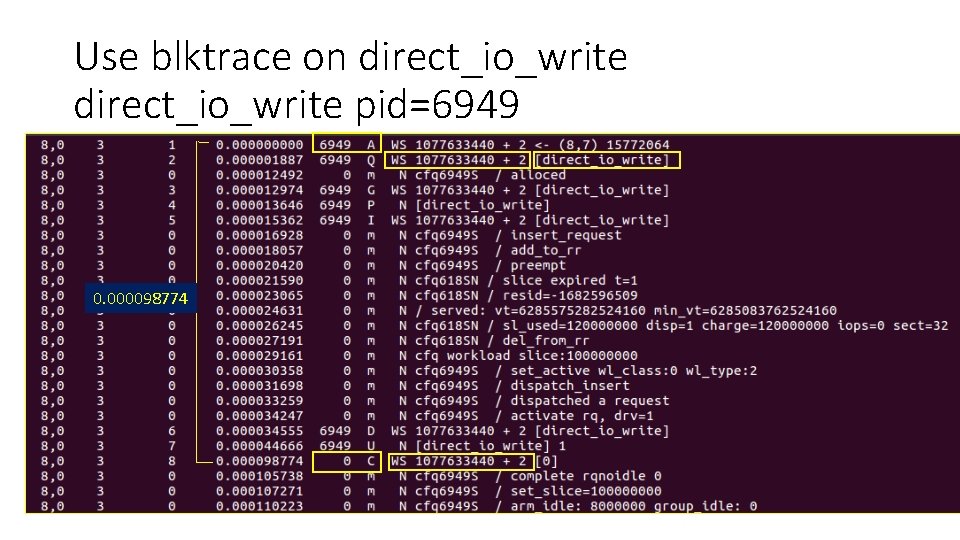
Use blktrace on direct_io_write pid=6949 0. 000098774
- Slides: 33