Storytelling with data Visualising data to improve learning


![REFERENCES • Wallsave (2013). blue matrix. [image online] Available at: http: //www. wallsave. com/wallpaper/1680](https://slidetodoc.com/presentation_image_h2/76352b940c125749db25d6a15b4f952a/image-9.jpg "REFERENCES • Wallsave (2013). blue matrix. [image online] Available at: http: //www. wallsave. com/wallpaper/1680")
- Slides: 9
Storytelling with data Visualising data to improve learning
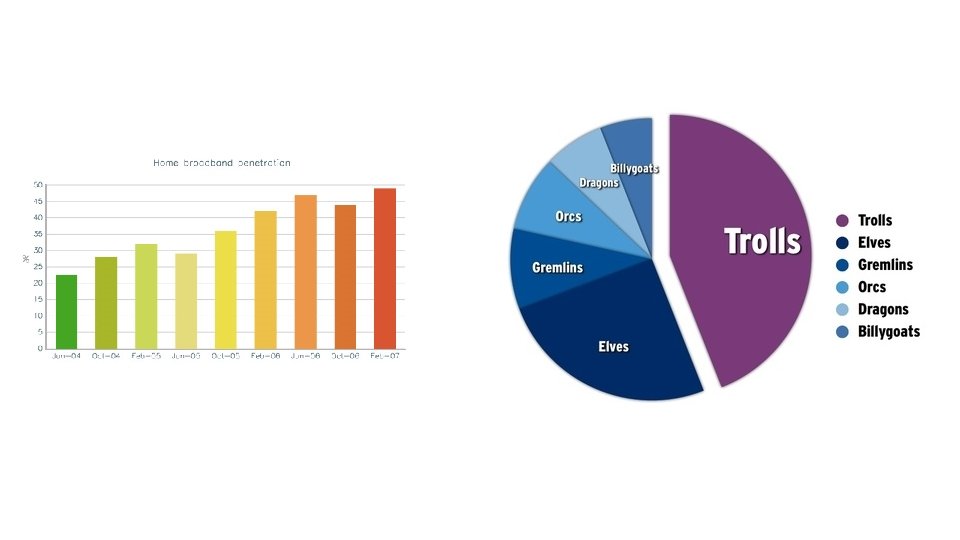
Retrieved 1 st August, 2013, from Wallsave, wallpapers Visualising data and improving understa
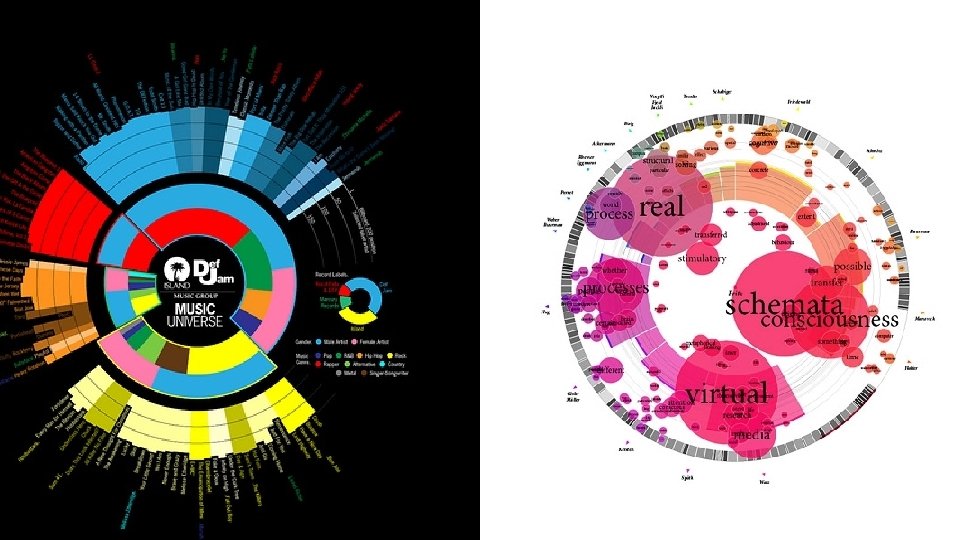
? Retrieved 1 st August, 2013, from Data Mining
Relying on visualised data, are there limitations? Retrieved 1 st August, 2013, from ABC, Big consumer data
CONCLUSION
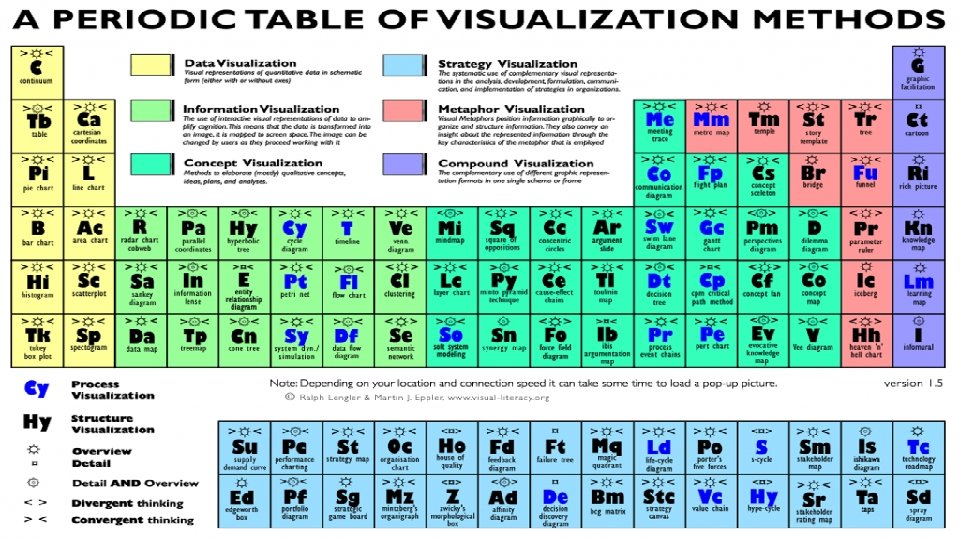
REFERENCES • Wallsave (2013). blue matrix. [image online] Available at: http: //www. wallsave. com/wallpaper/1680 x 1050/matrix-geek-blue-binary-code-425888. html [Accessed: 1 st Ausgust 2013]. • ABC (2013). digital world. [image online] Available at: http: //www. abc. net. au/technology/articles/2013/07/16/3804027. htm [Accessed: 1 st Ausgust 2013]. • JS Charts (2013). bar chart. [image online] Available at: http: //webdesignledger. com/resources/13 -useful-javascript-solutions-for-charts-and-graphs [Accessed: 1 st Ausgust 2013]. • Interaction Design Institute (2013). coloured circle graph. [image online] Available at: http: //www. munterbund. de/visualisierung_textaehnlichkeiten/essay. php [Accessed: 1 st Ausgust 2013]. • Rettberg, J. (2000). periodic table. [image online] Available at: http: //jilltxt. net/? p=2892 [Accessed: 1 st Ausgust 2013]. • Data Mining (2013). mapping the blogosphere. [image online] Available at: http: //datamining. typepad. com/gallery/blog-map-gallery. html [Accessed: 1 st Ausgust 2013].