Storm Hydrographs Aim To be able to analyse

Storm Hydrographs Aim: To be able to analyse the graph and explain the factors that affect the discharge and shape of the storm hydrograph
")
Today we are learning this content: 5. 3 (c)
 and")
Recap water budget/water balance • Water budget show the annual balances between inputs(precipitation) and outputs(evaporation and runoff) • P=R+E + S • Water is finite resource there is only so much water available to use at any given time. The water budget can be used to help people manage water supply and to predict whether or not there will be water shortage or catchment issues, such as falls in the water table. This is done with the aid of river regime.

River Regimes A river regime can be defined as the annual variation in discharge or flow of a river at a particular point or gauging station usually measured in cumecs. Much of this flow is not from immediate precipitation or run-off, but is supplied from groundwater between periods of rain. River regimes indicate the climate, type of geology and soils. For example in summer months glaciers retreat this causes meltwater which increases a rivers discharge.
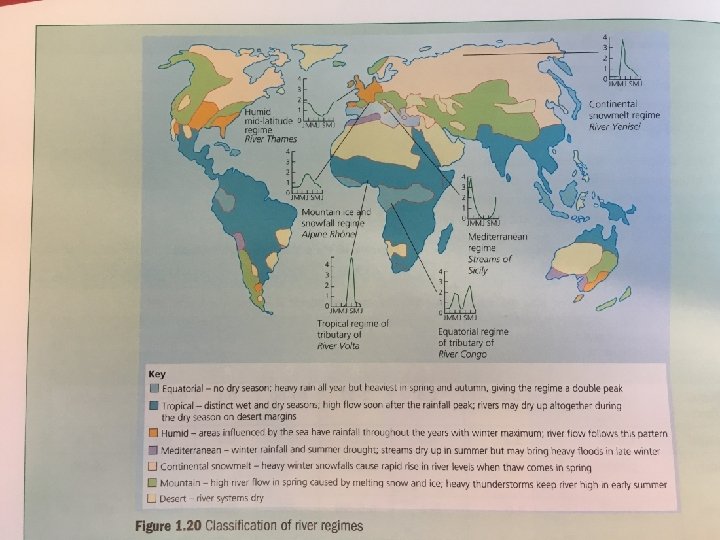

The effects of climate on varied river regimes

Physical Factors that have an effect on drainage basins and storm hydrographs • What are the physical and human causes of flooding? Bullet point • http: //www. acegeography. com/causes-offlooding. html • What do you think ‘flash flooding’ means? – A flash flood is a rapid flooding of geomorphic lowlying areas: washes, rivers, dry lakes and basins. It may be caused by heavy rain associated with a severe thunderstorm, hurricane, tropical storm, or meltwater from ice or snow flowing over ice sheets or snowfields.

Homework Please research the ‘Boscastle floods 2004’ Create a factfile of the events Add images and or diagrams Print off and keep in your file. https: //www. youtube. com/watch? v=w. Pwl 3 ye 5 n_M • https: //www. youtube. com/watch? v=xrb 0 Ea 0 O k. KU • • •

Extra Reading • http: //www. geography. learnontheinternet. co. uk/topics/discharge. html • Please print off and put in your file or make extra notes.

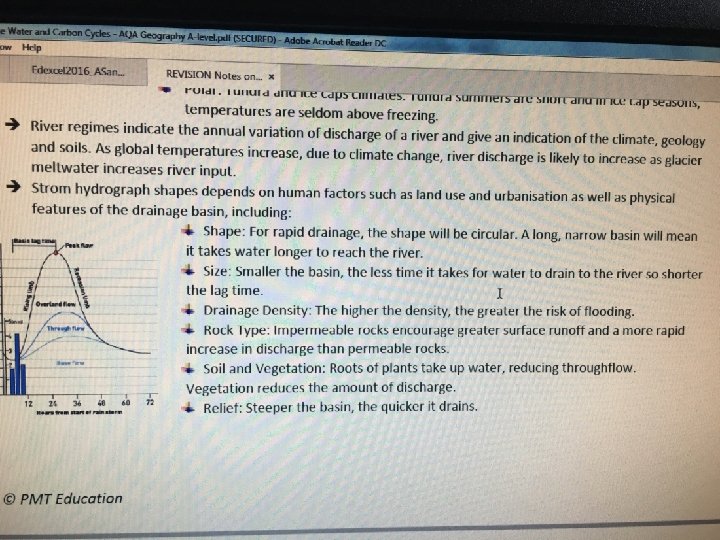
Storm Hydrographs • Very important you know what they look like • How to read them • You must know the various labels and where to put them Storm hydrographs show the variation of discharge within a short period of time, normally an individual storm or a group of storms not more than a few days in length. They can be described as ‘flashy’ (short lag time, high peak and steep rising limb) or ‘flat’ (long lag time, low Peak, gently rising limb) The storm hydrograph records the changing discharge of a river or stream in response to a specific input of precipitation. A hydrograph is a graph showing the rate of flow (discharge) versus time past a specific point in a river

Interpreting a storm hydrograph • Before the storm starts the main supply of water to the river or stream is through groundwater flow/base flow • As the storm develops the water comes from different routes: – Infiltration through the soil become throughflow – Some flows over the surface as overland flow – this reaches the river quickly

Key terms you need to know Rising limb The time interval between peak rainfall and peak discharge Peak discharge The normal day-to-day discharge of the river Lag time The part of a storm hydrograph in which the discharge starts to rise Falling/recessional limb The time when the rainfall reaches its highest Base flow The time when the river reaches its highest flow Peak rainfall The part of a storm hydrograph where the water in the river starts to decrease Use your key terms to label up the storm hydrograph diagram

Storm hydrograph Match the keyword from the hydrograph to the definition ______: the highest amount of rainfall per time unit _______: shows how quickly the discharge rises after a rain storm ________: the highest recorded discharge following a rainfall event ________: the time difference between peak rainfall and peak discharge ________: shows the reduced discharge once the main effect of runoff has passed. ________: the normal flow of a river when its water level is being sustained by groundwater flow _________: (does not always appear) marks the level of discharge above which flooding will occur.

Ap de ply m to on str at e Using page 17 of Hodder Answer the questions Within the handout

Questions • How does the shape of the basin affect the shape of a storm hydrograph? Circular basins have shorter lag time, elongated basins have long lag time and delayed response hydrographs • How does the steepness(relief) (relief of the profile affect the shape of a storm hydrograph? High steep slopes cause surface run off, low gentle slopes that allow infiltration and percolation • How does the drainage density affect the shape of a storm hydrograph? High drainage density means more streams and rivers per unit area, so water will move quickly to the measuring point. Low density means few streams and rivers per unit area, so water is more likely to enter the ground and move slowly through the basin. • How does geology affect the shape of a storm hydrograph? Impermeable rocks, such as granite, which restrict percolation and encourage rapid surface run-off. Permeable rocks such as limestone, which allow percolation and so limit rapid surface run off • How does the soil type affect the shape of a storm hydrograph? Low infiltration rate such as clays soils (0 -4 mm), high infiltration rate such as sandy soils(3 -12 mm)

Use the statements to complete the grid showing how different factors determine the shape of a hydrograph Ap de ply m to on str at e

AFL Ap de ply m to on str at e ‘Flat’ river ‘Flashy’ river

The impact of urbanisation on hydrological processes Ap de ply m to on str at • Use page 18 of Hodder to create a mind map of the impact urbanisation has on hydrological processes. The impact of urbanisation on hydrological processes e
")
Flooding and Urbanisation • Why does urbanisation increase the risk of flooding (6 marks) • Human factors increasing flood risk: – urbanisation, because towns and cities have more impermeable surfaces such as tarmac and this involves removing vegetation and soil. – Deforestation, because trees prevent sediment runoffs and forests hold more water than farms or grasslands. , Removing trees reduces the amount of water intercepted(catches the water) and increases run-off as there is a lack or drainage.

Synpotic Themes • Through their control of land use and land-use changes in a considerable number of countries, planners are major players. The decisions they make, for example about the location and amount of urban growth, can clearly affect the behavior of drainage systems. Their decision will impact most on run-off, water budgets and storm hydrographs. • Hydrographs are also likely to be affected by climate change, with a general prediction of more intense rainfall in many northern hemisphere areas which would create ‘flashy’ hydrographs and more flooding, while some tropical areas may become drier and hydrographs subdued (‘flat’ ‘subdued’ or ‘delayed’), with consequent navigation and water supply issues.

Review: Factors that affect the discharge of a river and the shape of the storm hydrograph. On the left hand side of the table add the word ‘HUMAN’ or ‘PHYSICAL’ for each factor.

Read through these important articles • http: //www. bbc. co. uk/news/uk-25929644 • http: //www. bbc. co. uk/news/uk-35246752 • This can be used when you do your synoptic work. Please refer back to and review.

Homework Please research the ‘Boscastle floods 2004’ Create a factfile of the events Add images and or diagrams Print off and keep in your file. https: //www. youtube. com/watch? v=w. Pwl 3 ye 5 n_M • https: //www. youtube. com/watch? v=xrb 0 Ea 0 O k. KU • • •
- Slides: 24