Stimulation Fracture Damage Increasing Fracture Pressure RII Gained


- Slides: 33

Stimulation

Fracture Damage Increasing Fracture Pressure RII Gained Injection Area Date

Fracture Damage Fracture Plugging and Ballooning Fracture Plugged RII Fracture Growth Date

Existing Fracture

Solid Deposition

Fracture Growth

Fracture Plugged

Determining Slope f(temperature, damage, pore pressure) RII f(fracture pressure) Date

Determining Slope F(Water Quality) RII F(Fracture Pressure) Date

Mechanism • Blue lines – Top line - fracturing pressure – Bottom line - gain area from fracture • Red lines – Positive gradient - matrix (stationary fracture) injection – Drop caused by the gain in area

Stimulation Flag • Frac. Pressure line intersects Gain: – Fracture completely filled – Dramatic rise in pressure • Stimulation: – Establish trend – Predict Intersection – Stimulate in advance

RII vs. Date Progressive Increase in the plugging slope Phillips Chalk Field

RII vs. Cumulative Injection Increasing Fracture Pressure Maersk A Field

Modes of Injection Red - Fracture Blue - Stationary Fracture Yellow - Plugged Maersk A Field

Modes of Injection Red - Fracture Blue - Stationary Fracture Yellow - Plugged Increasing Fracture Pressure Maersk A Field

Modes of Injection • Strong correlation from previous 2 plots • Change of injection mode between fracturing & matrix

Sandstone Example Constant Fracture Pressure BP PB Unit

Correlation with PEA 23 • PB Unit – PB Unit the gradient of bounding lines = 0 – Both mechanisms work together to create relatively constant RII – Both theories seem to correlate well

Correlation with PEA 23 • Maersk A Field – Account for increasing fracture pressure – Recalculate RII with increasing F. P. – Should see constant RII

RII From Fracture Pressure Maintained Injection Maersk A Field

Side Benefit • Predict/Estimate - Fracture pressure • Correlate to Step Rate Test

Stimulation Evaluation Stimulation RII Baseline Date

Definition • Baseline - best performance • RII - current performance • Stimulation - commonly acidizing

Stimulation Evaluation Slope Before RII DRII Before Date

Stimulation Evaluation Slope After RII DRII After Date

Factors • DRII - measure of damage • Slope - rate of damage accumulation

Example Elf Field 3

Example 2 Maersk Field A

Hall Plot Examination Improvement Ratio RII Field Data Ideal Case Stimulation Date

Ideal Hall Plot • Ideal or initial injectivity immediately following stimulation

Improvement Ratio • Shows the gain in injectivity

Hall Plot Elf Field 3

Hall Plot Maersk Field A
 Investor category rii
 Traitement du signal
 Increasing pressure
 Gained voter support by helping immigrants find jobs.
 Nothing venture nothing have
 Words means nothing
 The electrons available to be lost gained
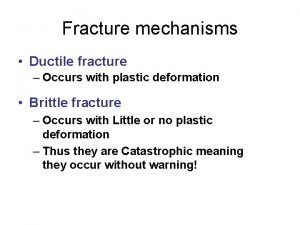
 Example of ductile fracture
 Formation fracture pressure
 Ems brain stimulation
 Coma stimulation techniques
 Electric stimulation springville
 Mogilner implants
 Selective demand stimulation example
 Besoins cognitifs
 Acth stimulation test
 Aided language stimulation
 Cognitive stimulation therapy training course
 Integrated brand promotion (ibp) is:
 Heide abelli
 Dttc cueing hierarchy
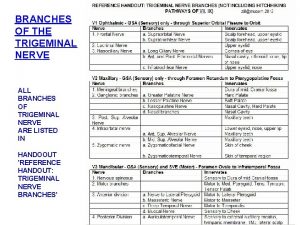
 Trigeminal nerve stimulation
 Muscle stimulation
 Transformational leader steve jobs
 Stimulation du nerf tibial postérieur
 Stimulation dalam pembelajaran
 Docteur iserentant
 Cognitive stimulation therapy training course
 Cortisol stimulation test results
 Is phototropism external or internal
 Sensory stimulation theory
 Transcranial magnetic stimulation
 Electronic muscle stimulation ankle sprain
 Noxious stimuli


