STFC Introductory Summer School Atomic processes and spectral


 1018")

 observed")


 • Doubly ionised Fe Group elements -")


 currents 100 -1000 m. A,")
 To vacuum pump High voltage ~600 V at 50 -1000")

 Pressure:")


 and B (electric quadrupole) hyperfine interaction constants required for Richard")


 S. • First large scale, systematic")
 1018")
 AIM: composition, formation and evolution of the Galaxy")


 Lifetimes are commonly measured with Laser Induced Fluorescence")


 We")

- Slides: 91
STFC Introductory Summer School Atomic processes and spectral modelling in astrophysics Measurement of atomic parameters of astrophysical relevance Juliet C Pickering QUB, Belfast, 31 st August 2015
Measurement of atomic parameters of astrophysical relevance (The need for both experimental and theoretical spectroscopy) 1. Background 2. Atomic data needs 3. Laboratory spectroscopy - instrumentation 4. Large scale spectral analyses 5. Log gfs for astrophysics
1. Background Early Beginnings. Spectroscopy – experiment and theory
First identification of elements in the solar atmosphere “It can be concluded that the spectrum of the sun with its dark lines is just a reversal of the spectrum which the atmosphere of the sun would show by itself. Therefore, the chemical analysis of the sun's atmosphere requires only the search for those substances that produce the bright lines that coincide with the dark lines of the solar spectrum. ” Chemical Analysis by Observation of Spectra, GUSTAV KIRCHHOFF AND ROBERT BUNSEN, Annalen der Physik und der Chemie (Poggendorff), Vol. 110 (1860), pp. 161 -189 (dated Heidelberg, 1860)
Helium
“red window”, H band Allende Prieto et al, Astron. Nach. 329 (9 -10) 1018 -1021 (2008)
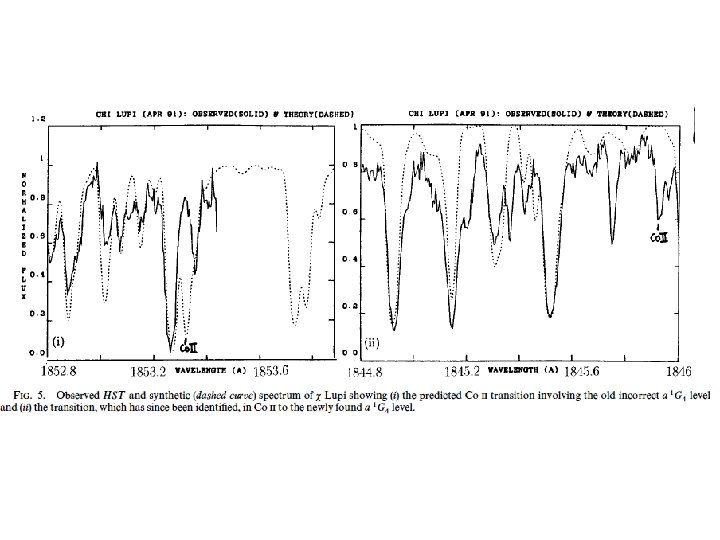
Section of GHRS VUV spectrum of c. Lupi Page 10 © Imperial College London
Observation + experimental and theoretical spectroscopy synthetic spectrum GHRS observed IUE (hi res) observed Leckrone et al. (1998) -LUPI
Need for new accurate and complete atomic data in the UV and VUV highlighted by HST c. Lupi Pathfinder project (1990 s) • Chemically peculiar stars, and sharp-lined B, A stars – sparse visible spectrum – but rich VUV spectra • High resolution spectrum c. Lupi recorded with HST and analysis undertaken • Many spectral features initially unidentified
Nature Editorial highlighting needs for atomic data for the latest telescopes “Some physicists are now pointing out the irony that multimillion-dollar projects, such as the SDSS, are producing data that cannot be analysed because of a failure to support much cheaper lab work on the ground. ” The Editors. Nature, 503: 437, 2013
Measurement of atomic parameters of astrophysical relevance (The need for both experimental and theoretical spectroscopy) 1. Background 2. Atomic data needs 3. Laboratory spectroscopy - instrumentation 4. Large scale spectral analyses 5. Log gfs for astrophysics
Solar Photospheric Elemental Abundances ? Copyright 2010, Professor Kenneth R. Lang, Tufts University
Section of GHRS VUV spectrum of c. Lupi Page 17 © Imperial College London
Solar photospheric abundance of the elements. The abundances are given in astronomical scale, a logarithmic scale normalised such that A[H] = 12, and are by number (of atoms), not mass.
A section of the HST/STIS spectrum of the B star γ Pegasus with identified lines labelled. (Adelman, private communication). ____ observed spectrum ----- synthetic spectrum
HR diagram
Ionisation equilibria for Cr and Fe (CHIANTI) • Doubly ionised Fe Group elements - maximum ionisation fraction 25, 000 -30, 000 K • Significant over even wider range, eg Cr III >10% ion fraction 16, 000 -80, 000 K Mazzotta et al, A&AS, 133, 403, 1998
Occurance and strength of lines depends on: • Amount of element present – abundance • Probability that an electron is in a particular energy level – this depends on T… • Probability that a photon of a given wavelength will be absorbed (transition probability – oscillator strengths – opacity)
Atomic data needs • Accurate wavelengths - accurate to 1 part in 107 (0. 1 mÅ, 0. 001 cm-1) • Atomic energy levels • Oscillator strengths (transition probabilities) – accurate to 10% • information on line broadening effects such as hyperfine structure and isotope shifts +. . . For all elements and ionisation stages of interest
Databases
NIST atomic data evaluation
Measurement of atomic parameters of astrophysical relevance (The need for both experimental and theoretical spectroscopy) 1. Background 2. Atomic data needs 3. Laboratory spectroscopy - instrumentation 4. Large scale spectral analyses 5. Log gfs for astrophysics
Laboratory measurements require: Wide spectral range: IR – visible- UV- VUV; High resolution, accurate wavelength calibration; Accurate intensity calibration Page 27 R Blackwell_Whitehead Mn I Branching fractions, level lifetimes transition probabilities f values
Options available to record atomic spectra ? Grating spectrometer Fabry-Perot interferometer Laser spectroscopy Fourier transform spectroscopy Further reading: Spectrophysics, Thorne, Litzen & Johansson, Springer
Cobalt Comparison between section of FTS and grating spectra in VUV FTS Grating
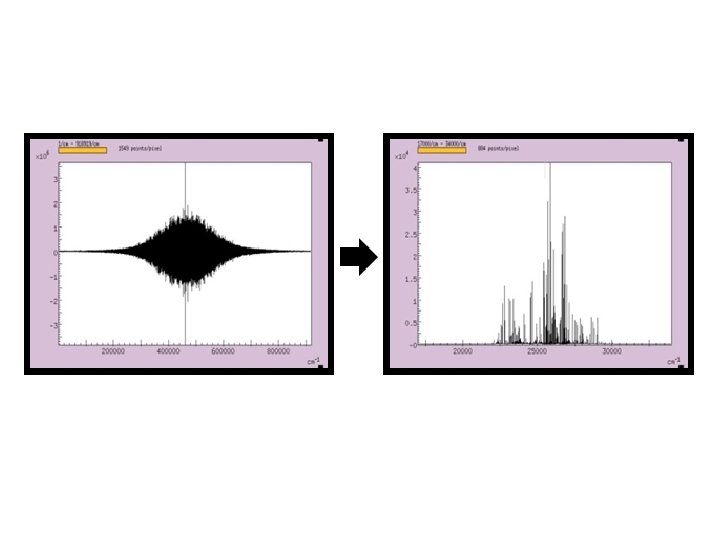
FTS ideal for improving atomic data base • high resolving power R = 2 L/λ • Linear wavenumber scale and high wavelength accuracy • large and variable free spectral range • photon noise limited • wavelength range: IR- VUV 139 nm • Slowly varying photometric response
Brief background…VUV FTS • No FTS at VUV wavelengths prior to 1990 s • First laboratory FT spectrometer designed and developed for VUV at Imperial College • Beamsplitter Mg. F 2 • R~2 million at 200 nm
Example: Imperial college fts laboratory • • Part of the Space & Atmospheric Physics Group 2 FT spectrometers Maximum path difference 20 cm Resolving power: Resolving power 2, 000 @ 200 nm R = 2 L/λ Resolution limit 0. 025 cm-1 Resolution Maximum free spectral range 64, 000 cm-1 R= 1/2 L Wavelength range covered 1. 15 µm 135 nm • Transition wavelengths: few parts in 108 uncertainty • FTS linelist energy level uncertainty 0. 002 cm-1
IMPERIAL COLLEGE FTS LABORATORY Wavelength range 1. 15 µm 135 nm, Resolving power 2 million at 200 nm Wavelength standards used to give absolute wavelengths (few parts in 108 uncertainty) Intensity calibration using standard lamps FT Visible – VUV spectra supplemented by: -IR FT spectra measured on NIST IR FTS, Lund IR FTS, Kitt Peak FTS - beyond 135 nm cut-off in VUV, spectra recorded with Normal Incidence Vacuum Spectrograph (NIVS) at NIST
Visible – VUV spectra from Imperial College FT spectrometer are supplemented by IR FT spectra (measured on NIST IR FTS, and beyond 135 nm cutoff in VUV on Grating spectrograph at NIST) Large and small scale analyses of the accurate new atomic spectra undertaken – often with international collaboration Normal Incidence Vacuum Spectrograph (NIVS) at the National Institute of Standards and Technology (NIST), Maryland, USA.
Light sources: Hollow cathode lamp (neutral, singly ionised species) currents 100 -1000 m. A, filler gases Ar, Ne, He typically with 0. 2 -4 mbar pressure Page 36
Hollow-cathode Light Source (HCL) To vacuum pump High voltage ~600 V at 50 -1000 m. A Ne and/or Ar gas at 1 -3 mbar Water cooled Glass Anode Glass Cathode Designed and manufactured at Imperial College Anode
Comparison : Co hcl spectra with Ne or Ar gas Co-Ar Co-Ne
Penning Discharge lamp Currents: 200 -1800 m. A (singly and doubly ionised species) Pressure: 10 -4 mbar Ne Page 39
Cr III: A section of the Cr–Ne PDL spectrum recorded by the IC VUV FTS, with a small section expanded. Fig 1: A comparison between the FTS (top) and grating (bottom) spectra for Co III, 54 200 to 54 290 cm-1. Reference UV wavelengths of Cr III measured by Fourier Transform spectrometry, D G Smillie, JC Pickering, PL Smith MNRAS 390, 733 -740 (2008)
CREATING THE LINELIST Spectrum extraction FTS: Fourier transform Grating: Scan image plate, integrate over image pixels Line Fitting Voigt profile. If blended: Centre of gravity Accuracy for FTS spectra ~ twice that for grating Wavenumber/ Wavelength Calibration FTS: standard lines (e. g. buffer gas), linear shift Grating: lines throughout spectrum, dispersion not linear (larger error) Intensity Calibration Standard lamps (Deuterium: UV, Tungsten: Vis. /IR)
The Spectrum and Term Analysis of V I, Thorne AP et al. Ap. JS, 192: 11, 2011.
V I energy level system
Measurement of atomic parameters of astrophysical relevance (The need for both experimental and theoretical spectroscopy) 1. Background 2. Atomic data needs 3. Laboratory spectroscopy - instrumentation 4. Large scale spectral analyses 5. Log gfs for astrophysics
Examples: Large scale analyses Spectral term analysis can be compared to the problem of trying to put together the pieces of a complicated jigsaw puzzle where: • the pieces never fit exactly, • some pieces fit spuriously, • some critical pieces are missing and • there are pieces present that belong to one or more entirely different puzzles. . . • But – picture on the box is not clear – only approximate - theory
TERM ANALYSIS Predicted lines Observed linelist Compare linelists Data input/output Processes Unidentified lines Identified lines Search for new levels and lines Fits: improve level accuracy Improved levels F • Predictions: level location and strong transitions • Unidentified lines combined with known levels • New level located • Spurious coincidences possible E D Selection rules C B Reduce by: Relative intensity compared with theory More accurate lines: smaller search tolerance! A SPAT 20/02/06
Cowan code – energy level eigenvalue calculations, example output:
Example of improvement possible in identification of spectral lines in a particular spectrum. 219. 0 nm 219. 3 nm © Imperial
© Imperial
V I energy level system
The Spectrum and Term Analysis of V I, Thorne AP et al. Ap. JS, 192: 11, 2011.
V I levels: comparison of revised and “old” levels. Typical level uncertainty of revised levels ~. 002 cm-1
V II differences in new and previously published energy level values Thorne et al , Ap. JS 207: 13 (2013)
Large scale Term analyses - progress: 3 d transition group: wavelengths and energy levels Fe I: multiplet table, over 400 new levels Fe II: over 500 new levels Ni I: identified lines doubled and isotope shifts measured Ni II: analysis in progress Co I: many new levels and extended hfs analysis Co II: no. identified lines doubled, 222 new levels Cr I: almost complete, Cr II: UV data recently published (NIST) Ti I: 100 new levels, Ti II published V I & II - analysis completed, new energy levels found Mn I analysis almost complete, and Mn II underway
Progress doubly ionised species Motivation for studies of third spectra: Hot stars: eg B stars Teff ~ 12 000 - 30 000 K Advances: HST GHRS, STIS (R~100, 000 in range 115 -170 nm) Sharp lined, early B MS stars – chemical elemental abundances chemical evolution, metallicity gradient of Galaxy recent enhancements of moderate-heavy elements, current chemical state of local region Check stellar nucleosynthesis models
Section of spectrum of hot star g Pegasus Courtesy of Charles Proffitt, log g 4, Teff 22670
IC VUV FTS, Penning lamp, Cr cathodes Co III and Cr III SPECTRA
Cr III: A section of the Cr–Ne PDL spectrum recorded by the IC VUV FTS, with a small section expanded. Fig 1: A comparison between the FTS (top) and grating (bottom) spectra for Co III, 54 200 to 54 290 cm-1. Reference UV wavelengths of Cr III measured by Fourier Transform spectrometry, D G Smillie, JC Pickering, PL Smith MNRAS 390, 733 -740 (2008) 140 lines, 4 p-4 s transitions, 38000 -49000 cm-1
Wavenumber differences between the FTS measured Cr III lines and Ritz wavenumbers of Ekberg (1997) Errors bars represent the FTS line wavelength uncertainties. Reference UV wavelengths of Cr III measured by Fourier Transform spectrometry, D G Smillie, JC Pickering, PL Smith MNRAS 390, 733 -740 (2008)
Co III Comparison between section of FTS and grating spectra in VUV FTS: 260 – 156 nm 535 classified lines + Grating: 250 – 61 nm 591 classified lines 215 of 288 levels revised. Order of magnitude improvement in accuracy Grating
254 of 288 levels revised. Order of magnitude improvement in accuracy Darren Smillie, Ph. D thesis, 2008
Co III energy level differences between energy levels of new work and those in the literature. Error bars (one standard error) give the energy level uncertainties of our revised levels. 535 classified lines (FTS) 39, 000 – 64, 000 cm-1 + 591 (grating) 40, 000 – 164, 000 cm-1 215 of 288 levels revised. Order of magnitude improvement in accuracy
Section of VUV FTS spectrum of doubly ionised iron
Fe III ENERGY LEVELS Visible, IR transitions: NIST IR-vis FTS 4 d/5 s-4 p transitions: NIST NIVS 4 p-4 s transitions: IC VUV FTS
Transitions observed in grating spectra
Line broadening effects: hyperfine structure V I Spectrum 3500 - 67000 cm-1 (149 nm – 2. 8 m) From Thorne, Pickering & Semeniuk, Ap. JS 2011
I=5/2 Hyperfine Structure occurs due to the energy of the nuclear magnetic dipole moment in the magnetic field generated by the electrons, and the energy of the nuclear electric quadrupole moment in the electric field gradient due to the distribution of charge within the atom Mn I transition from 3 d 6(5 D)4 s a 4 D 3/2 – 3 d 5(6 S)4 s 4 p(3 P) z 4 P 5/2, IR FT spectrum.
Accurate A (magnetic dipole) and B (electric quadrupole) hyperfine interaction constants required for Richard Blackwell-Whitehead • Accurate wavelengths • Line shifts/broadening Ø Correct Stellar Abundance Determination New Measurements • HFS of 208 lines in Mn I • HFS constants for 124 levels. • 68 levels have no previous laboratory HFS constants. • Uncertainty 10 -4 to 5× 10 -4 cm-1 Hyperfine structure large scale studies of Co I, Mn I, others underway V, Co II, Mn II…
NLTE analysis of Co I /Co II lines in spectra of cool stars with new laboratory hyperfine splitting constants M Bergemann, J C Pickering, T Gehren, MNRAS 401, 1334– 1346 (2010)
An example of a Co II transition in solar spectrum: used to calculate cobalt abundances with non-LTE and 3 D hydrodynamical model of atmosphere. … observed __ fitted Good fit with NLTE + new hfs A factor. Poor fit with unknown A factor
Ta II © Imperial College London
Measurement of atomic parameters of astrophysical relevance (The need for both experimental and theoretical spectroscopy) 1. Background 2. Atomic data needs 3. Laboratory spectroscopy - instrumentation 4. Large scale spectral analyses 5. Log gfs for astrophysics, aka f-values, transition probabilites
Measurement of atomic parameters of astrophysical relevance (The need for both experimental and theoretical spectroscopy) 5. Log gfs for astrophysics, aka f-values, transition probabilites a: motivation b: experimental methods for measurement c: examples
A: Motivation for new measurements of f-values non-LTE and 3 D hydrodynamical models of the Sun and stellar atmospheres Realistic model atmospheres & line forming processes + atomic data of high accuracy (few % log gf, λ ~1 part in 107) = accurate elemental abundances revisions of solar metallicity Z … implications for solar interior models, models and standard solar model as understood by helioseismology (discrepancies: sound speed variation and implied depth of convection zone) Solar Z used as a standard, so implications for galactic chemical evolution… evolution
The new 3 D-based solar photospheric composition has also led to challenges for the standard solar model as understood by helio-seismology Solar interior models computed with new lower abundances disagree by much more than estimated measurement errors of the extremely precise helioseismological determinations of the depth of the solar convective zone, of the sound speed profile, and density profile. Chemical Controversy at the Solar Surface, Physics World, 18, No. 2, 26 (2005)
New atomic data and new models: 3 D and NLTE, are giving new elemental abundances for the Sun, a new cosmic yardstick Grevesse, Asplund & Sauval (using limited new accurate atomic data (C, N, O, Na to Ca, Fe as well as Ne and Ar) reported a new solar metallicity Z= 0. 012, almost a factor of two lower than past values. They commented that it is apparent that the accuracy of elemental abundances is now no longer limited mainly by the stellar models, but rather by the quality and quantity of atomic data available. [N Grevesse, M Asplund, AJ Sauval, Space Sci R. 130: 105– 114(2007)]
IR f-values Low Mass Stars/sub stellar objects/ultra cool dwarf stars Opacity is dominated by molecular lines, and neutral spectra: Ti I, Mn I, K I, Na I, etc IR experimental atomic database is insufficient. LMS spectrum analyses are currently based to a large extent on calculated atomic data for IR. Artwork by Jon Lomberg
APO Galactic Evolution Experiment APOGEE Majewski (PI, UVa) S. • First large scale, systematic , high resolution (R~ 24, 000) spectroscopic survey in NIR, H band 1. 5 -1. 7 µm • Access to dust obscured galaxy • giant stars across the Galactic plane, bar, bulge and halo Galactic evolution. • 0. 1 dex precision abundances for ~15 chemical elements C, N, O, Mg, Al, Si, Ca, Ti, Cr, Fe and Ni for all surveyed stars + Na, S, V, Mn, Co and other elements for brighter stars • 100, 000 stars
“blue window” H band Allende Prieto et al, Astron. Nach. 329 (9 -10) 1018 -1021 (2008)
Gaia (high resolution, 847 -874 nm) AIM: composition, formation and evolution of the Galaxy high R mode, near IR 847 -874 nm, lines of neutral d and s group elements. Example: 11 Fe I laboratory measured loggfs available in the Gaia range accuracy typically graded D+ to C, uncertainties within 25% - 50% in compilation of Fe I f-values [JR Fuhr & WL Wiese, J. Phys. Chem. Ref. Data, Vol. 35, No. 4, 2006]
Atomic data for iron group element IR f-values Melendez and Barbuy Ap. JS 1999 – list of astrophysical log gfs, several hundred IR lines (AFGK stars) J band 1 -1. 34 m, H band 1. 49 -1. 8 m Laboratory measured f values λ > 1000 nm Other IR f-values for iron group elements are planned for measurement by FTS – carefully selected…
B: Measuring Transition Probabilities Transition probabilities can be obtained from emission spectra Spontaneous Emission Absorption Stimulated Emission E 2 n 12 E 1 A 21 B 12 B 21 Einstein coefficients • In this simple case, the transition probability (A 21) is found by inverting the upper level lifetime (t 2). • In general upper level populations decay through many transitions, all of which must be studied to obtain A 21.
Branching Fractions Decay to a single level I I E 2 E 1 n 12 n n Decay to multiple levels E 2 E 1 I I BF = Branching fraction I = Integrated line intensity
Measuring Upper Level Lifetimes (t 2) Lifetimes are commonly measured with Laser Induced Fluorescence (LIF) E 2 205 - 720 nm UV - visible E 1 Example of a measured Lifetime decay curve for V I y 4 G 5/2 Excitation = 10. 7 ns, Lifetime = 72 ± 4 ns 1) A laser pulse is used to excite electrons in a populated lower level. 2) The upper level is populated 3) After time the electrons de-excite
Measuring Branching Ratios • Branches from IR to VUV are required. • Plus Theoretical Calculations! Calculations Branching Ratios for the z 6 D 5/2 upper energy level in Mn I • Majority of oscillator strengths available are theoretical – but these need checks with observations!
OSCILLATOR STRENGTHS • Different excitation conditions changes to level population • Oscillator strengths relative intensity • Accurate abundance analysis Branching fractions Lifetimes EU Laser induced fluorescence 40% 10% 50% EL 1 intensity EL 2 EL 3 time
Challenges for IR f-values: measuring Upper Level Lifetimest 2 Lifetimes are commonly measured with Laser Induced Fluorescence (LIF) E 2 205 - 720 nm UV - visible E 1 Critical Fe I transitions for the APOGEE project There are no transitions to populated lower levels No lines in the visible/UV LIF lifetimes are unavailable 1) A laser pulse is used to excite electrons in a populated lower level. 2) The upper level is populated 3) After time the electrons de-excite
Solution: Invert the Problem Recall from earlier Line strength is mainly linked to: • Stellar properties (e. g. temperature) • Chemical abundance • Absorption transition probability The APOGEE Solar needs Fe abundance transition is known. Use probabilities it to find transition to find abundances probabilities Estimate t 2 from theory Use Solar spectrum to refine A 2 i
Some success with IR f-value measurements A section of our results table: 1) We have found a reliable method for obtaining IR transition probabilities 2) Our work for APOGEE is almost doubling the number of Fe transition probabilities available in the IR. Sc Ti V Cr Mn Fe Co Ni Cu Zn – 45 7 – 26 51 – 4 – 1
Conclusions International effort underway to provide high quality laboratory measured atomic data for astrophysics Examples of laboratories undertaking measurements of atomic data for astrophysics are the groups in NIST (USA), Imperial College London, Wisconsin (USA), Lund (Sweden), Liege/Mons (Belgium) etc This session has only covered practical details of measurements for low ionisation stages, measurements for higher charge states are far more challenging Theory and experiment are a vital combination in the pursuit of accurate atomic data for astrophysics applications There remains much to be done!