Stewart R H 2005 Introduction to Physical Oceanography


 A quasi-periodic occurrence when large-scale abnormal pressure and sea-surface temperature")
 Walker Circulation: Connection between atmospheric pressure centers in the equatorial")

 Oscillation in surface air pressure between the tropical eastern and the")
 Walker Circulation: Weakening or reversal in equatorial trade winds, and")
 Walker Circulation: Strengthened equatorial trade winds, and convective circulation H")


 Pacific Decadal Oscillation: (top) SST based on the leading EOF")
 • North Atlantic Oscillation (NAO) •")
 Large scale seesaw in atmospheric mass between the subtropical high")
 http: //www. ldeo. columbia. edu/res/pi/NAO/ Positive NAO Index : Negative")
 opposing atmospheric pressure patterns in northern middle and high latitudes Relatively")
 The MJO (Madden and Julian, 1971) is the dominant mode of")


 Waves Vorticity is the measure of spin or rotation in")
 Alternation of Easterly and Westerly winds in Equatorial Stratosphere Time–height plot")
 http: //www. cpc. ncep. noaa. gov/products/analysis_monitoring/lanina/enso_evolution-status-fcsts-web. pdf")
 http: //www. cpc. ncep. noaa. gov/products/analysis_monitoring/lanina/enso_evolution-status-fcsts-web. pdf")


- Slides: 49
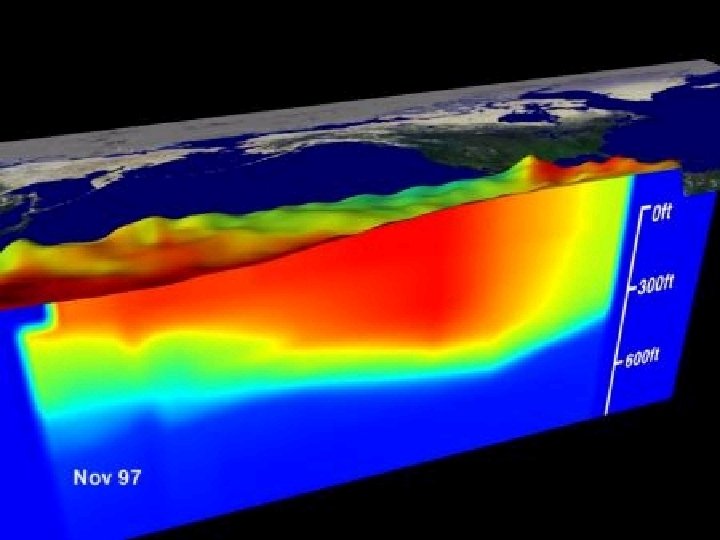
Stewart, R. H. , 2005, Introduction to Physical Oceanography, Chapter 11: http: //oceanworld. tamu. edu/resources/ocng_textbook/chapter 14_01. htm, accessed 24 September 2014. Equatorial Oceanic Processes in ange st h c t ine bu East-We l c l o er erm rom ow th rmocline f fic → warm l l a h S f the l Paci ast o a e c i p p o E o sl the tr t than s s s e o r W n ac ater i w p e de The tropical regions are characterized by a thin, permanent, shallow layer of warm water over deeper, colder water → stratified • • Figure 14. 2 The mean, upper-ocean, thermal structure along the equator in the Pacific from north of New Guinea to Ecuador calculated from data in Levitus (1982). Countercurrents north and South of equator Undercurrent? • • • Winds drive East-West flow confined to shallow surface layer (~<50+ m) along equator • Figure 14. 3 Average currents at 10 m calculated from the Modular Ocean Model driven by observed winds and mean heat fluxes from 1981 to 1994. The model, operated by the NOAA National Centers for Environmental Prediction, assimilates observed surface and subsurface temperatures. From Behringer, Ji, and Leetmaa (1998). Shallow thermocline but change in slope from East to West Ekman transport along equator → Divergence → Upwelling Upwelled water in West is warmer, upwelled water in East is colder East-west temperature gradient drives a zonal circulation in the atmosphere = Walker circulation. Variations in temperature gradient influences Walker circulation, and vice versa. Feedback can lead to an instability, the El Niño. Southern Oscillation (ENSO)
Walker Circulation This diagram shows the Walker Circulation, a vast loop of air above the equatorial Pacific Ocean. See below for an alternate depiction. (Illustration by Gabriel Vecchi, UCAR. ) This diagram and the one at top show two different views of the Walker Circulation, a vast loop of air above the equatorial Pacific Ocean. (Illustration by Gabriel Vecchi, UCAR. ) Connection between atmospheric pressure centers in the equatorial Pacific that are associated with the Southern Oscillation, SSTs, and the tropical trade winds that blow from east to west near the surface in the tropics UCAR, 2006, Slowdown in Tropical Pacific Flow Pinned on Climate Change: http: //www. ucar. edu/news/releases/2006/walker. shtml, accessed 24 September 2014.
El Niño-Southern Oscillation (ENSO) A quasi-periodic occurrence when large-scale abnormal pressure and sea-surface temperature patterns become established across the tropical Pacific El Niño - an anomaly of unusually warm sea surface temperatures found in the eastern tropical Pacific. Coincides with a reversal of the normal Walker Circulation; occurs every 2 -7 years*, and usually lasts 10 - 14 months** La Niña - an anomaly of unusually cold sea surface temperatures found in the eastern tropical Pacific. Trade winds along the equatorial Pacific Ocean become stronger than normal → ↑ warm water accumulation in the western equatorial Pacific and cold water upwelling in the east; occurs every 2 -7 years, and usually lasts 9 - 24 months** * 3 -4 years typical ** typical THIS IS A NATURAL CYCLE
El Niño-Southern Oscillation (ENSO) Walker Circulation: Connection between atmospheric pressure centers in the equatorial Pacific that are associated with the SO, SSTs, and the tropical trade winds that blow from east to west near the surface in the tropics H L Upwelling http: //www. pmel. noaa. gov/tao/proj_over/diagrams/gif/normal_elnino. gif
What is El Nino ? • A disruption of the ocean-atmosphere system in the tropical Pacific • Normally, northeasterly trade winds combined with upwelling off of the coast of Peru keep waters cool in the central and eastern Pacific • During El Nino, trade winds relax in the western Pacific leading to warmer waters in the central and eastern Pacific
Southern Oscillation (SO) Oscillation in surface air pressure between the tropical eastern and the western Pacific Ocean waters
El Niño-Southern Oscillation (ENSO) Walker Circulation: Weakening or reversal in equatorial trade winds, and convective circulation Shallowing Thermocline L H Decreased Upwelling; Deepening Thermocline http: //www. pmel. noaa. gov/tao/proj_over/diagrams/gif/normal_elnino. gif
El Niño-Southern Oscillation (ENSO) Walker Circulation: Strengthened equatorial trade winds, and convective circulation H L Deepening Thermocline Increased Upwelling; Shallowing Thermocline http: //www. pmel. noaa. gov/tao/proj_over/diagrams/gif/normal_elnino. gif
El Niño/ La Niña El Niño La Niña - Developing Images from NASA Goddard Space Flight Center Normal
http: //www. ncdc. noaa. gov/teleconnections/enso-tech. php
Upp • Upper Left – Sea surface temperature anomalies for normal conditions. • Upper Right – Sea surface temperature anomalies for El Nino. • Lower Left – Sea surface temperature anomalies for La Nina.
http: //www. nasa. gov/vision/earth/lookingatearth/elnino_split. html Strong El Niño
http: //www. nasa. gov/vision/earth/lookingatearth/elnino_split. html Weak/Mixed El Niño
http: //www. nasa. gov/vision/earth/lookingatearth/elnino_split. html Strong La Niña
http: //www. ncdc. noaa. gov/paleo/ctl/images/warm. gif El Niño Impacts
http: //www. ncdc. noaa. gov/paleo/ctl/images/cold. gif La Niña Impacts
El Niño/La Niña Prediction http: //www. cpc. ncep. noaa. gov/
ENSO INDEX
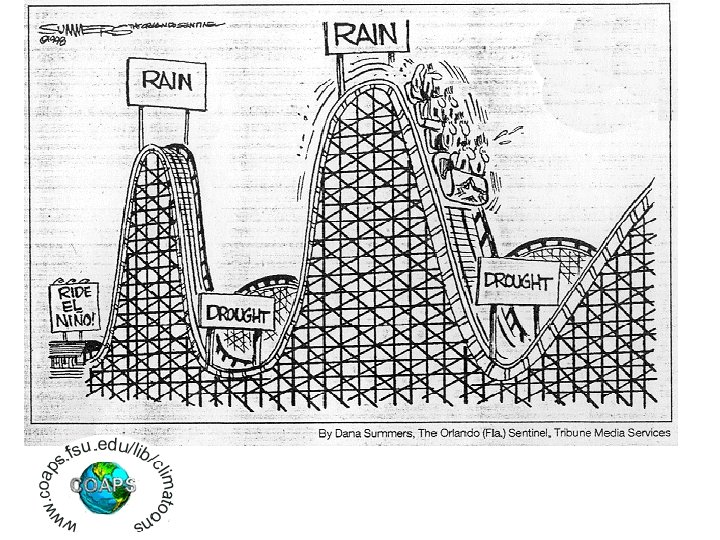
Why study El Nino? • Weather impacts human lives – California flooding • Storm damage • Loss of life • Major impacts on the economy – – – Agriculture Construction Energy distribution Outdoor recreation Retail • U. S. economic impacts of the 97/98 El Nino - $25 Billion !! – Both gains and losses • Department store sales up 15% during mild Midwest winter • Snow equipment sales down 35% during mild Midwest winter • Skiing was up in the west…but down in the Midwest
Summary • The ocean and atmosphere are constantly interacting, resulting in changes to the properties of the air above and water below • These change in mass, energy and momentum produce significant weather and climate events • Examples include tropical storms, rapidly developing marine cyclones and El Nino/La Nina resulting in local, regional and global impacts, sometimes devasting
El Niño/ La Niña El Niño La Niña - Developing Images from NASA Goddard Space Flight Center Normal
El Nino Conditions
La Nina Conditions
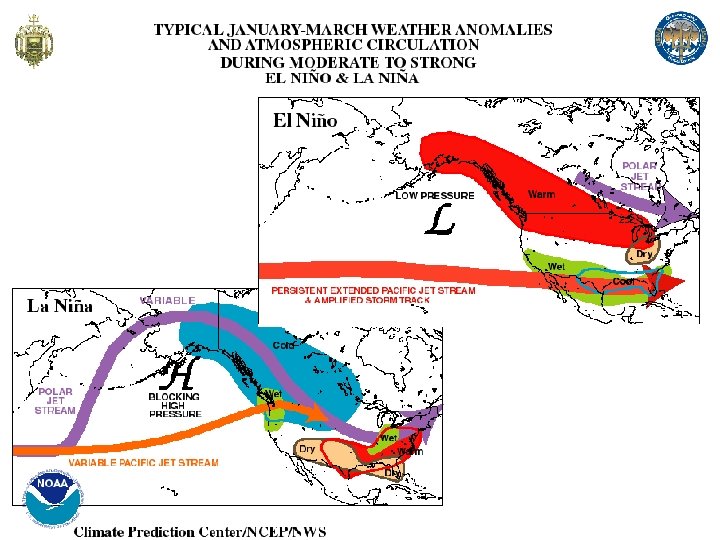
Effects of El Nino
Pacific Decadal-Scale Oscillation (PDO) Pacific Decadal Oscillation: (top) SST based on the leading EOF SST pattern for the Pacific basin north of 20°N for 1901 to 2004 (updated; see Mantua et al. , 1997; Power et al. , 1999 b) and projected for the global ocean (units are nondimensional); and (bottom) annual time series (updated from Mantua et al. , 1997). The smooth black curve shows decadal variations (IPCC , 2007, AR 4, WG 1, Fig. 3. 28)
Other Air-Sea Oscillations • Pacific Decadal-Scale Oscillation (PDO) • North Atlantic Oscillation (NAO) • Arctic Oscillation (AO) • Atlantic Multi-decadal Oscillation (AMO) • Interdecadal Pacific Oscillation (IPO) • Antarctic Oscillation (AAO)
North Atlantic Oscillation (NOA) Large scale seesaw in atmospheric mass between the subtropical high and the polar low NAO index = anomalous difference between the polar low and the subtropical high during the winter season). NOAA/NWS Climate Prediction Center
North Atlantic Oscillation (NOA) http: //www. ldeo. columbia. edu/res/pi/NAO/ Positive NAO Index : Negative NAO Index : • Stronger than usual subtropical high; deeper Icelandic low • Warm/wet winters in Europe • Cold /dry winters in northern Canada • Mild/wet winter conditions in Eastern US • Weak subtropical high; weak Icelandic low • Cold/wet winters in Europe • Mild winters in northern Canada • Cold/snowy winter conditions in Eastern US
Arctic Oscillation (AO) opposing atmospheric pressure patterns in northern middle and high latitudes Relatively low pressure over the polar region and high pressure at mid-latitudes Relatively high pressure over the polar region and low pressure at mid-latitudes Effects of the Positive Phase | Effects of the Negative Phase of the Arctic Oscillation of the Arctic Oscillation (from: http: //nsidc. org/arcticmet/patterns/arctic_oscillation. html; Figures courtesy of J. Wallace, University of Washington)
Madden-Julian Oscillation (MJO) The MJO (Madden and Julian, 1971) is the dominant mode of intra-seasonal variability in the tropical troposphere: • Characterized by large-scale regions of enhanced and suppressed convection, coupled to a deep baroclinic, primarily zonal circulation anomaly • Propagates slowly eastward along the equator from the western Indian Ocean to the central Pacific • Exhibits local periodicity in a broad 30 - to 90 -day range. IPCC 2007 AR 4 WG 1 CH 10 Zhang, 2005 (From Madden and Julian [1972]).
1. Wind moves across ocean surface…turbulent drag force transfers momentum from wind to surface ocean layer → moves water in surface layer; Coriolis force deflects surface flow 45º to the right (left in S Hemisphere) of the original wind vector. 2. Energy/momentum is lost due to turbulence* so amplitude of is << amplitude of original wind vector. 3. Surface ocean layer moves across deeper ocean layer directly below…turbulent drag force transfers momentum from surface ocean layer to deeper ocean layer below → moves water in deeper ocean layer directly below surface layer; Coriolis force deflects surface flow 45º to the right (left in S Hemisphere) of the original wind vector. 4. Energy/momentum is lost due to turbulence* so amplitude of deeper ocean layer flow vector is << amplitude of surface ocean layer flow vector. 5. Repeat for subsequent deeper layers. . . www. soest. hawaii. edu Ekman (Mass) Transport Dissipation of energy/momentum sets up Ekman Spiral (layer depth ~ 100 -150 m). Net (mass) water transport is 90º to the right (left in S Hemisphere) of the original wind vector.
Ekman Transport The Ekman spiral describes how the horizontal wind sets surface waters in motion. As represented by horizontal vectors, the speed and direction of water motion change with increasing depth. Viewed from above in the Northern Hemisphere, the surface layer of water moves at 45 degrees to the right of the wind. The net transport of water through the entire wind-driven column (Ekman transport) is 90 degrees to the right of the wind. Note: “Spiral” is solution to the horizontal equations of motion for a wind blowing across a flat ocean surface with no horizontal pressure gradient, no acceleration, and no internal friction… Lindstrom, E. J. , 2014, Ocean Motion and Surface Curtrents, Ekman Transport Background: http: //oceanmotion. org/html/background/ocean-inmotion. htm, accessed 24 September 2014.
Eckman Transport – Upwelling and Downwelling Where Ekman transport moves surface waters away from the coast, surface waters are replaced by water that wells up from below in the process known as upwelling. This example is from the Northern Hemisphere. Where Ekman transport moves surface waters toward the coast, the water piles up and sinks in the process known as downwelling. This example is from the Northern Hemisphere. Equatorial upwelling. (A) In this plan view of the ocean from 5 degrees S to 5 degrees N, the trade winds of the two hemispheres are shown to converge near the equator. The consequent Ekman transport away from the equator gives rise to upwelling as shown in (B) a vertical cross section from 5 degrees S to 5 degrees N. Lindstrom, E. J. , 2014, Ocean Motion and Surface Currents, Upwelling and Downwelling Background: http: //oceanmotion. org/html/background/upwelling-and-downwelling. htm, accessed 24 September 2014.
Beesley, D. , Olejarz, J. , Tandon, M. , and Marshall J, 2008, A Laboratory Demonstration of Coriolis Effects on Wind-Driven Ocean Currents: Oceanography, vol. 21, no. 2, p. 72 -76. Eckman Transport – Upwelling and Downwelling Figure 2. The Ekman transport is directed perpendicular to the applied stress (to the right if Ω > 0, to the left if Ω < 0), driving (a) convergent flow if the stress is anticyclonic and (b) divergent flow if the stress is cyclonic. (The case Ω > 0—appropriate to the northern hemisphere—is shown. )
Ocean-Atmospheric Interactions/Oscillations Rossby Wave Kelvin Wave - Progressive gravityinertia wave channeled between two boundaries or opposing forces. • Coriolis force • Coastline/Equator Rossby Wave - Long period inertia waves caused by shear in rotating fluids of different densities and to differences in the Coriolis effect. NASA Jet Propulsion Laboratory Collection, Rossby Waves TOPEX/Poseidon (Creator: NASA/JPL-Caltech)
Atmospheric Rossby (or Planetary) Waves Vorticity is the measure of spin or rotation in a fluid at a point Potential vorticity is conserved • Relative vorticity • Earth’s rotational vorticity Atmospheric Rossby waves are meanders in high-altitude winds caused by shear in rotating fluids of different densities and to differences in the Coriolis effect with latitude In stratosphere near tropopause Changes in the #, amplitude, and position of Rossby waves can lead to blocking → abnormal/extreme weather patterns Oceanic Rossby Waves
Quasi-biennial Oscillation (QBO) Alternation of Easterly and Westerly winds in Equatorial Stratosphere Time–height plot of monthly-mean, zonal-mean equatorial zonal wind (u) in m/s between about 20 and 35 km (22 mi) altitude above sea level over a ten-year period. Positive values denote westerly winds and the contour line is at 0 m/s. Interaction of Upward propagating Kelvin Waves (gravity-inertia waves) and Rossby Waves Quasi-periodic wave-driven zonal mean wind reversal that dominates the low-frequency variability of the lower equatorial stratosphere (3 to 100 h. Pa) and affects a variety of extratropical phenomena IPCC 2007 AR 4 WG 1 CH 10 Morn. Graph made using data from FU Berlin (http: //en. wikipedia. org/wiki/Quasi-biennial_oscillation)
Oceanic Niño Index (ONI) http: //www. cpc. ncep. noaa. gov/products/analysis_monitoring/lanina/enso_evolution-status-fcsts-web. pdf
Oceanic Niño Index (ONI) http: //www. cpc. ncep. noaa. gov/products/analysis_monitoring/lanina/enso_evolution-status-fcsts-web. pdf
http: //www. cpc. ncep. noaa. gov/products/analysis_moni toring/lanina/enso_evolution-status-fcsts-web. pdf The most recent ONI value (June – August 2014) is 0. 0 o. C. El Niño Neutral La Niña
http: //www. cpc. ncep. noaa. gov/products/precip/CWl ink/daily_ao_index/month_ao_index. shtml