
Stevenson 17 Project Management Learning Objectives Discuss the
Stevenson 17 Project Management
Learning Objectives § § Discuss the behavioral aspects of projects in terms of project personnel and the project manager. Discuss the nature and importance of a work breakdown structure in project management. Give a general description of PERT/CPM techniques. Construct simple network diagrams. 17 -2
Learning Objectives § § § List the kinds of information that a PERT or CPM analysis can provide. Activity Scheduling Analyze networks with deterministic times. Analyze networks with probabilistic times. Describe activity “crashing. 17 -3
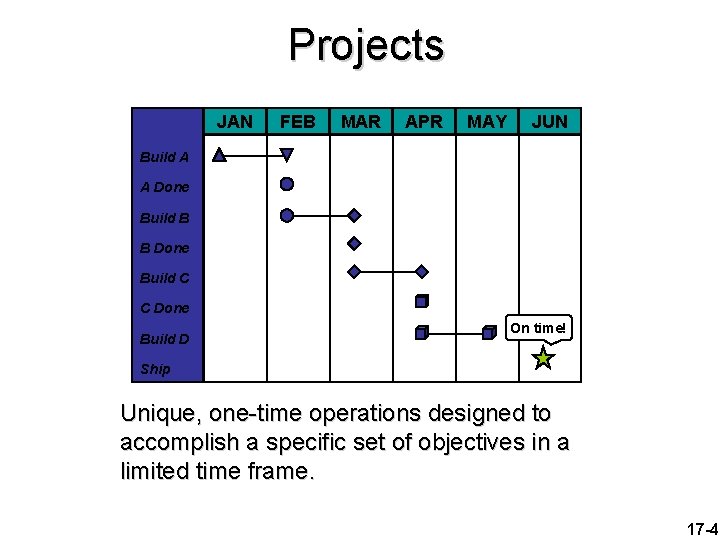
Projects JAN FEB MAR APR MAY JUN Build A A Done Build B B Done Build C C Done Build D On time! Ship Unique, one-time operations designed to accomplish a specific set of objectives in a limited time frame. 17 -4
Project Management § How is it different? § Limited time frame § Narrow focus, specific objectives § Less bureaucratic § Why is it used? § Special needs § Pressures for new or improves products or services 17 -5
Project Management § What are the Key Metrics § Time § Cost § Performance objectives § What are the Key Success Factors? § § § Top-down commitment Having a capable project manager Having time to plan Careful tracking and control Good communications 17 -6
Project Management § What are the Major Administrative Issues? § Executive responsibilities § Project selection § Project manager selection § Organizational structure § Organizational alternatives § Manage within functional unit § Assign a coordinator § Use a matrix organization with a project leader 17 -7
Key Decisions § Deciding which projects to implement § Selecting a project manager § Selecting a project team § Planning and designing the project § Managing and controlling project resources § Deciding if and when a project should be terminated 17 -8
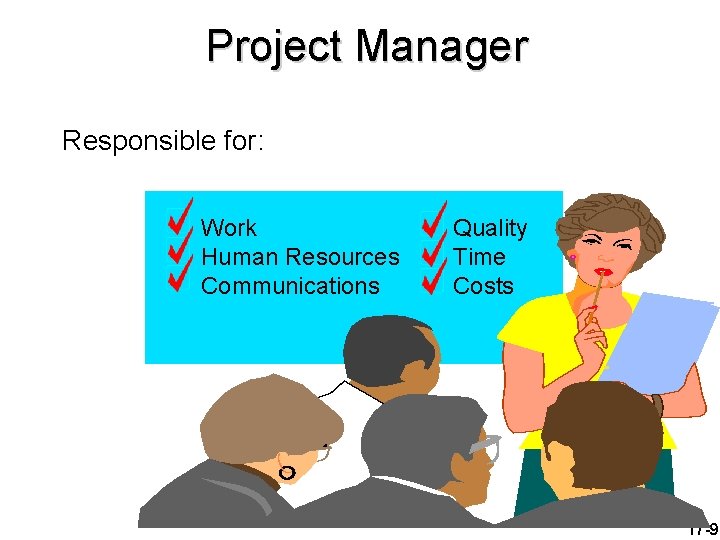
Project Manager Responsible for: Work Human Resources Communications Quality Time Costs 17 -9
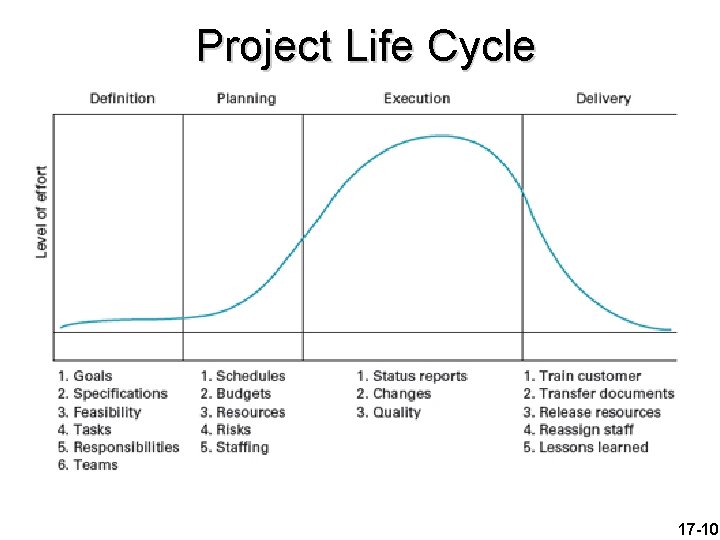
Project Life Cycle 17 -10
Project Management § What are the tools? § § Gantt charts Work breakdown structure Network diagram Risk management 17 -11
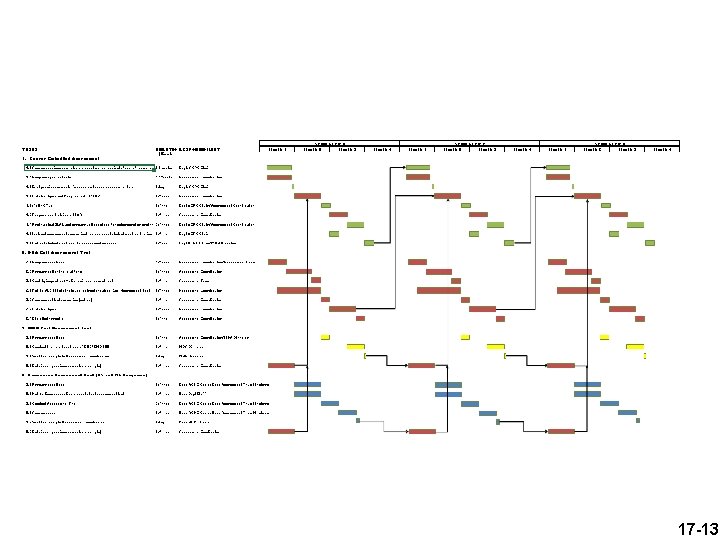
Gantt Chart § A popular tool for planning and scheduling simple projects, and for initial planning for more complex projects § Graph or bar chart § Bars represent the time for each task § Bars also indicate status of tasks § Provides visual display of project schedule § Closely associated with PERT § Slack § amount of time an activity can be delayed without delaying the project 17 -12
17 -13
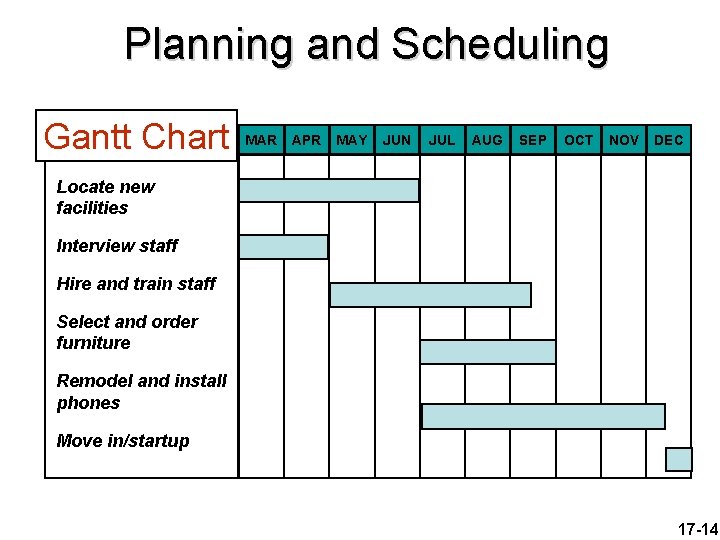
Planning and Scheduling Gantt Chart MAR APR MAY JUN JUL AUG SEP OCT NOV DEC Locate new facilities Interview staff Hire and train staff Select and order furniture Remodel and install phones Move in/startup 17 -14
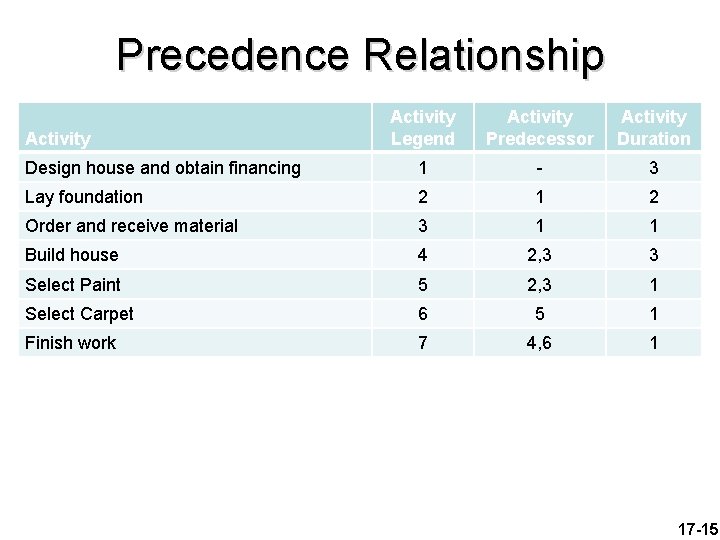
Precedence Relationship Activity Legend Activity Predecessor Activity Duration Design house and obtain financing 1 - 3 Lay foundation 2 1 2 Order and receive material 3 1 1 Build house 4 2, 3 3 Select Paint 5 2, 3 1 Select Carpet 6 5 1 Finish work 7 4, 6 1 Activity 17 -15
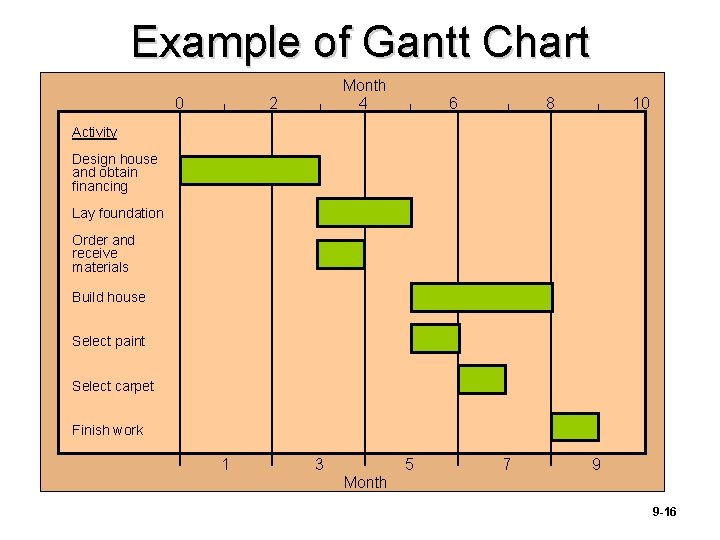
Example of Gantt Chart 0 | 2 | Month 4 | 6 | 8 | 10 Activity Design house and obtain financing Lay foundation Order and receive materials Build house Select paint Select carpet Finish work 1 3 5 7 9 Month 9 -16
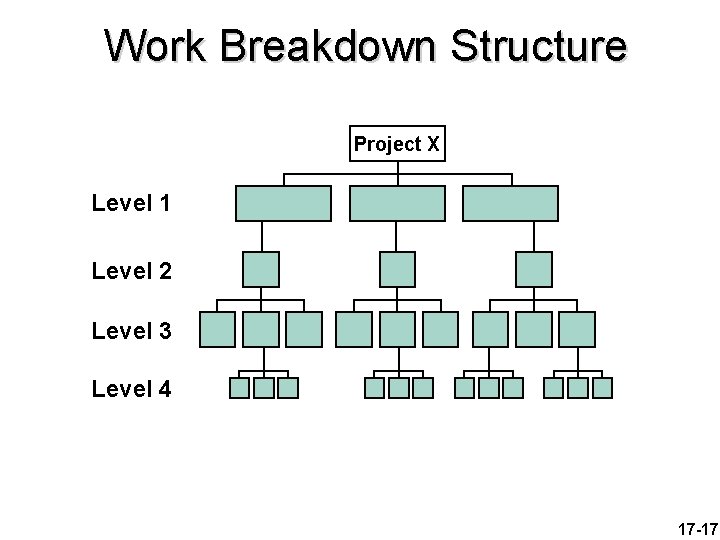
Work Breakdown Structure Project X Level 1 Level 2 Level 3 Level 4 17 -17
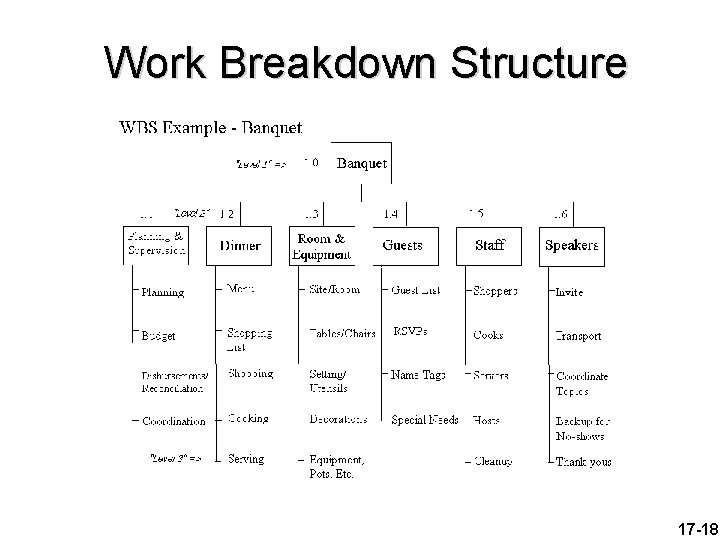
Work Breakdown Structure 17 -18
PERT and CPM PERT: CPM: § § Program Evaluation and Review Technique Critical Path Method Graphically displays project activities Estimates how long the project will take Indicates most critical activities Show where delays will not affect project 17 -19
The Network Diagram § Network (precedence) diagram – diagram of project activities that shows sequential relationships by the use of arrows and nodes. § Activity-on-arrow (AOA) – a network diagram convention in which arrows designate activities. § Activity-on-node (AON) – a network diagram convention in which nodes designate activities. § Activities – steps in the project that consume resources and/or time. § Events – the starting and finishing of activities, designated by nodes in the AOA convention. 17 -20
The Network Diagram (cont’d) § Path § Sequence of activities that leads from the starting node to the finishing node § Critical path § The longest path; determines expected project duration § Critical activities § Activities on the critical path § Slack § Allowable slippage for path; the difference the length of path and the length of critical path 17 -21
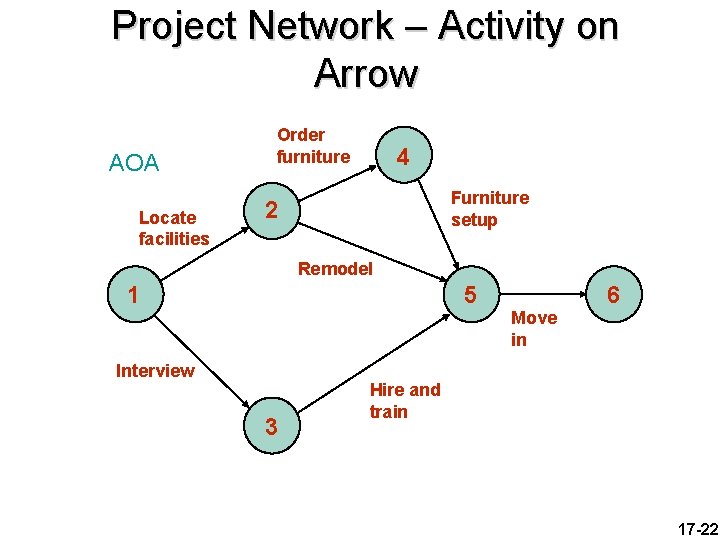
Project Network – Activity on Arrow AOA Locate facilities Order furniture 4 Furniture setup 2 Remodel 1 5 Interview 3 Move in 6 Hire and train 17 -22
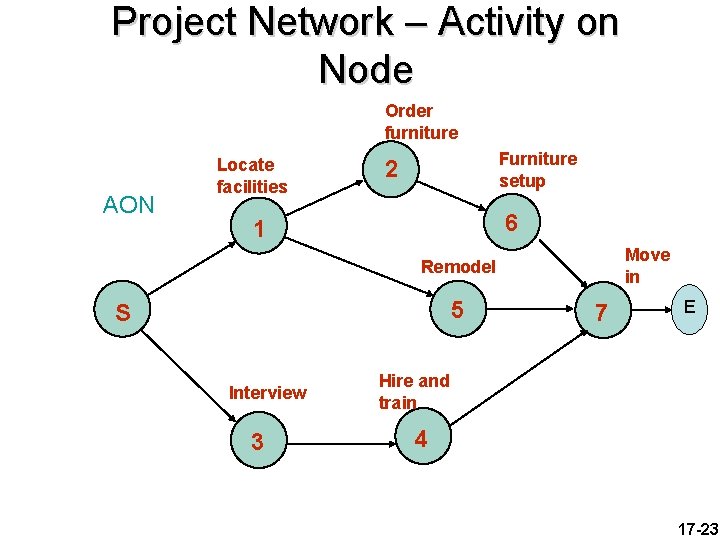
Project Network – Activity on Node Order furniture AON Locate facilities Furniture setup 2 6 1 Move in Remodel 5 S Interview 3 7 E Hire and train 4 17 -23
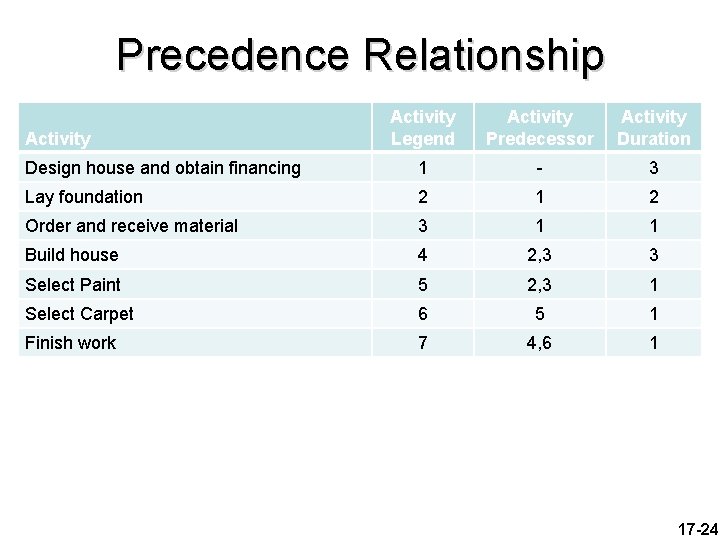
Precedence Relationship Activity Legend Activity Predecessor Activity Duration Design house and obtain financing 1 - 3 Lay foundation 2 1 2 Order and receive material 3 1 1 Build house 4 2, 3 3 Select Paint 5 2, 3 1 Select Carpet 6 5 1 Finish work 7 4, 6 1 Activity 17 -24
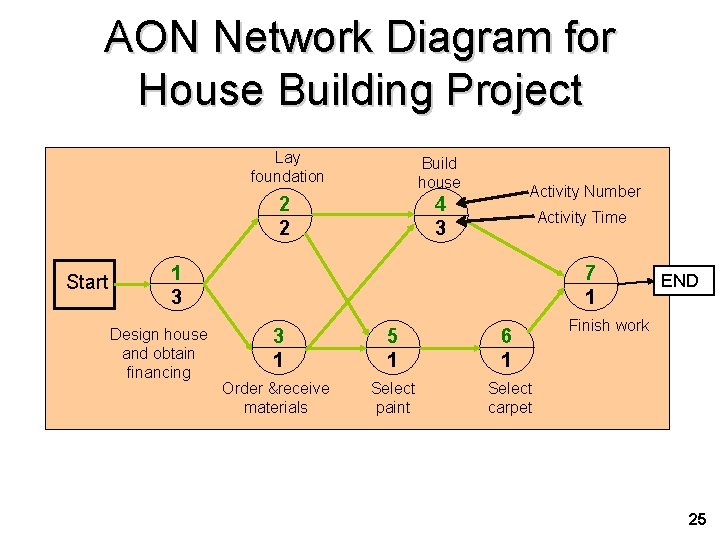
AON Network Diagram for House Building Project Start Lay foundation Build house 2 2 4 3 Activity Number Activity Time 1 3 Design house and obtain financing 7 1 3 1 5 1 6 1 Order &receive materials Select paint Select carpet END Finish work 25
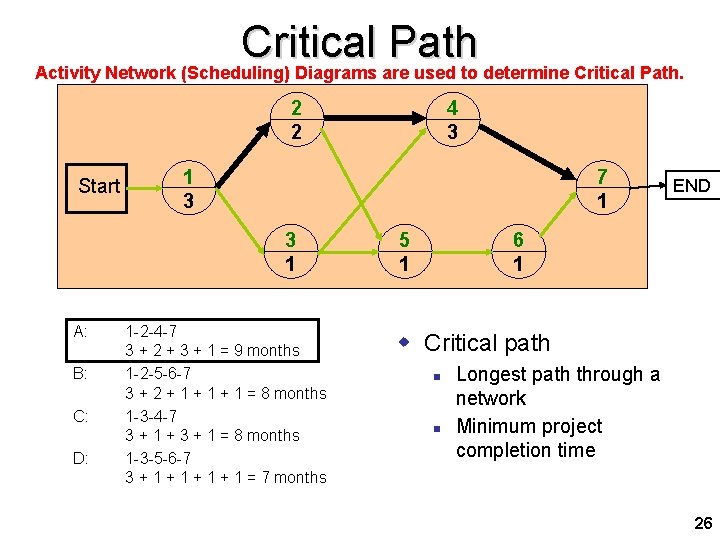
Critical Path Activity Network (Scheduling) Diagrams are used to determine Critical Path. 2 2 Start 1 3 7 1 3 1 A: B: C: D: 4 3 1 -2 -4 -7 3 + 2 + 3 + 1 = 9 months 1 -2 -5 -6 -7 3 + 2 + 1 + 1 = 8 months 1 -3 -4 -7 3 + 1 + 3 + 1 = 8 months 1 -3 -5 -6 -7 3 + 1 + 1 = 7 months 5 1 END 6 1 w Critical path n n Longest path through a network Minimum project completion time 26
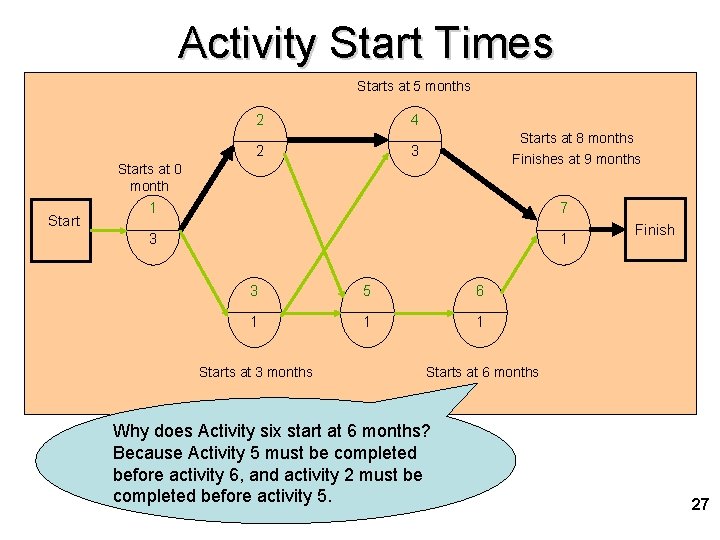
Activity Start Times Starts at 5 months 2 4 2 3 Starts at 8 months Finishes at 9 months Starts at 0 month Start 1 7 3 1 3 5 6 1 1 1 Starts at 3 months Finish Starts at 6 months Why does Activity six start at 6 months? Because Activity 5 must be completed before activity 6, and activity 2 must be completed before activity 5. 27
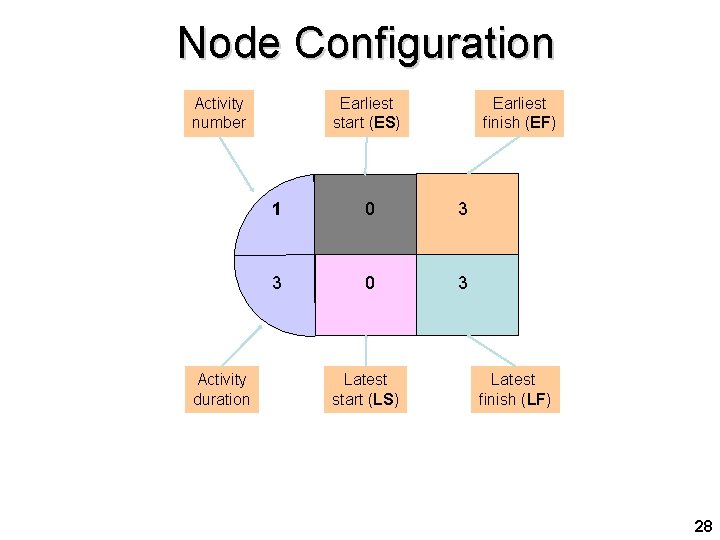
Node Configuration Activity number Activity duration Earliest start (ES) Earliest finish (EF) 1 0 3 3 0 3 Latest start (LS) Latest finish (LF) 28
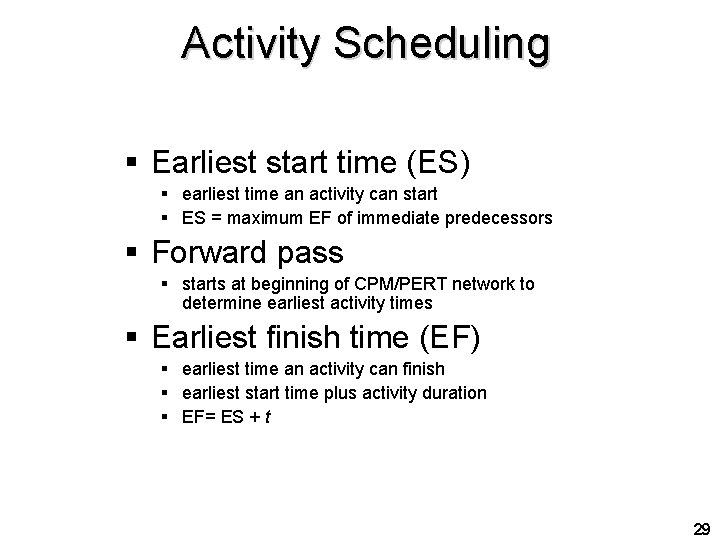
Activity Scheduling § Earliest start time (ES) § earliest time an activity can start § ES = maximum EF of immediate predecessors § Forward pass § starts at beginning of CPM/PERT network to determine earliest activity times § Earliest finish time (EF) § earliest time an activity can finish § earliest start time plus activity duration § EF= ES + t 29
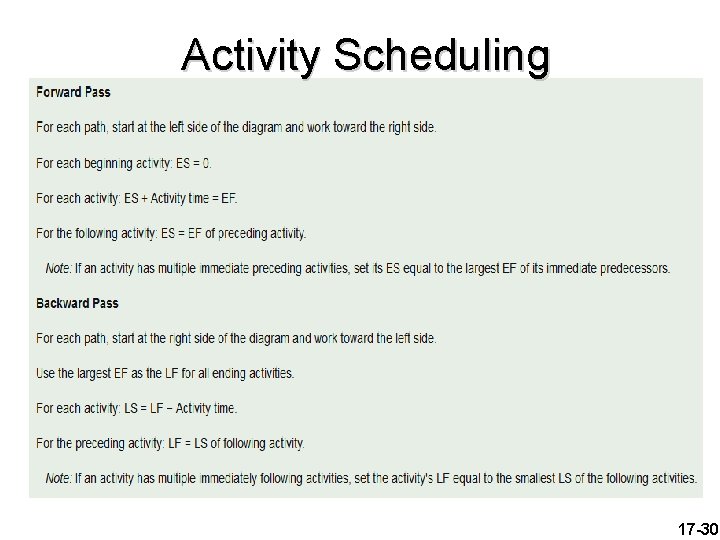
Activity Scheduling 17 -30
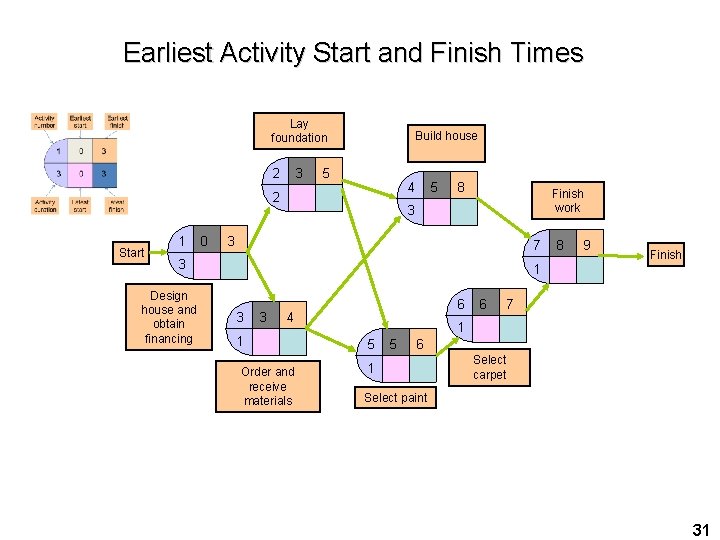
Earliest Activity Start and Finish Times Lay foundation 2 3 Build house 5 4 2 Start 1 0 5 8 Finish work 3 3 7 3 Design house and obtain financing 8 9 Finish 1 3 3 6 4 1 Order and receive materials 6 7 1 5 5 6 1 Select carpet Select paint 31
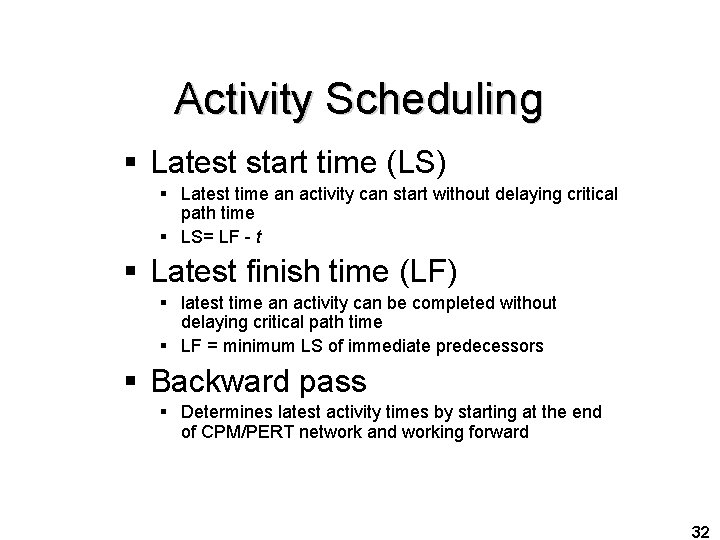
Activity Scheduling § Latest start time (LS) § Latest time an activity can start without delaying critical path time § LS= LF - t § Latest finish time (LF) § latest time an activity can be completed without delaying critical path time § LF = minimum LS of immediate predecessors § Backward pass § Determines latest activity times by starting at the end of CPM/PERT network and working forward 32
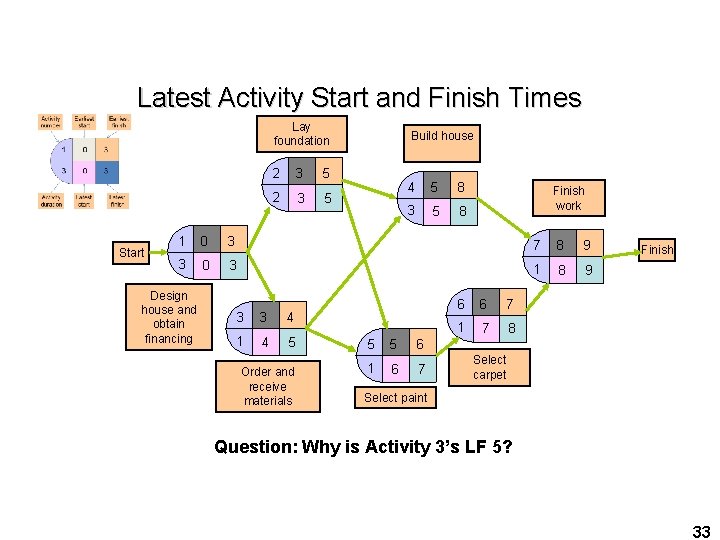
Latest Activity Start and Finish Times Lay foundation Start 2 3 5 Build house 4 5 8 3 5 8 Finish work 1 0 3 7 8 9 3 0 3 1 8 9 Design house and obtain financing 3 3 4 1 4 5 5 5 6 Order and receive materials 1 6 7 6 6 7 1 7 8 Finish Select carpet Select paint Question: Why is Activity 3’s LF 5? 33
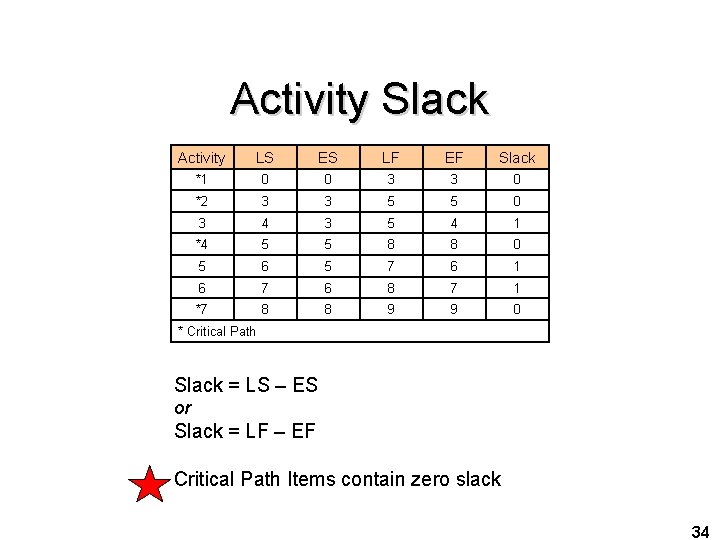
Activity Slack Activity LS ES LF EF Slack *1 0 0 3 3 0 *2 3 3 5 5 0 3 4 3 5 4 1 *4 5 5 8 8 0 5 6 5 7 6 1 6 7 6 8 7 1 *7 8 8 9 9 0 * Critical Path Slack = LS – ES or Slack = LF – EF Critical Path Items contain zero slack 34
Time Estimates § Deterministic § Time estimates that are fairly certain § Probabilistic § Estimates of times that allow for variation 17 -35
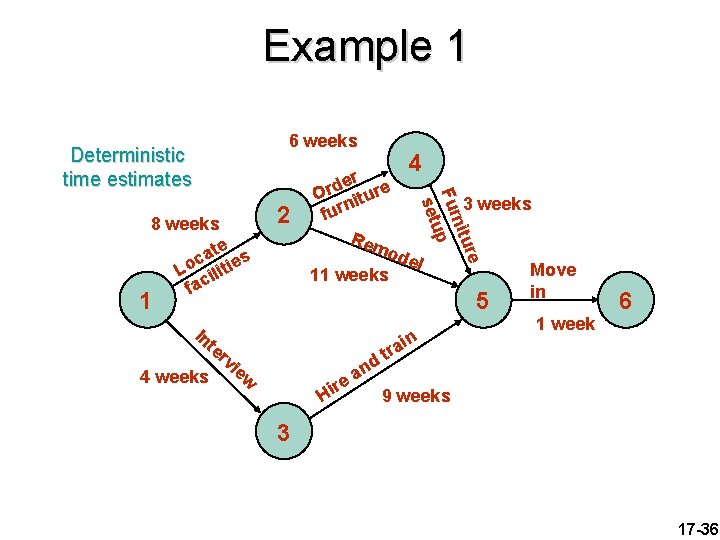
Example 1 6 weeks Deterministic time estimates er e d r O tur i n fur Rem ode l 11 weeks re nitu Fur p u set 8 weeks ate es c Lo iliti fac 2 4 1 In te 4 weeks rv 3 weeks 5 d ie w r n a e Hi in a r t Move in 1 week 6 9 weeks 3 17 -36
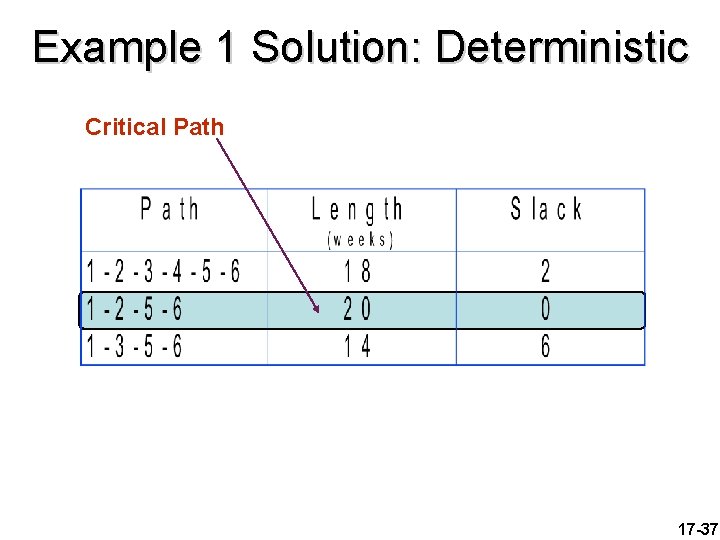
Example 1 Solution: Deterministic Critical Path 17 -37
Probabilistic Time Estimates § Optimistic time § Time required under optimal conditions § Pessimistic time § Time required under worst conditions § Most likely time § Most probable length of time that will be required 17 -38
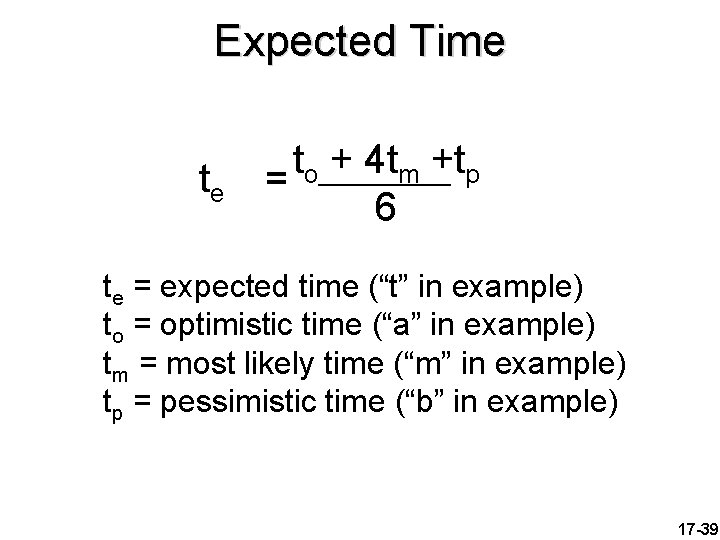
Expected Time te t + 4 t +t o m p = 6 te = expected time (“t” in example) to = optimistic time (“a” in example) tm = most likely time (“m” in example) tp = pessimistic time (“b” in example) 17 -39
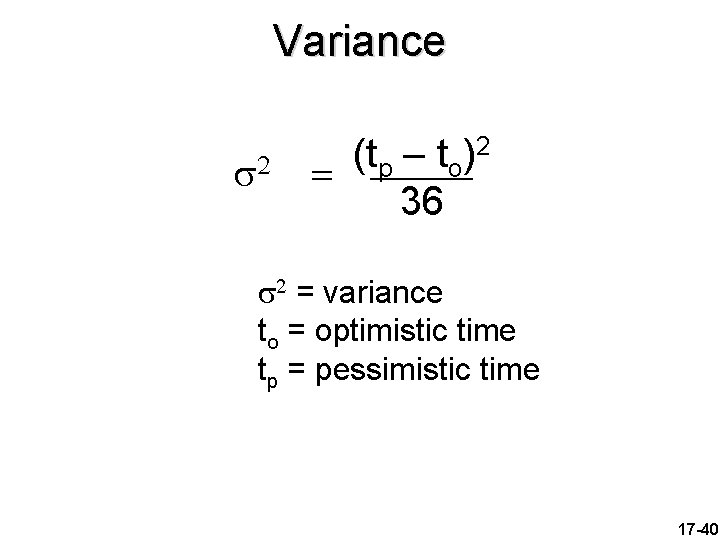
Variance 2 2 (t – t ) = p o 36 2 = variance to = optimistic time tp = pessimistic time 17 -40
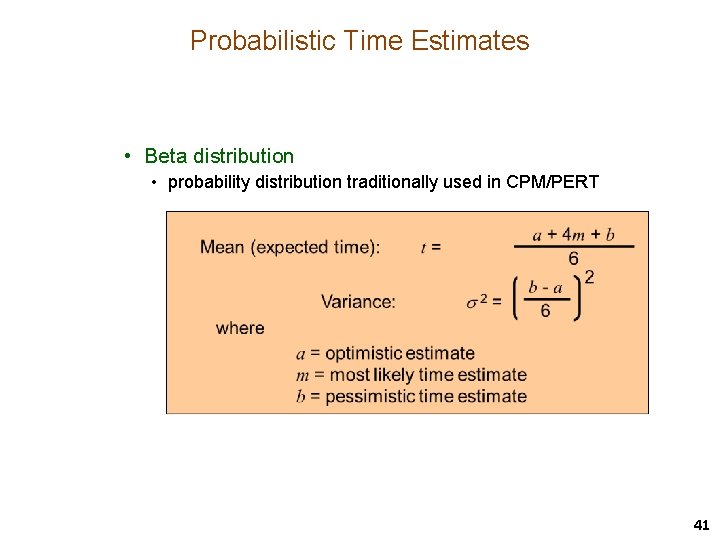
Probabilistic Time Estimates • Beta distribution • probability distribution traditionally used in CPM/PERT 41
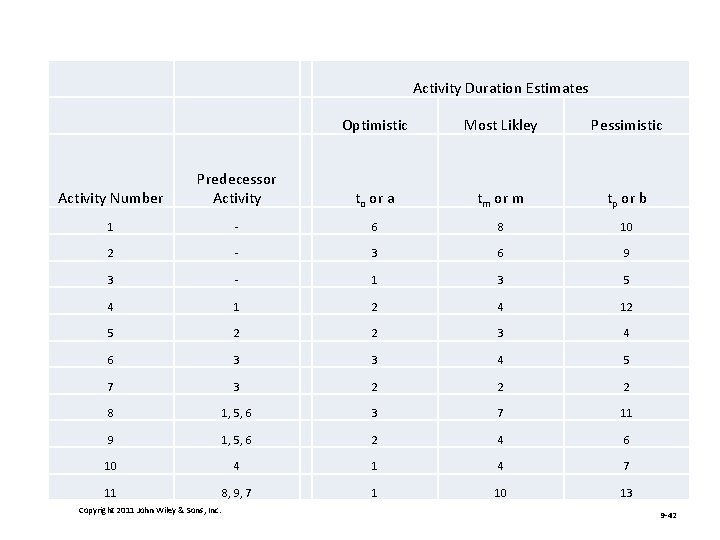
Activity Duration Estimates Optimistic Most Likley Pessimistic Activity Number Predecessor Activity to or a tm or m tp or b 1 - 6 8 10 2 - 3 6 9 3 - 1 3 5 4 1 2 4 12 5 2 2 3 4 6 3 3 4 5 7 3 2 2 2 8 1, 5, 6 3 7 11 9 1, 5, 6 2 4 6 10 4 1 4 7 11 8, 9, 7 1 10 13 Copyright 2011 John Wiley & Sons, Inc. 9 -42
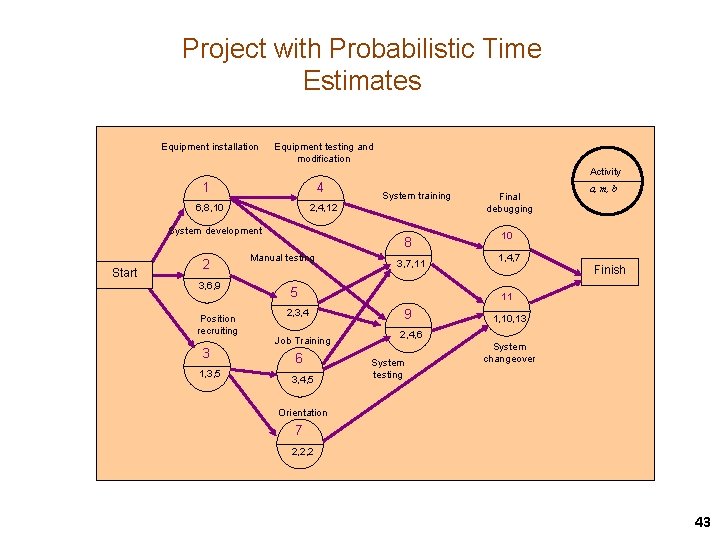
Project with Probabilistic Time Estimates Equipment installation Equipment testing and modification Activity 1 4 6, 8, 10 2, 4, 12 System training System development Start 2 3, 6, 9 Position recruiting 3 1, 3, 5 8 Manual testing 3, 7, 11 5 6 3, 4, 5 a, m, b 10 1, 4, 7 Finish 11 2, 3, 4 Job Training Final debugging 9 2, 4, 6 System testing 1, 10, 13 System changeover Orientation 7 2, 2, 2 43
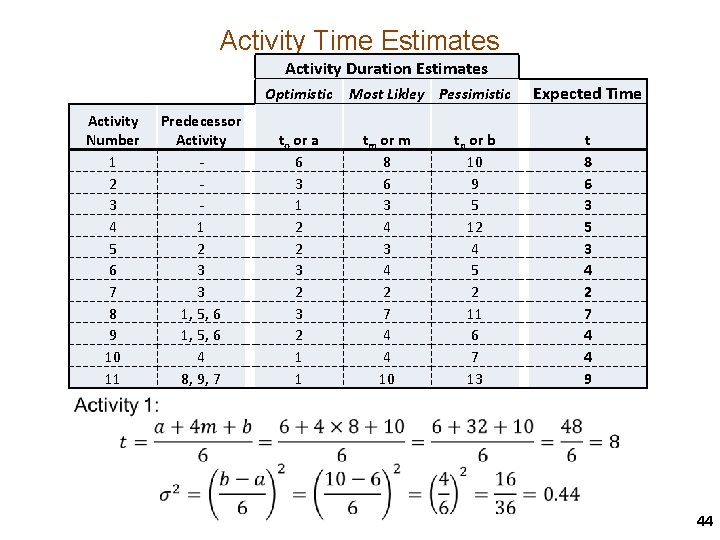
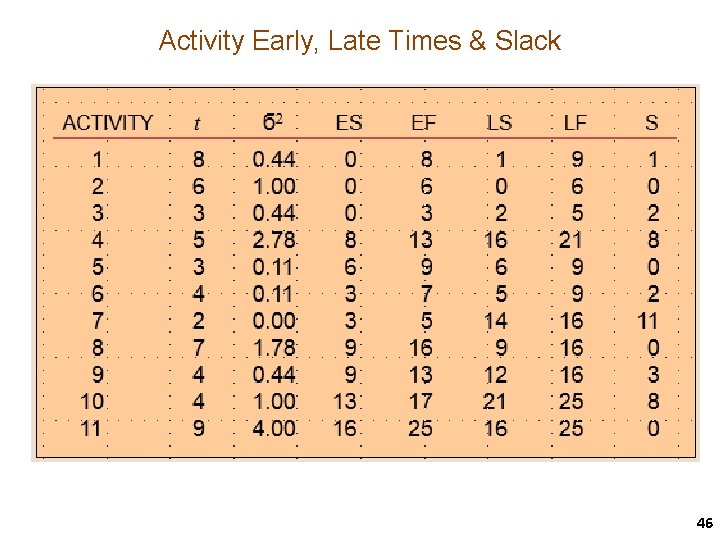
Activity Time Estimates Activity Duration Estimates Optimistic Activity Number 1 2 3 4 5 6 7 8 9 10 11 Predecessor Activity 1 2 3 3 1, 5, 6 4 8, 9, 7 to or a 6 3 1 2 2 3 2 1 1 Most Likley Pessimistic tm or m 8 6 3 4 2 7 4 4 10 tp or b 10 9 5 12 4 5 2 11 6 7 13 Expected Time t 8 6 3 5 3 4 2 7 4 4 9 44
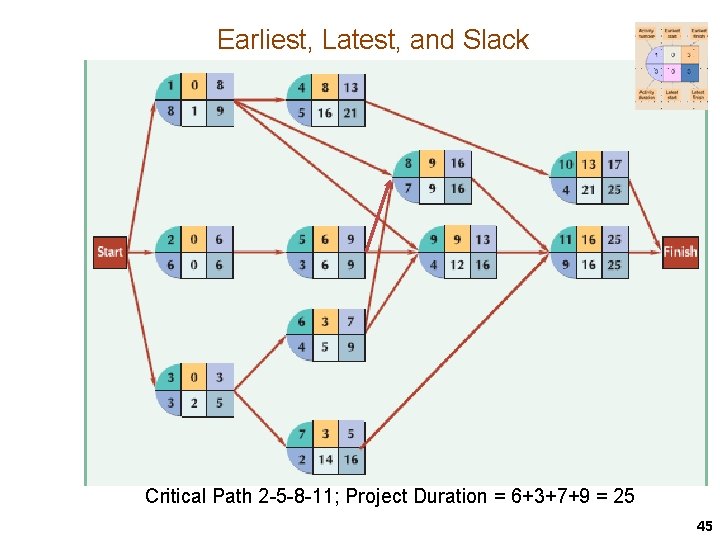
Earliest, Latest, and Slack Critical Path 2 -5 -8 -11; Project Duration = 6+3+7+9 = 25 45
Activity Early, Late Times & Slack 46
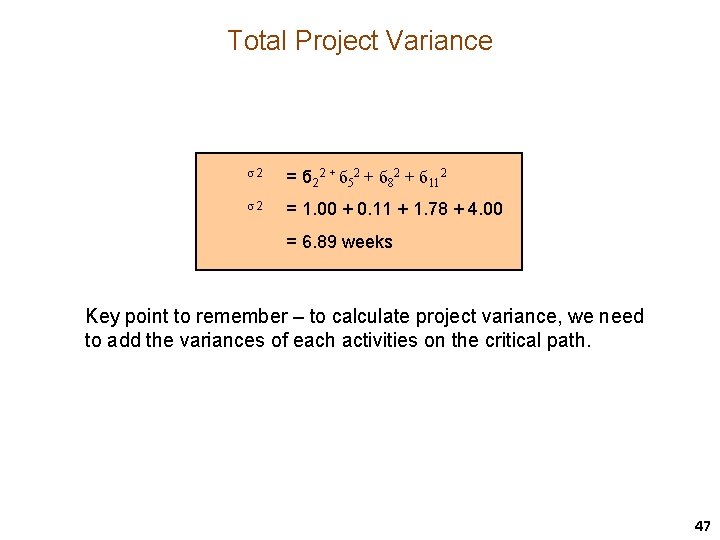
Total Project Variance 2 = б 22 + б 52 + б 82 + б 112 2 = 1. 00 + 0. 11 + 1. 78 + 4. 00 = 6. 89 weeks Key point to remember – to calculate project variance, we need to add the variances of each activities on the critical path. 47
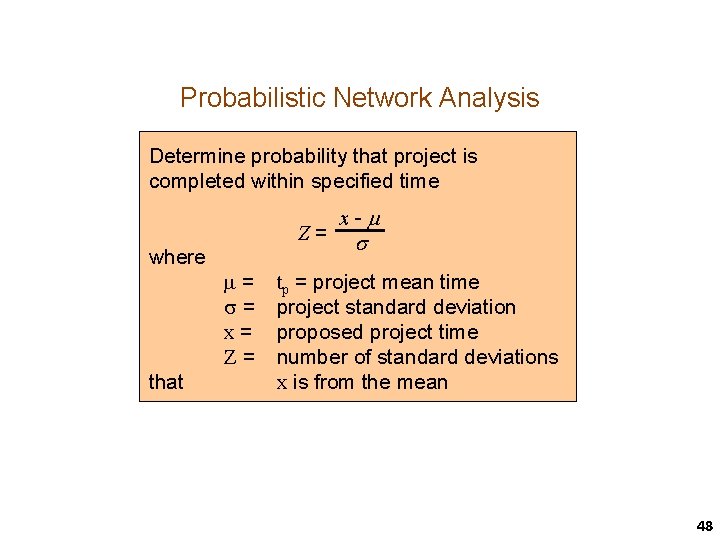
Probabilistic Network Analysis Determine probability that project is completed within specified time where that Z= = = x= Z= x- tp = project mean time project standard deviation proposed project time number of standard deviations x is from the mean 48
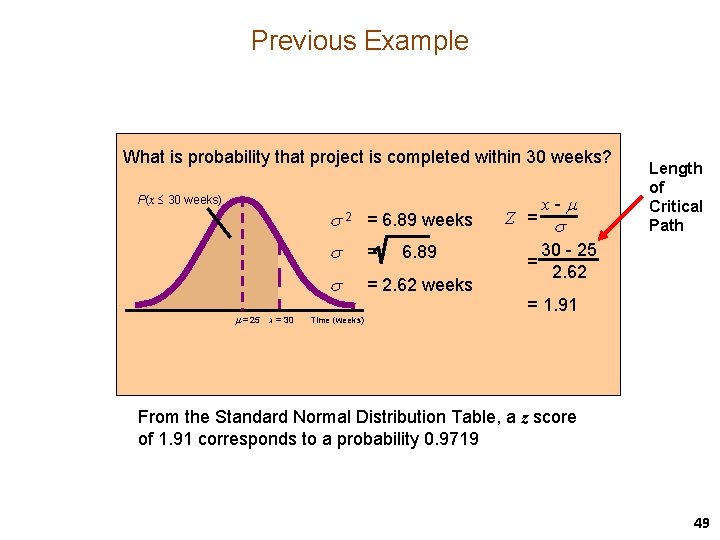
Previous Example What is probability that project is completed within 30 weeks? P(x 30 weeks) = 25 x = 30 2 = 6. 89 weeks = = 2. 62 weeks 6. 89 x- Z = 30 - 25 = 2. 62 Length of Critical Path = 1. 91 Time (weeks) From the Standard Normal Distribution Table, a z score of 1. 91 corresponds to a probability 0. 9719 49
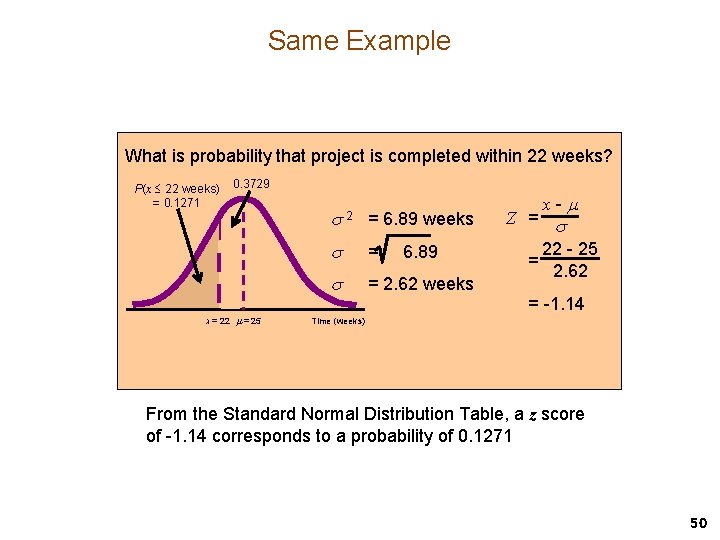
Same Example What is probability that project is completed within 22 weeks? P(x 22 weeks) = 0. 1271 0. 3729 x = 22 = 25 2 = 6. 89 weeks = = 2. 62 weeks 6. 89 x- Z = 22 - 25 = 2. 62 = -1. 14 Time (weeks) From the Standard Normal Distribution Table, a z score of -1. 14 corresponds to a probability of 0. 1271 50
Time-cost Trade-offs: Crashing § Crash – shortening activity duration § Procedure for crashing § Crash the project one period at a time § Only an activity on the critical path § Crash the least expensive activity on the critical path § After each crash, recheck the critical path(s) and all paths § Multiple critical paths: find the sum of crashing the least expensive activity on each critical path 17 -51
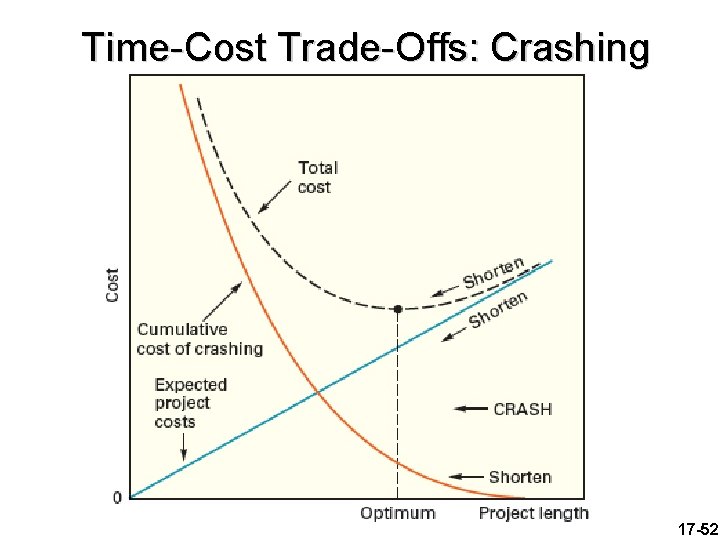
Time-Cost Trade-Offs: Crashing 17 -52
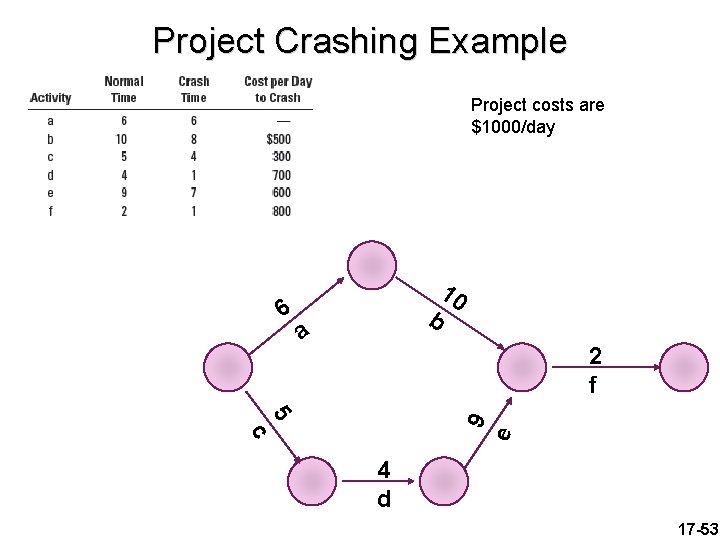
Project Crashing Example Project costs are $1000/day 6 b a 10 2 f e 9 5 c 4 d 17 -53
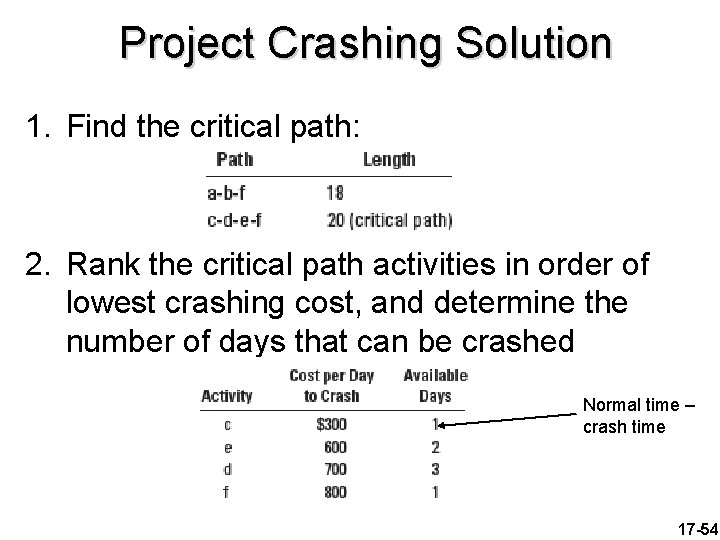
Project Crashing Solution 1. Find the critical path: 2. Rank the critical path activities in order of lowest crashing cost, and determine the number of days that can be crashed Normal time – crash time 17 -54
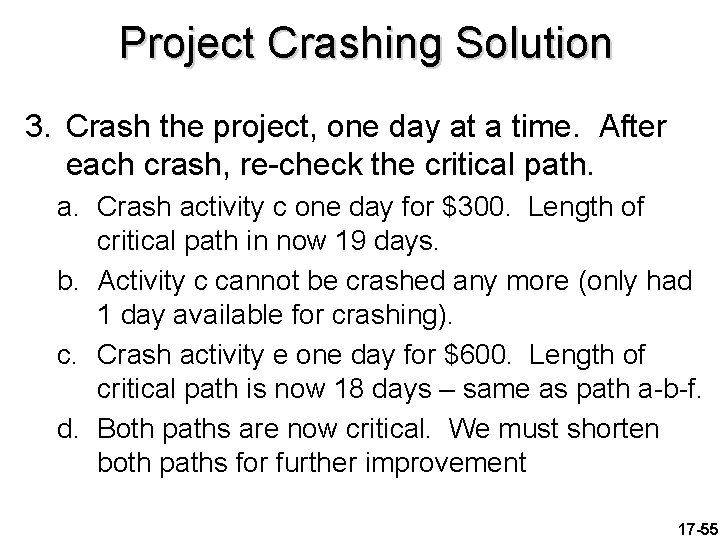
Project Crashing Solution 3. Crash the project, one day at a time. After each crash, re-check the critical path. a. Crash activity c one day for $300. Length of critical path in now 19 days. b. Activity c cannot be crashed any more (only had 1 day available for crashing). c. Crash activity e one day for $600. Length of critical path is now 18 days – same as path a-b-f. d. Both paths are now critical. We must shorten both paths for further improvement 17 -55
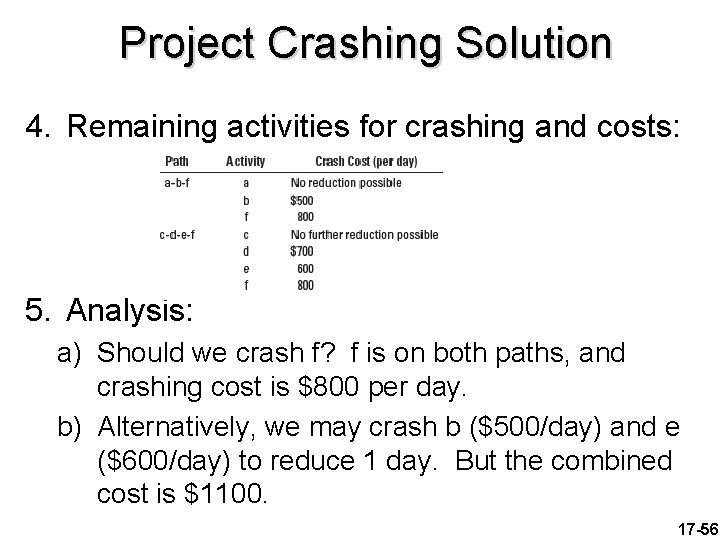
Project Crashing Solution 4. Remaining activities for crashing and costs: 5. Analysis: a) Should we crash f? f is on both paths, and crashing cost is $800 per day. b) Alternatively, we may crash b ($500/day) and e ($600/day) to reduce 1 day. But the combined cost is $1100. 17 -56
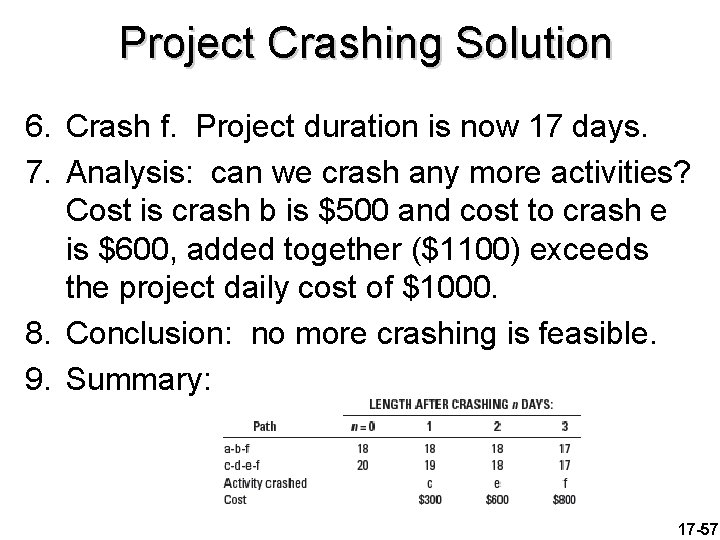
Project Crashing Solution 6. Crash f. Project duration is now 17 days. 7. Analysis: can we crash any more activities? Cost is crash b is $500 and cost to crash e is $600, added together ($1100) exceeds the project daily cost of $1000. 8. Conclusion: no more crashing is feasible. 9. Summary: 17 -57
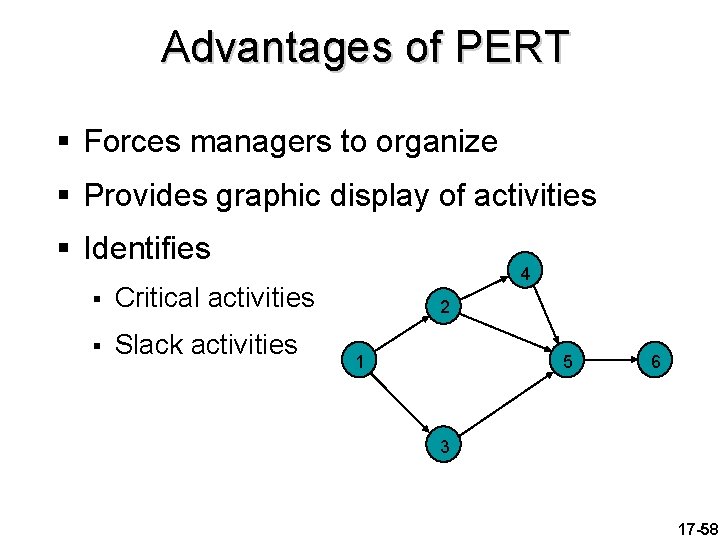
Advantages of PERT § Forces managers to organize § Provides graphic display of activities § Identifies § Critical activities § Slack activities 4 2 1 5 6 3 17 -58
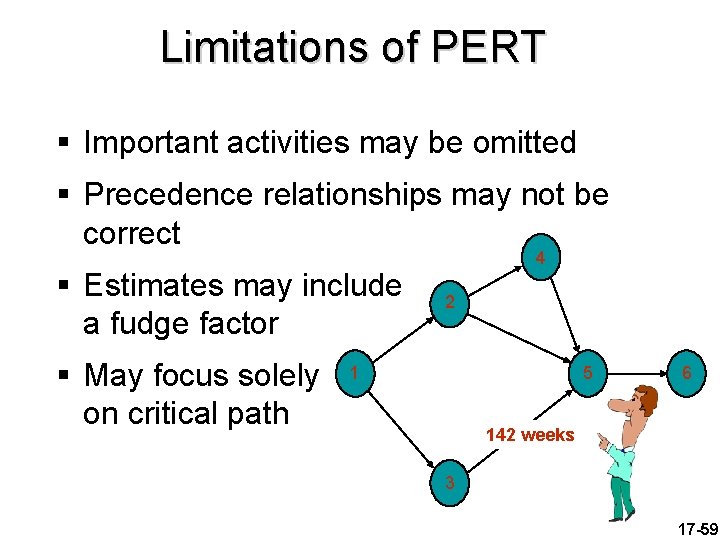
Limitations of PERT § Important activities may be omitted § Precedence relationships may not be correct § Estimates may include a fudge factor § May focus solely on critical path 4 2 1 5 6 142 weeks 3 17 -59
Project Management Software § § § § Computer aided design (CAD) Groupware (Lotus Notes) CA Super Project Harvard Total Manager MS Project Sure Track Project Manager Time Line 17 -60
Project Risk Management § Risk: occurrence of events that have undesirable consequences § Delays § Increased costs § Inability to meet specifications § Project termination 17 -61
Risk Management § Identify potential risks § Analyze and assess risks § Work to minimize occurrence of risk § Establish contingency plans 17 -62
Summary § Projects are a unique set of activities § Projects go through life cycles § PERT and CPM are two common techniques § Network diagrams § Project management software available 17 -63
- Slides: 63