
Status of the Yb F e EDM experiment
Status of the Yb. F e. EDM experiment Ben Sauer
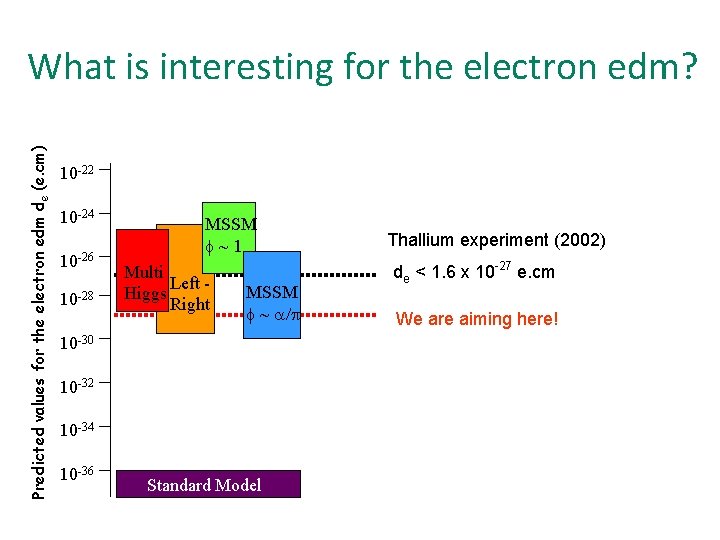
Predicted values for the electron edm de (e. cm) What is interesting for the electron edm? 10 -22 10 -24 10 -26 10 -28 MSSM f~1 Multi Left Higgs Right MSSM f ~ a/p 10 -30 10 -32 10 -34 10 -36 Standard Model Thallium experiment (2002) de < 1. 6 x 10 -27 e. cm We are aiming here!
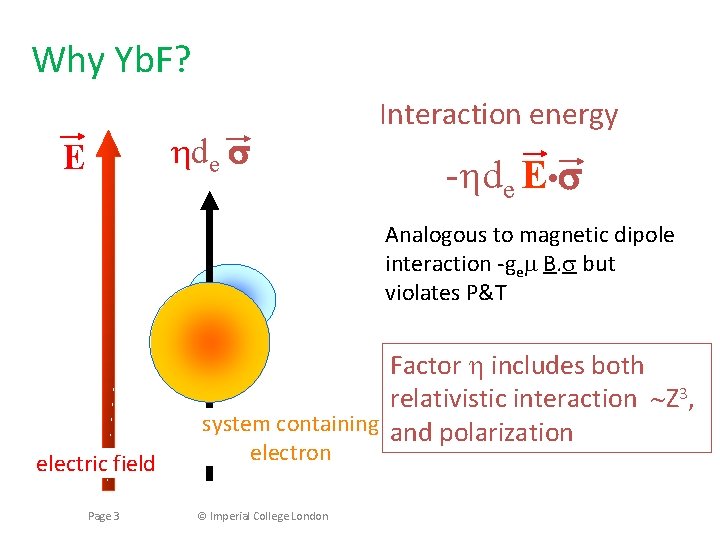
Why Yb. F? hde E Interaction energy -hde E • Analogous to magnetic dipole interaction -gem B. s but violates P&T electric field Page 3 Factor h includes both relativistic interaction Z 3, system containing and polarization electron © Imperial College London
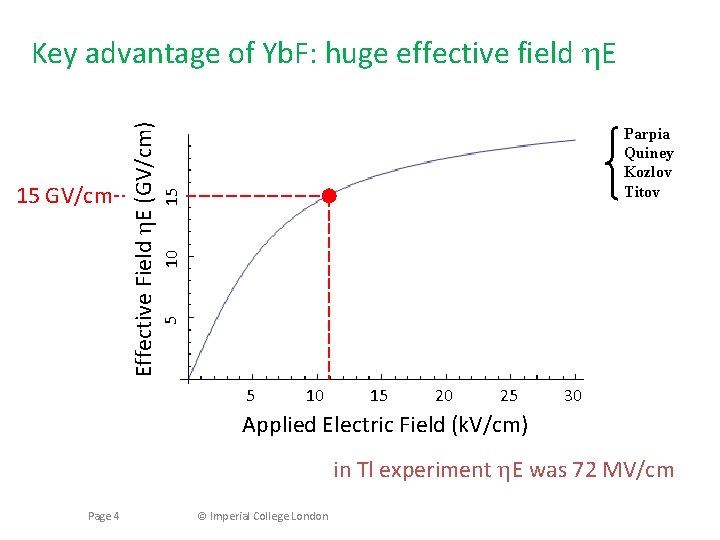
10 15 Parpia Quiney Kozlov Titov 5 15 GV/cm Effective Field h. E (GV/cm) Key advantage of Yb. F: huge effective field h. E 5 10 15 20 25 30 Applied Electric Field (k. V/cm) in Tl experiment h. E was 72 MV/cm Page 4 © Imperial College London
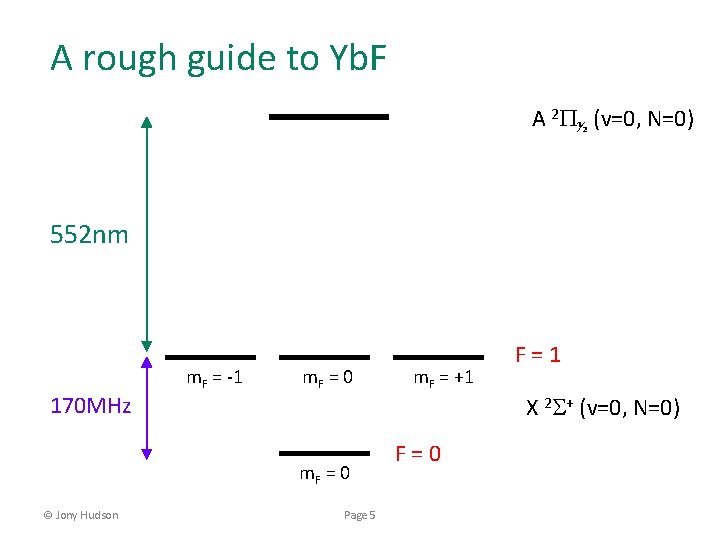
A rough guide to Yb. F A 2 P½ (v=0, N=0) 552 nm 170 MHz m. F = -1 m. F = 0 © Jony Hudson Page 5 m. F = +1 F=0 F=1 X 2 S+ (v=0, N=0)
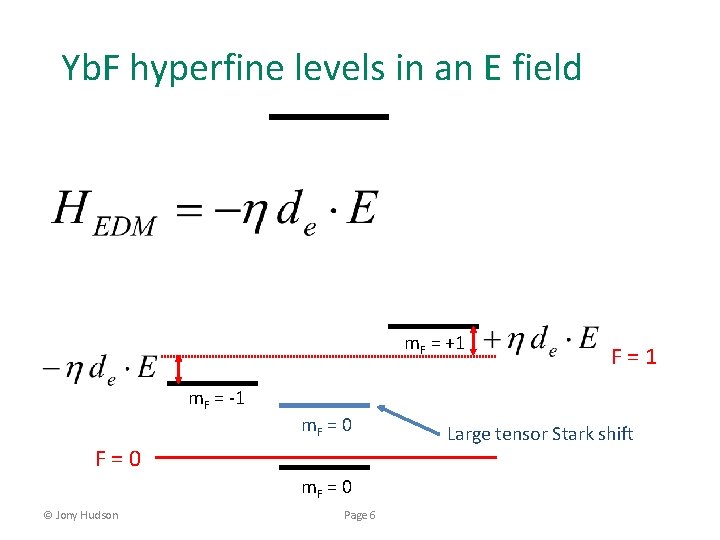
Yb. F hyperfine levels in an E field m. F = +1 m. F = -1 m. F = 0 F=0 m. F = 0 © Jony Hudson Page 6 F=1 Large tensor Stark shift
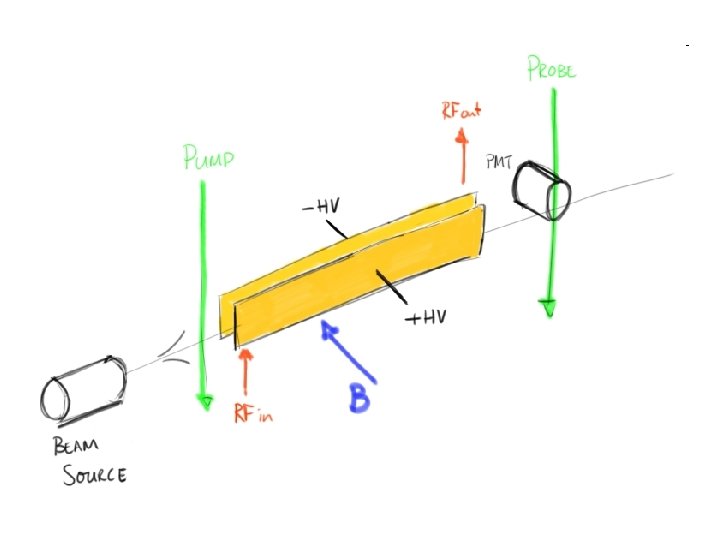
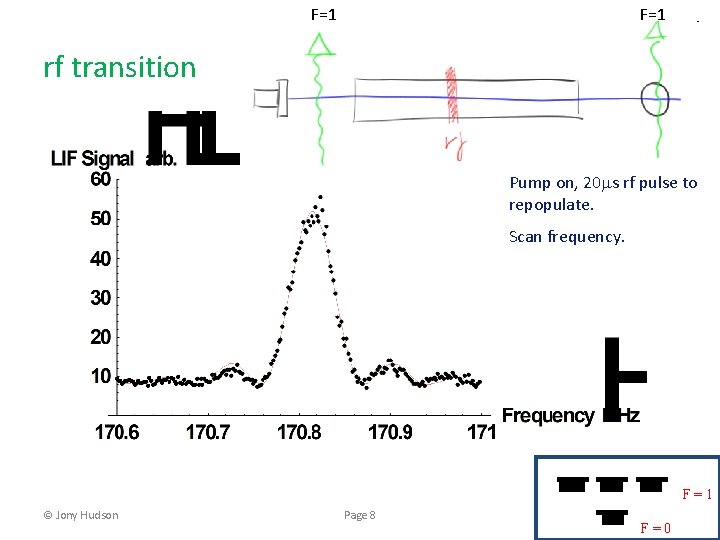
F=1 rf transition Pump on, 20 ms rf pulse to repopulate. Scan frequency. F=1 © Jony Hudson Page 8 F=0
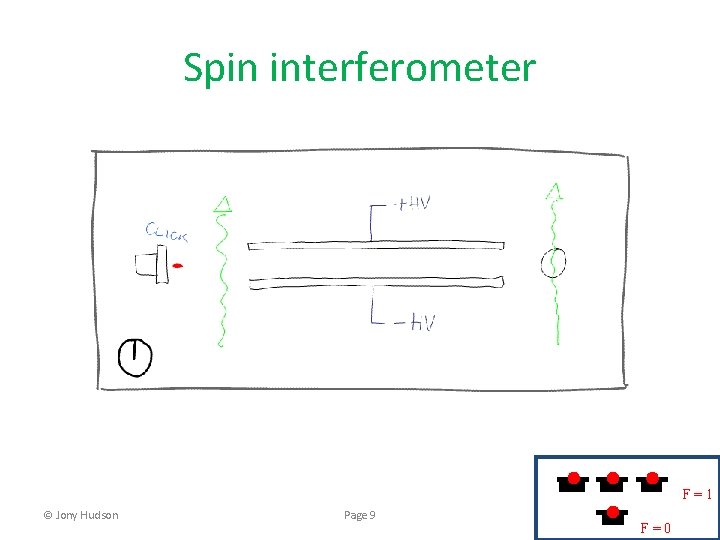
Spin interferometer F=1 © Jony Hudson Page 9 F=0
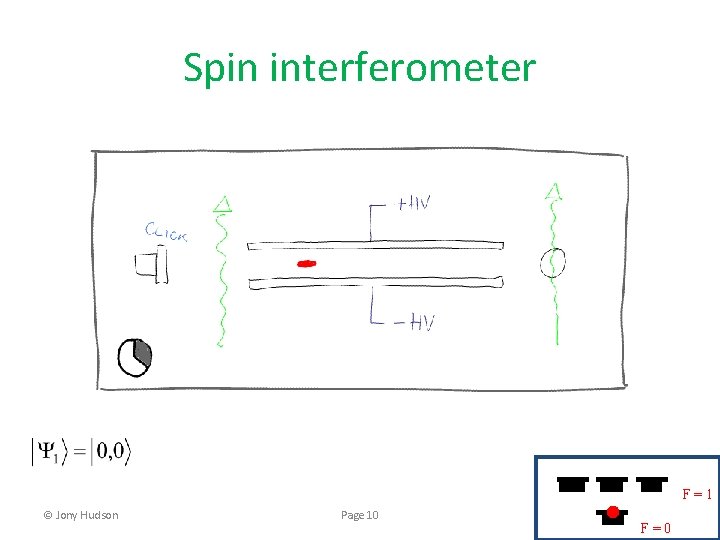
Spin interferometer F=1 © Jony Hudson Page 10 F=0
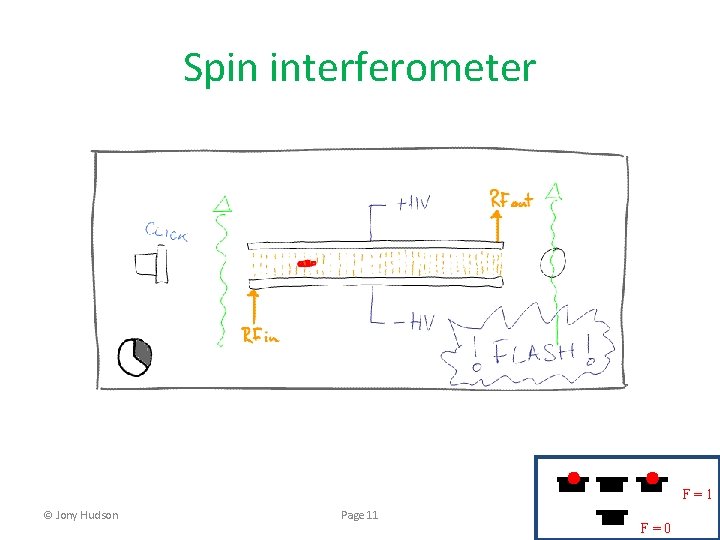
Spin interferometer F=1 © Jony Hudson Page 11 F=0
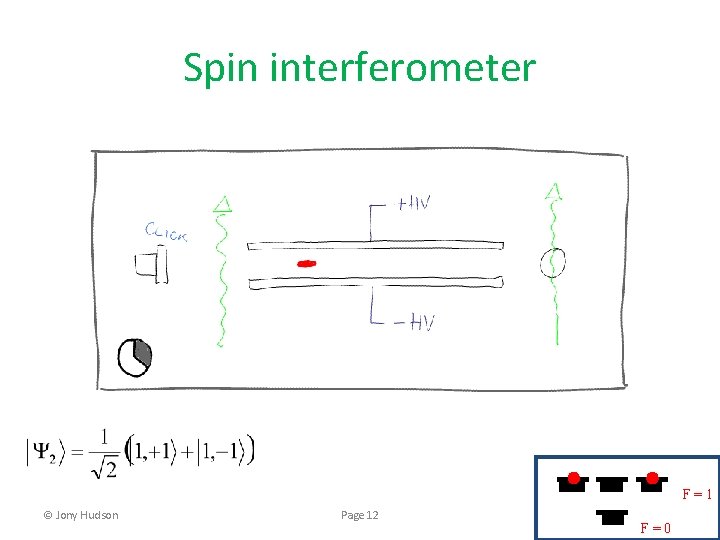
Spin interferometer F=1 © Jony Hudson Page 12 F=0
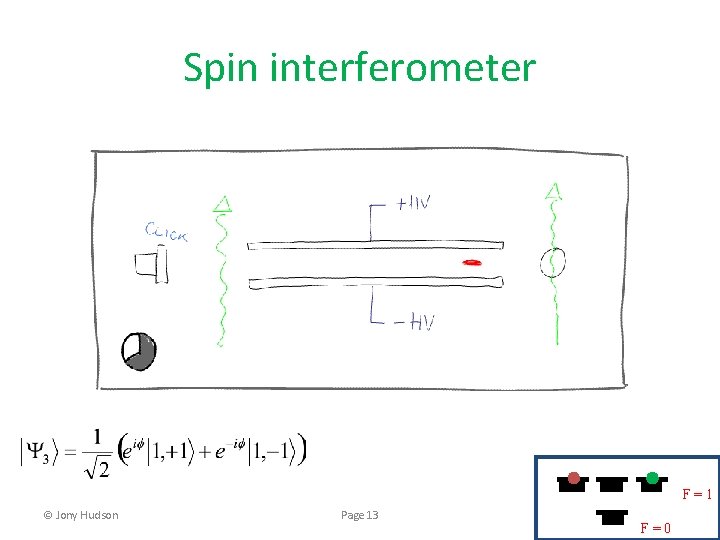
Spin interferometer F=1 © Jony Hudson Page 13 F=0
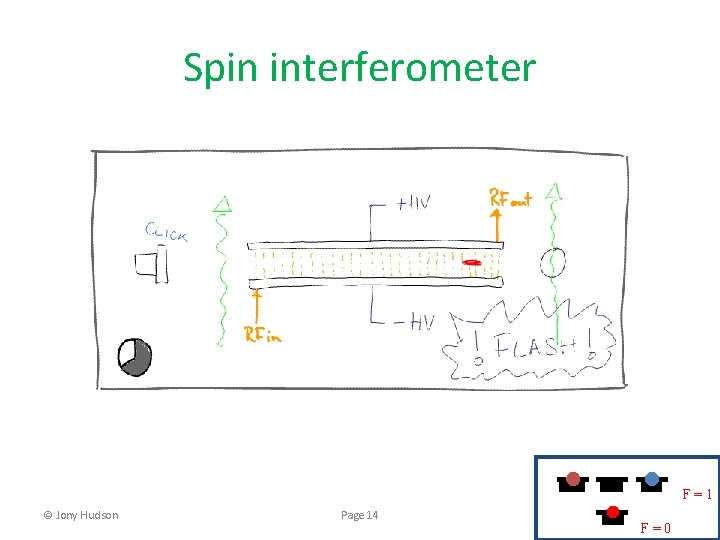
Spin interferometer F=1 © Jony Hudson Page 14 F=0
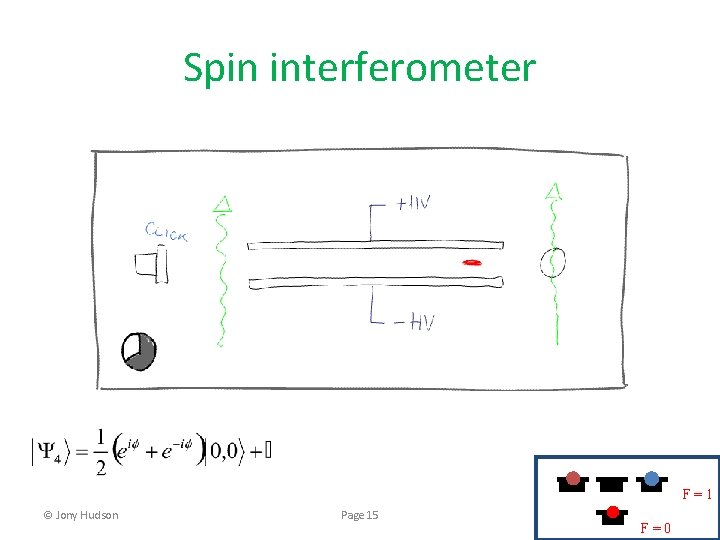
Spin interferometer F=1 © Jony Hudson Page 15 F=0
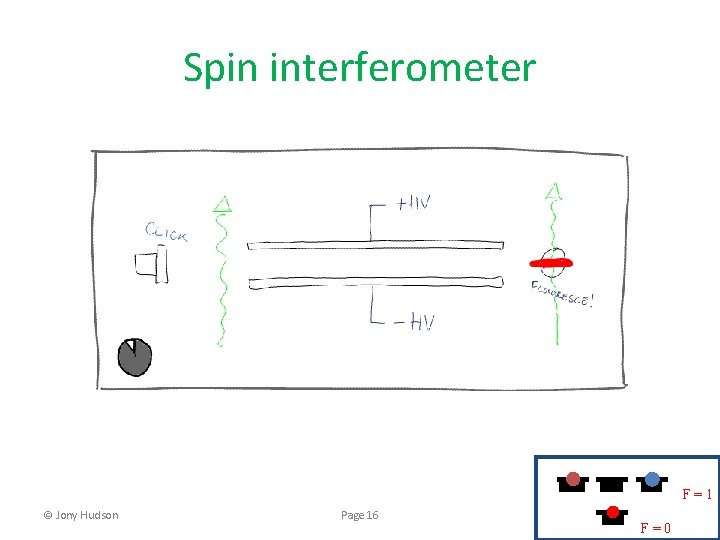
Spin interferometer F=1 © Jony Hudson Page 16 F=0
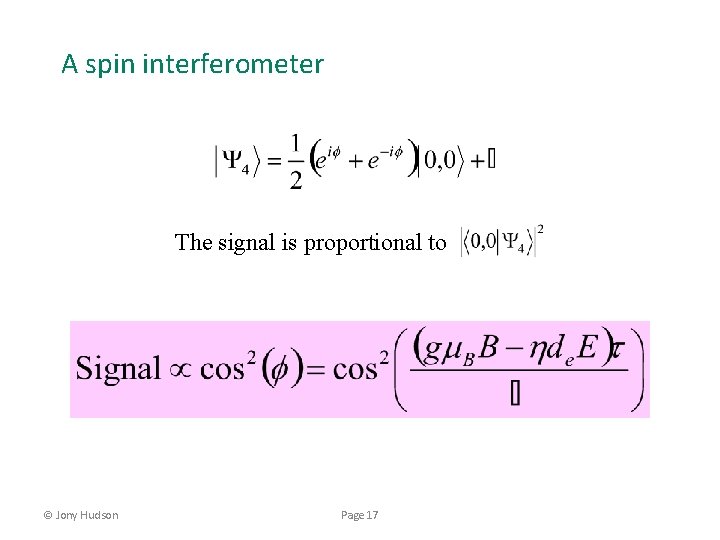
A spin interferometer The signal is proportional to © Jony Hudson Page 17
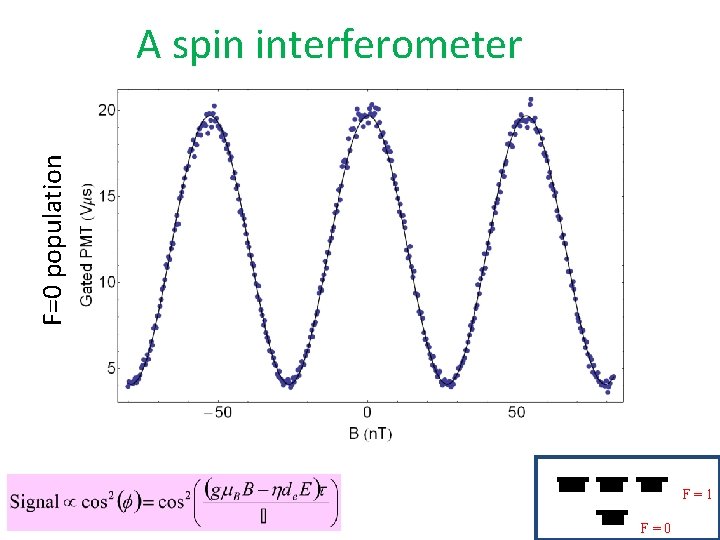
F=0 population A spin interferometer F=1 Page 18 © Jony Hudson F=0
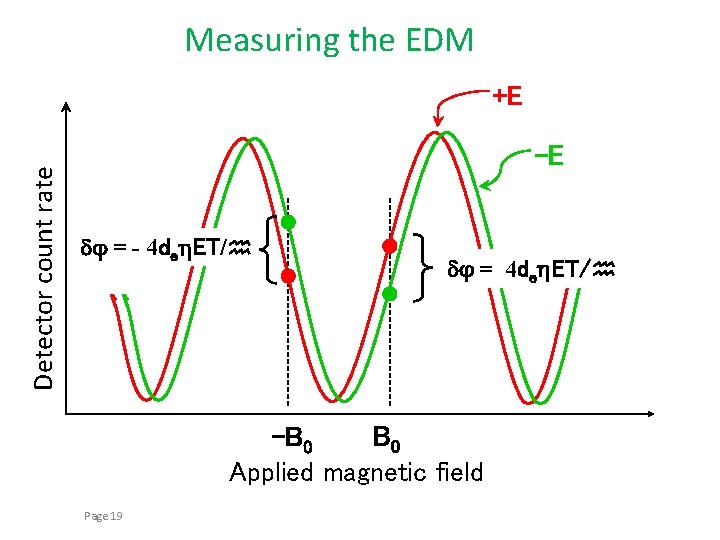
Measuring the EDM Detector count rate +E -E dj = - 4 deh. ET/h dj = 4 deh. ET/h B 0 -B 0 Applied magnetic field Page 19
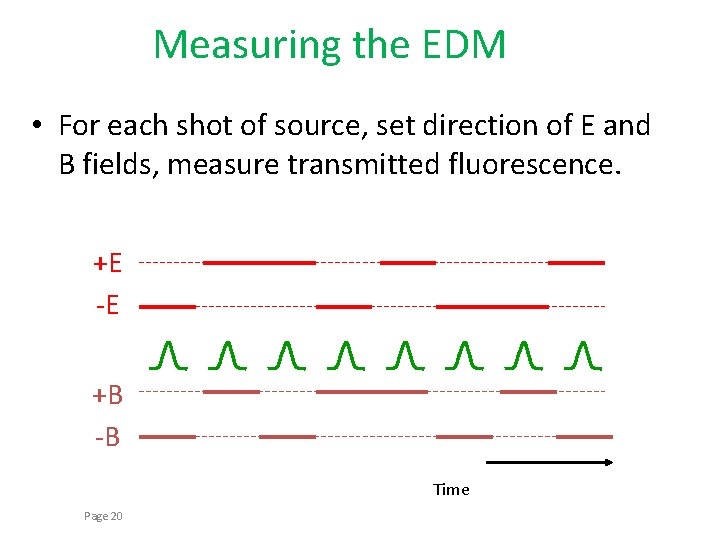
Measuring the EDM • For each shot of source, set direction of E and B fields, measure transmitted fluorescence. +E -E +B -B Time Page 20
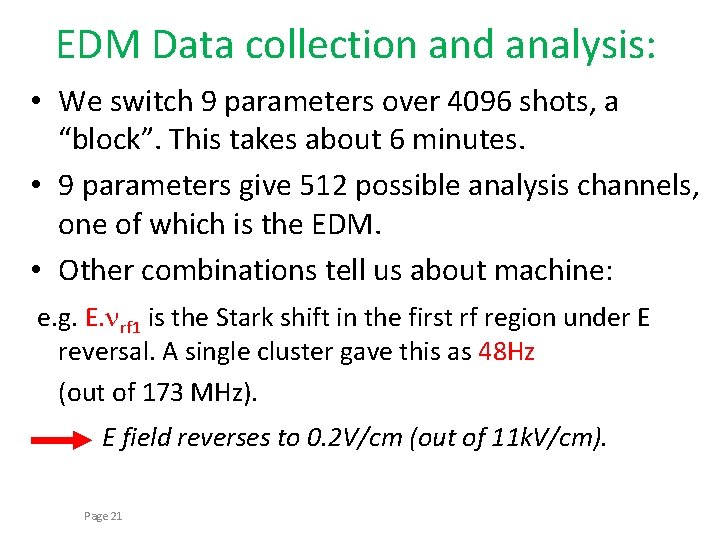
EDM Data collection and analysis: • We switch 9 parameters over 4096 shots, a “block”. This takes about 6 minutes. • 9 parameters give 512 possible analysis channels, one of which is the EDM. • Other combinations tell us about machine: e. g. E. nrf 1 is the Stark shift in the first rf region under E reversal. A single cluster gave this as 48 Hz (out of 173 MHz). E field reverses to 0. 2 V/cm (out of 11 k. V/cm). Page 21
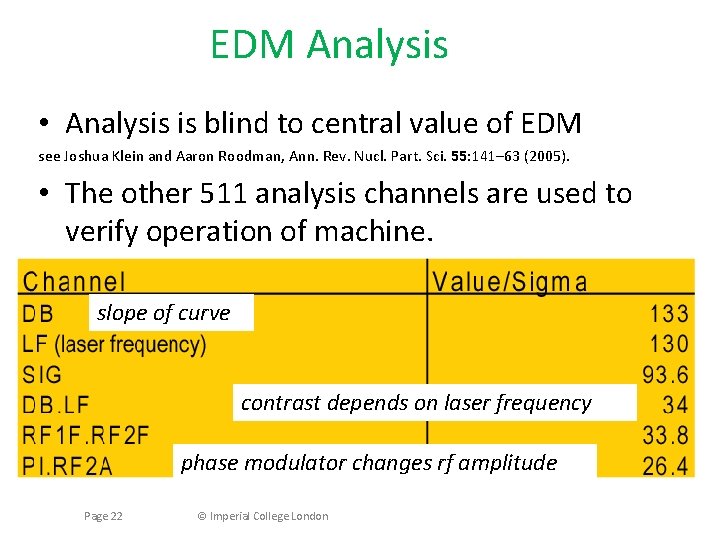
EDM Analysis • Analysis is blind to central value of EDM see Joshua Klein and Aaron Roodman, Ann. Rev. Nucl. Part. Sci. 55: 141– 63 (2005). • The other 511 analysis channels are used to verify operation of machine. slope of curve contrast depends on laser frequency phase modulator changes rf amplitude Page 22 © Imperial College London
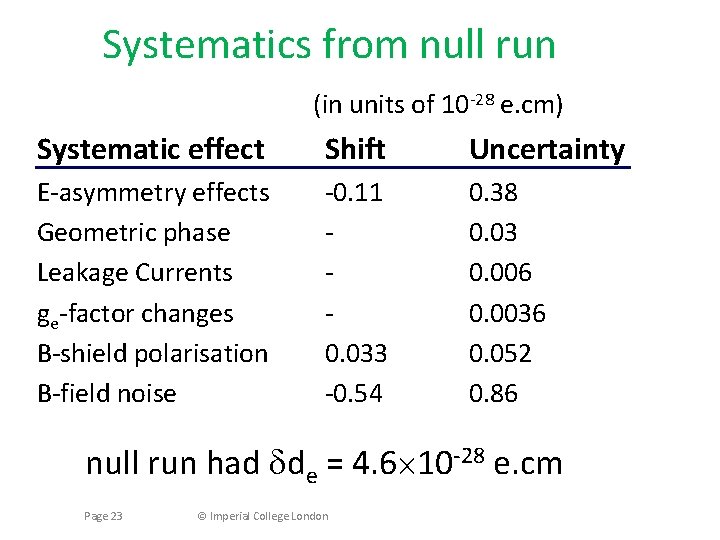
Systematics from null run (in units of 10 -28 e. cm) Systematic effect Shift Uncertainty E-asymmetry effects Geometric phase Leakage Currents ge-factor changes B-shield polarisation B-field noise -0. 11 0. 033 -0. 54 0. 38 0. 03 0. 006 0. 0036 0. 052 0. 86 null run had dde = 4. 6´ 10 -28 e. cm Page 23 © Imperial College London
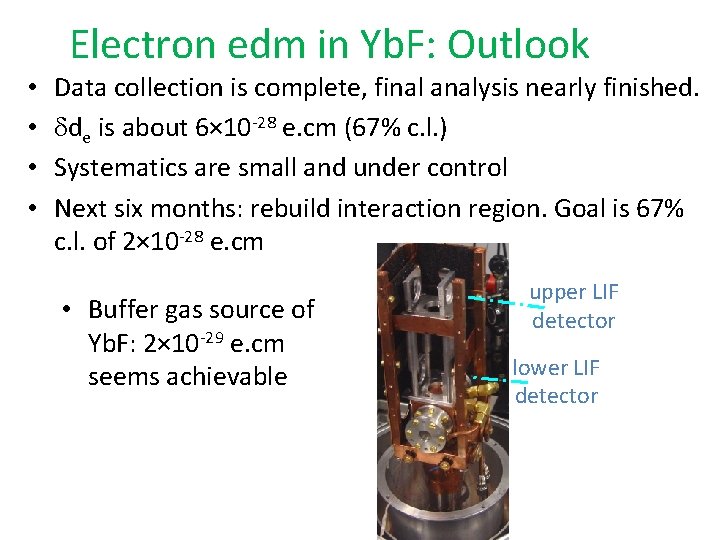
• • Electron edm in Yb. F: Outlook Data collection is complete, final analysis nearly finished. dde is about 6× 10 -28 e. cm (67% c. l. ) Systematics are small and under control Next six months: rebuild interaction region. Goal is 67% c. l. of 2× 10 -28 e. cm • Buffer gas source of Yb. F: 2× 10 -29 e. cm seems achievable upper LIF detector lower LIF detector
Acknowledgements Ed Hinds Jony Hudson Mike Tarbutt Suresh Doravari Dhiren Kara Joe Smallman
- Slides: 25