Status of the measurement of KL lifetime April


 for each neutral cluster build a Lk 2) order")


/fit 1) Decay path recontructed using the")
 Select events with a vertex in DC and 2")
 Vertex reconstruction efficiency MC: ε (<Lγγ>) vs LK (true) MC: π+π-π0 “true” MC:")
: The selection criteria must not bias the vertex reconstruction efficiency")
: Background: Background ~ 1 % Control plot: M (π0) from")
 Resolutions: KL + - 0 data sample σ(1γ) σ(2γ)")
 Weighted Average: With the KL π+π-π0 sample we can check the 1/ (E)")
/fit KL decay path: residuals: ± 0. 5% 0. 38% stat Fit region: 50–")
: Lk fit vs Lmin χ2 vs Lmin")
: Lk fit vs Lmax χ2 vs Lmax")
: Check if the π0π0π0 selection introduces some bias in the")
: Cluster multeplicity: multeplicity Cluster energy:")
 Total energy for N = 3 Total energy for N =")
 Total energy for N = 5 Total energy for N =")
 = (51. 15 ± 0. 2) ns residuals t (PDG) (fit)")
. • Decay vertex reconstructed using")
- Slides: 23
Status of the measurement of KL lifetime April 28 th, 2004 - Data sample (old): ~ 440 pb-1 (2001+2002) - MC sample: ~125 pb-1 ( mk 0 stream ) Selection: • standard tag (|DMKS| < 5 Me. V, |Dp*|< 10 Me. V) : e ~ 63%. • t 0 reconstructed assuming a bunch crossing every 5. 43 ns: ~ 100% correct identification • filter request: a tag plus at least 2 neutral cluster on EMC. both π+π-π0 and π0π0π0 in the same filtered data sample • 3 0 selection as in the PLB 566(2003) 61 (KLOE note n. 182 in details) • Neutral vertex algorithm modified.
Considerations and open questions: - The main characteristic of this decay is to have a large number of photons and the strong point of this analysis is to keep (almost) all the photons that are produced (N 3). This method makes the effects of the cluster reconstruction efficiency and the acceptance very small. -Two things must be taken under control: 1) the background; 2) the variation of the reconstruction efficiency of the decay vertex with the decay path. is it possibile to use data in some way?
Lifetime with a fixed number of clusters: We have to use all the photons if we want to avoid acceptance corrections
“Standard” neutral vertex algorithm: 1) for each neutral cluster build a Lk 2) order the Lk in ascending order along the KL flight direction 3) look for the closest 3 Lk that satisfy |Lk 3 - Lk 1| < 6 σ1γ 4) If found, build <Lk>. 5) Look ahead and behind if there are other Lki that satisfy |Lki - <LK>| < 6 σ tot = σ (<L>) σ (1γ) 6) Build the weighted average with all the photons that satisfy these criteria. No way to test reconstruction efficiency uniformity using data (no control sample with 3 photons). Lki-1 Lki <Lk> Lkn
Vertex reconstruction efficiency: π0π0π0 from MC
First attempt: try to use the most energetic photon in the event Advantage: I can use the KL π+π-π0 sample to check the variation of the vertex reconstruction efficiency with the decay path. Disadvantage: I loose resolution (but for lifetime is not so critical…. )
fit region: 35 cm – 165 cm (fit-data)/fit 1) Decay path recontructed using the most energetic photon ± 1% more data than foreseen…. . regeneration? background? efficiency? - If I use the most energetic photon I cannot avoid background. - Background is mainly concentrated at low LK. - The rejection of background introduces again some dependency of the efficiency with Lk (which makes the idea useless).
“Modified” neutral vertex algorithm: 1) Select events with a vertex in DC and 2 clusters not associated to tracks. 2) For each neutral cluster build a Lki. 3) Order the Lki in ascending order along the KL flight direction 4) Look for the closest 2 Lk that satisfy |Lk 2 - Lk 1| < 6 σ1γ and build the weighted average. 5) Go ahead and behind to look for other clusters that satisfy: |Lki – <LK > | < 6 σtot , σtot = σ1γ σ2γ 6) The event is kept if there is at least a third cluster in time with the closest two (MC probability ~ 99. 4%) (validation). Lki-1 Lkn <Lk> Now I can use the KL π+π-π0 sample to evaluate everything
1) Vertex reconstruction efficiency MC: ε (<Lγγ>) vs LK (true) MC: π+π-π0 “true” MC: π+π-π0 “selected” LK (true) (cm) DATA: ε (<Lγγ>) vs LK (π+π-) DATA: π+π-π0 “selected” LK (π+π-) (cm)
KL π+π-π0 selection (I): The selection criteria must not bias the vertex reconstruction efficiency Cut on the charged sector: Pmiss- Emiss Cut on the neutral sector: E(π0)(expected) – E(π0)(γγ)
KL π+π-π0 selection (II): Background: Background ~ 1 % Control plot: M (π0) from the best two γ
2) Resolutions: KL + - 0 data sample σ(1γ) σ(2γ)
3) Weighted Average: With the KL π+π-π0 sample we can check the 1/ (E) behavior: σ(LK) vs LK (π+π-) σ(LK) vs Eγ
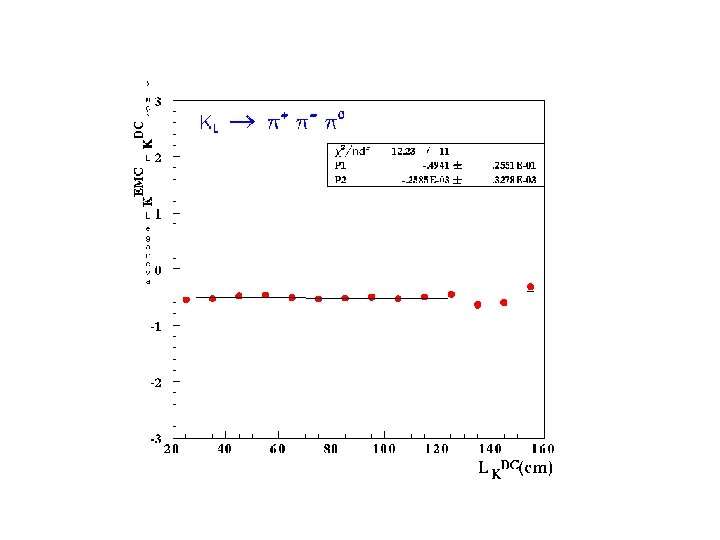
(fit-data)/fit KL decay path: residuals: ± 0. 5% 0. 38% stat Fit region: 50– 158 cm
KL decay path (II): Lk fit vs Lmin χ2 vs Lmin
KL decay path (III): Lk fit vs Lmax χ2 vs Lmax
KL decay path (IV): Check if the π0π0π0 selection introduces some bias in the lifetime MC before selection: MC after selection: The two results are in agreement within the errors Lk(true)
DATA QUALITY (I): Cluster multeplicity: multeplicity Cluster energy:
DATA QUALITY (II) Total energy for N = 3 Total energy for N = 4
DATA QUALITY (III) Total energy for N = 5 Total energy for N = 6 Total energy for N=7 Total energy for N=8, 9, …
Result: τ (KL) = (51. 15 ± 0. 2) ns residuals t (PDG) (fit) = (51. 7 ± 0. 4) ns t (Vosburg, 1972) = (51. 54 ± 0. 44) ns - 0. 4 Mevents t (KLOE) = (51. 15 ± 0. 2 stat ) ns - 14. 5 Mevents – 440 pb-1
Conclusions: • Full data sample analysed (~ 440 pb-1). • Decay vertex reconstructed using the weighted average of the two closest photons. • Vertex reconstruction efficiency variations evaluated using π+π-π0 data sample. • Fit region defined as the maximum range with minimum efficiency variations and minimum spread of the residuals: • Statistical error in fit region is 0. 38%. • Systematic error at present seems below the statistical error.