Status of RPC trigger analysis and Muon Trigger


 =")
 4) 5) 6) Isolation efficiency εiso Single muon trigger efficiency εtrig Acceptance of")


 2) 3) 4) 5) Trigger Name HLT_Jet")


- Slides: 37
Status of RPC trigger analysis and Muon Trigger efficiencies for W->μν study By Archana Sharma, Suman B. Beri Panjab University Chandigarh India-CMS Meeting March, 2009
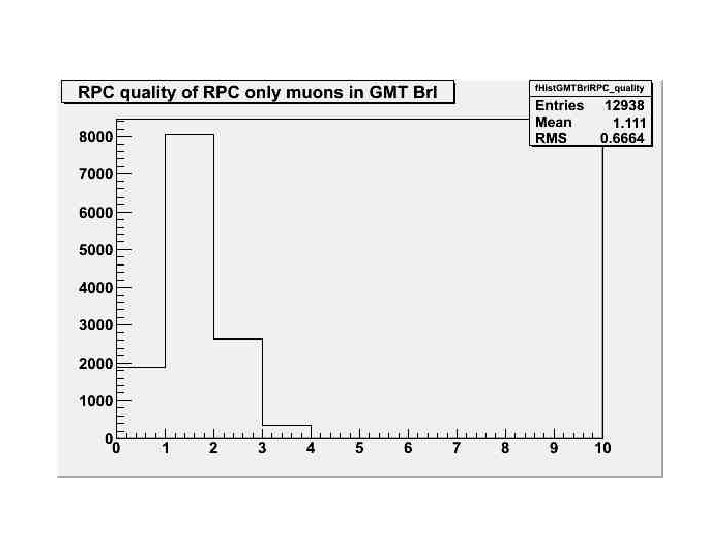
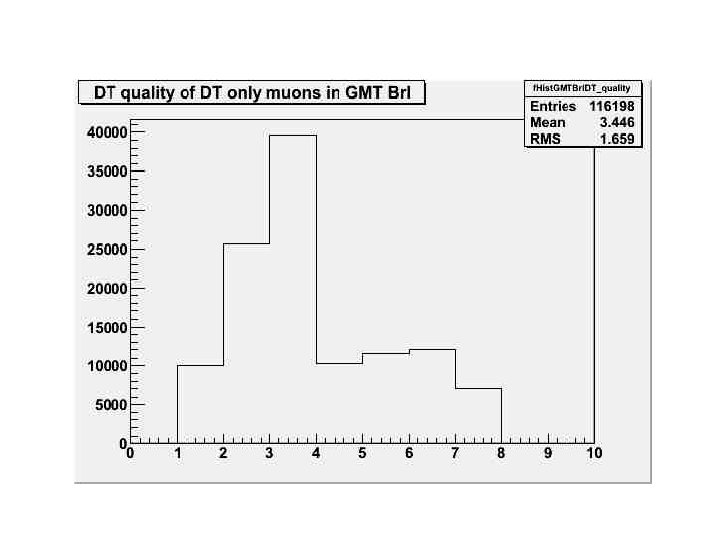
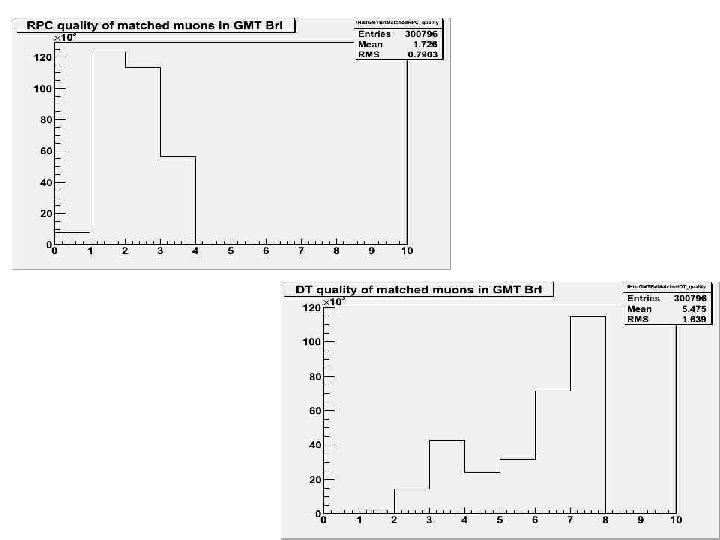
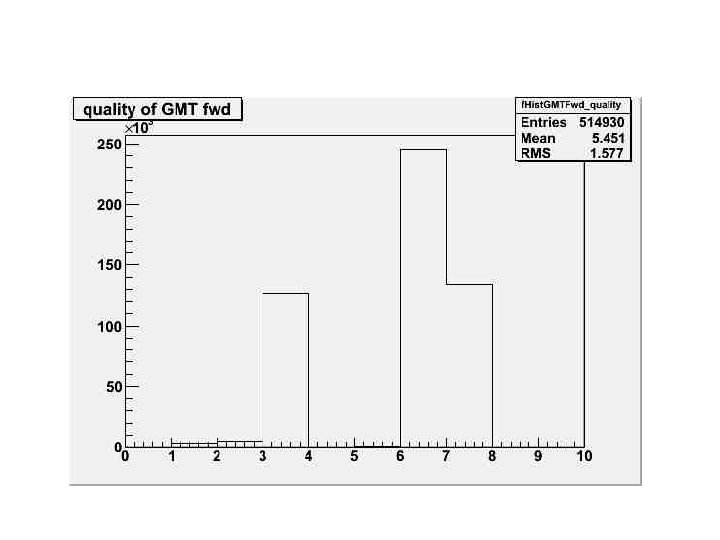
RPC Trigger Analysis • Muon trigger is organized into subsystems representing three different muon detector systems, DT trigger in barrel, CSC trigger in endcap and RPC trigger covering both barrel & endcap upto η = 2. 1. • DT & CSC electronics first process information from each chamber locally, called local triggers. Upto four best (highest pt & quality) muons are selected & sent to GMT. • In RPC there is no local processing. RPC muon sorter selects 4 highest pt muons from barrel & 4 from endcap and send them to GMT, which after comparing all muons & send 4 high pt muons to Global Trigger.
Muon Trigger Data Flow
• We want to extract trigger/reconstruction efficiencies for RPC in general directly from data. • There are two ways of doing this. 1) Determination of RPC efficiencies with respect to DT/CSC. 2) Determining the sources of correlation between DT/CSC verses RPC. There are three sources of correlation : 1) Global Muon Trigger 2) Geometry 3) Timing CMSSW version : CMSSW_2_1_8 Sample : Wmunu/Summer 08_IDEAL_V 9_v 1/GEN-SIM-RECO
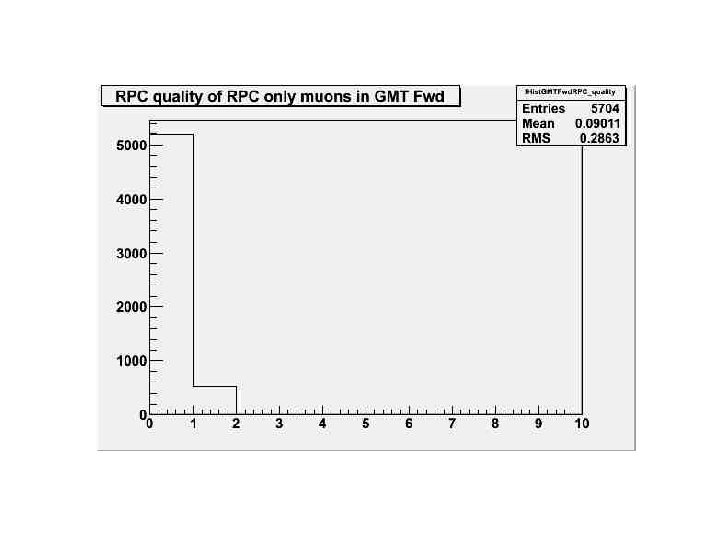
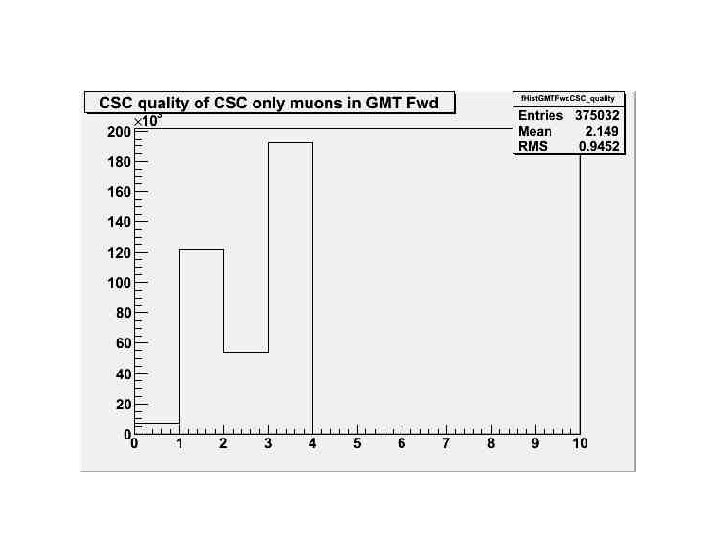
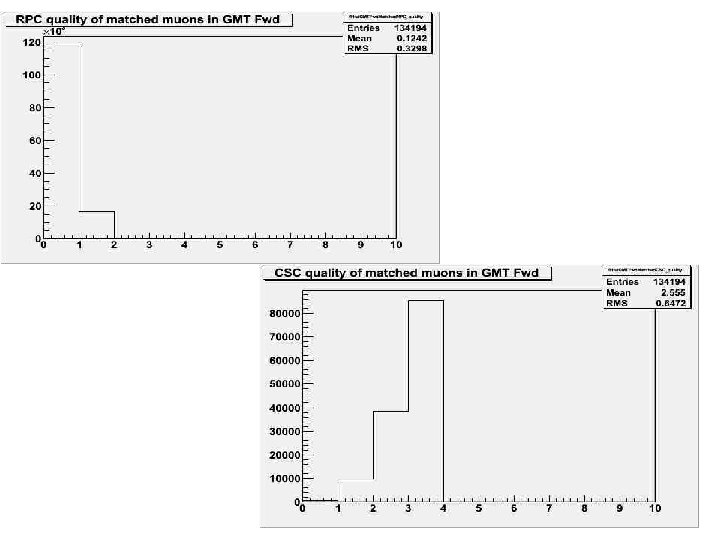
Some Plots
Efficiency of RPC barrel with DT and with trigger Emulator RPC Eff with trigger emulator RPC Eff with DT
Efficiency of RPC Forward with CSC and with trigger Emulator RPC Eff with trigger emulator RPC Eff with CSC
• We will select restricted regions of eta and phi for the high quality DT muons in order to calculate the RPC efficiency in different chambers. • Will plot the RPC efficiency with respect to these high quality DT muons and with trigger emulator with respect to pt. • Ideally there should be perfect matching between the two efficiencies at least for high pt region which means that the correlation is zero and we have an unbiased selection of RPC efficiency. • And if this will not happen this means that may be there is some correlation between DT/CSC and RPC or some other reason which need to be investigated.
Muon Trigger Efficiencies for W →μν analysis • Inclusive processes pp → W + X and pp → Z + X with decay of W & Z into leptons important processes at LHC. • Large cross section and simple signatures. • Unique tools to calibrate detector , establish identification criteria & establish detector efficiencies. • Events with one isolated, high pt muons and missing transverse energy consistence with presence of neutrino can be used to select high purity W →μν sample
W Selection • One global muon with pt > 25 Ge. V. Events with two muons with pt > 20 Ge. V rejected. • Muon must be isolated with default criteria Σ pt/pt > 0. 09 in cone of ΔR < 0. 3. • Contribution from top events containing muons reduced by rejecting events with more than 3 jets with ET > 40 Ge. V and events in which acoplanarity ζ between muon and MET is greater than 1 radian.
• Missing transverse mass of reconstructed W system, MT must be greater than 50 Ge. V and less than 200 Ge. V. MT distribution of W →μν and its backgrounds after selection at normal and logarithmic scale. Number of events used corresponds to those expected for 10 pb-1 integrated luminosity.
• W →μν cross section given by: σW X BR (W →μν) = Nsig. W - Nbkgd. W /εW X ∫L dt Where Nsig. W and Nbkgd. W number of signal & background events passing selection and εW efficiency of triggering, reconstruction and selection of W →μν events. εW efficiency of W →μν takes into account 1) acceptance of kinematical cuts (pt > 25 Ge. V, |η| < 2. 0) εacc 2) global muon reconstruction efficiency εrec which is product of three factors: εstandalone X εtracker X εmatching where εstandalone efficiency to find muon candidate in muon spectrometer εtracker efficiency to find muon candidate in tracker εmatching probability to find correct matching between standalone and tracker candidate •
3) 4) 5) 6) Isolation efficiency εiso Single muon trigger efficiency εtrig Acceptance of missing transverse energy cut εMET Acceptance of cuts rejecting ttbar and dimuon events εrej Only εacc & εrej are estimated from Monte Carlo. εrec , εiso , εtrig calculated from efficiencies determined with Z →μ +μ data, using Tag & Probe method. εMET also estimated with data.
Alternative Method: • Thus in the framework of W-cross section determination, we rely on Tag & Probe techniques to evaluate Muon trigger efficiencies. • This method needs a minimal luminosity to achieve reasonable statistics to determine these trigger efficiencies. • But is there any alternative method to evaluate trigger efficiencies in the early phase of running i. e. at low luminosities? ? ? • We are doing a feasibility study to make an unbiased selection of a sample where we can evaluate the Muon trigger efficiencies with different QCD samples.
• Study is based on unbiased selection of sample different to Z → μ +μ -. • A QCD sample is selected and some part of this sample is again selected by triggers other than muon triggers (Jet, electron triggers etc. ) not to bias the sample. • W selection is performed on this selected unbiased sample after which muon trigger whose efficiency to calculate is applied. • First part of Study was done with CSA 07 sample at 14 Te. V. • Sample Used: /pp. Mu. Pt 20 -15/CMSSW_1_6_7 -CSA 07 -1205151815/AODSIM
Efficiency of Single. Muon. Non. Iso trigger : Efficiency of smnoiso trigger = No. of events trigger by smnoiso+selected offline +Other trigger/No. of events passing selected offline+other trigger Average efficiency of smnoiso trigger for tight selection = 60% Average efficiency of smnoiso trigger for relaxed selection = 50%
• The efficiency of HLT 1 Non. Muon. Iso trigger obtained by using different non Muon triggers (av. 60%) & MC efficiency (63%) is in close agreement. • Same is for relaxed selection in which MC efficiency is 53% & with respect to other triggers is 50% (av. ). • We may reach a reasonable statistics with a QCD sample, selected with non Muon triggers to evaluate the non Isolated Muon Trigger Efficiency. • But no comparisons with Tag & Probe efficiencies were done as the sample seemed to have some problems with HLT simulation that make the efficiency very low. • So again repeated same exercise with new QCD sample and in new CMSSW version
Sample used for Signal Study : /Wmunu/Summer 08_IDEAL_V 9_v 1/GEN-SIM-RECO • Sample used for Background Study : /Inclusive. Mu. Pt 15/Summer 08_IDEAL_V 9_v 1/GEN-SIM-RECO • New production of samples at 10 Te. V at which cross section are lower ~ 40% than at 14 Te. V. σ(ppmu. X at 14 Te. V) = 0. 820 mb filter efficiency = 0. 00028 Number of ppmu. X expected at luminosity 10 pb¯¹ = 22. 96 X 10⁵ σ(ppmu. X at 10 Te. V) = 0. 5091 mb filter efficiency = 0. 000239 Number of ppmu. X expected at luminosity 10 pb¯¹ = 12. 2 X 10⁵ • So at 10 Te. V we have a bit more than 50% of events what we had before. •
• For the signal W→μν the expected number of events at 14 Te. V : σ(W→μν at 14 Te. V) = 17. 17 nb filter efficiency = 0. 6418 Number of W→μν expected at luminosity 10 pb¯¹ = 13. 223 X 10³ events • Where as the number of events at 10 Te. V σ(W→μν at 10 Te. V) = 11865 pb filter efficiency = 0. 691 Number of W→μν expected at luminosity 10 pb¯¹ = 98384 ~100 K events • So the number of events at 10 Te. V get reduced compared to 14 Te. V
The expected number of trigger bits expected at 10 Te. V and luminosity 10 pb¯¹ for the Background sample HLT_Mu 15 HLT_Jet 80 HLT_Jet 50 HLT_Jet 110 HLT_Jet 30 HLT_Jet 250 HLT_Iso. Ele 15_L 1 I HLT_Iso. Ele 18_L 1 R 12. 2 X 10⁵ number of events analyzed which corresponds to the statistics at 10 Te. V and luminosity 10 pb¯¹
On Log Scale HLT_Jet 30 HLT_Jet 250 HLT_Jet 110 HLT_Iso. Ele 18_L 1 R HLT_Jet 80 HLT_Iso. Ele 15_L 1 I HLT_Mu 15
Selected seven non muon triggers : 1) 2) 3) 4) 5) Trigger Name HLT_Jet 30 HLT_Jet 50 HLT_Jet 80 HLT_Jet 110 HLT_Jet 250 Because many events fire these triggers & expected statistics may be large. But as they are pre-scaled triggers, depending upon the scaling factor , this a-priory statistics may be reduced. 1) HLT_Iso. Ele 15_L 1 I 2) HLT_Iso. Ele 18_L 1 R These electron triggers are completely different from muon triggers. Statistics may be low but sufficient.
Expected Statistics of selected Non Muon triggers for the Background Inclusive. Mu. Pt 15 sample for 10 pb¯¹ Trigger name Events for Non Muon triggers + W offline selection+HLTMu 15 trigger HLT_Jet 30 1372 18 16 HLT_Jet 50 1455 20 18 HLT_Jet 80 934807 3271 2850 HLT_Jet 110 467089 1701 1480 HLT_Jet 250 152985 482 424 HLT_Iso. Ele 15_L 1 I 58273 153 128 HLT_Iso. Ele 18_L 1 R 2439 1 1
Expected Statistics for the Background Inclusive. Mu. Pt 15 sample for 50 million analyzed events Trigger name Events for Non Muon triggers Events for Non Muon Events for Non triggers + W offline Muon triggers + W selection offline selection+ HLTMu 15 trigger HLT_Jet 30 5802 85 73 HLT_Jet 50 6267 76 69 HLT_Jet 80 4028728 14311 12462 HLT_Jet 110 2012815 7561 6558 HLT_Jet 250 658778 2221 1936 HLT_Iso. Ele 15_L 1 I 250523 751 652 HLT_Iso. Ele 18_L 1 R 10633 26 23
Efficiency of Single. Muon. Non. Iso trigger : Efficiency of HLTMu 15 trigger = No. of events trigger by HLTMu 15+selected offline +Non. Muontriggers/ No. of events passing selected offline+Non. Muontriggers Average efficiency of HLTMu 15 trigger = 87. 5%
MC efficiency of HLTMu 15 trigger = No. of events passing W offline+HLTMu 15 trigger/ No. of events passing W offline selection MC efficiency of HLTMu 15 trigger from the W→μν signal events = 90%
Comparison of Pt distributions Where: Black Curve -> HLTMu 15 muon events triggered by HLT_Jet 30+select ed offline Red Curve -> HLTMu 15 muon events triggered by HLT_Jet 50 +selected offline Green Curve -> HLTMu 15 muon events selected offline
Comparison of Eta distributions
Summary • This is a exercise with the new samples for studying the feasibility of determining the Muon trigger efficiencies with other samples different from Zmumu samples. • MC efficiency of HLTMu 15 trigger from W→μν signal events is 90% while calculated from background sample with non muon triggers is 87. 5%. So both are in close agreement. • As the statistics at 10 pb¯¹ are not very promising so we cant be sure about the results we got with this statistics. • Thus the work to be repeated for the new samples for CMSSW_3_1_x series in which new trigger table will be included. • Study of muon decay in flight. The idea is to characterize these muons and see how many survive the W selection criteria so as to estimate the background from these muons.